
without_worries
@t_without_worries

What symbols does the trader recommend buying?
Purchase History
پیام های تریدر
Filter
without_worries
Bitcoin Gaussian channel vs Strategy's leveraged long flywheel
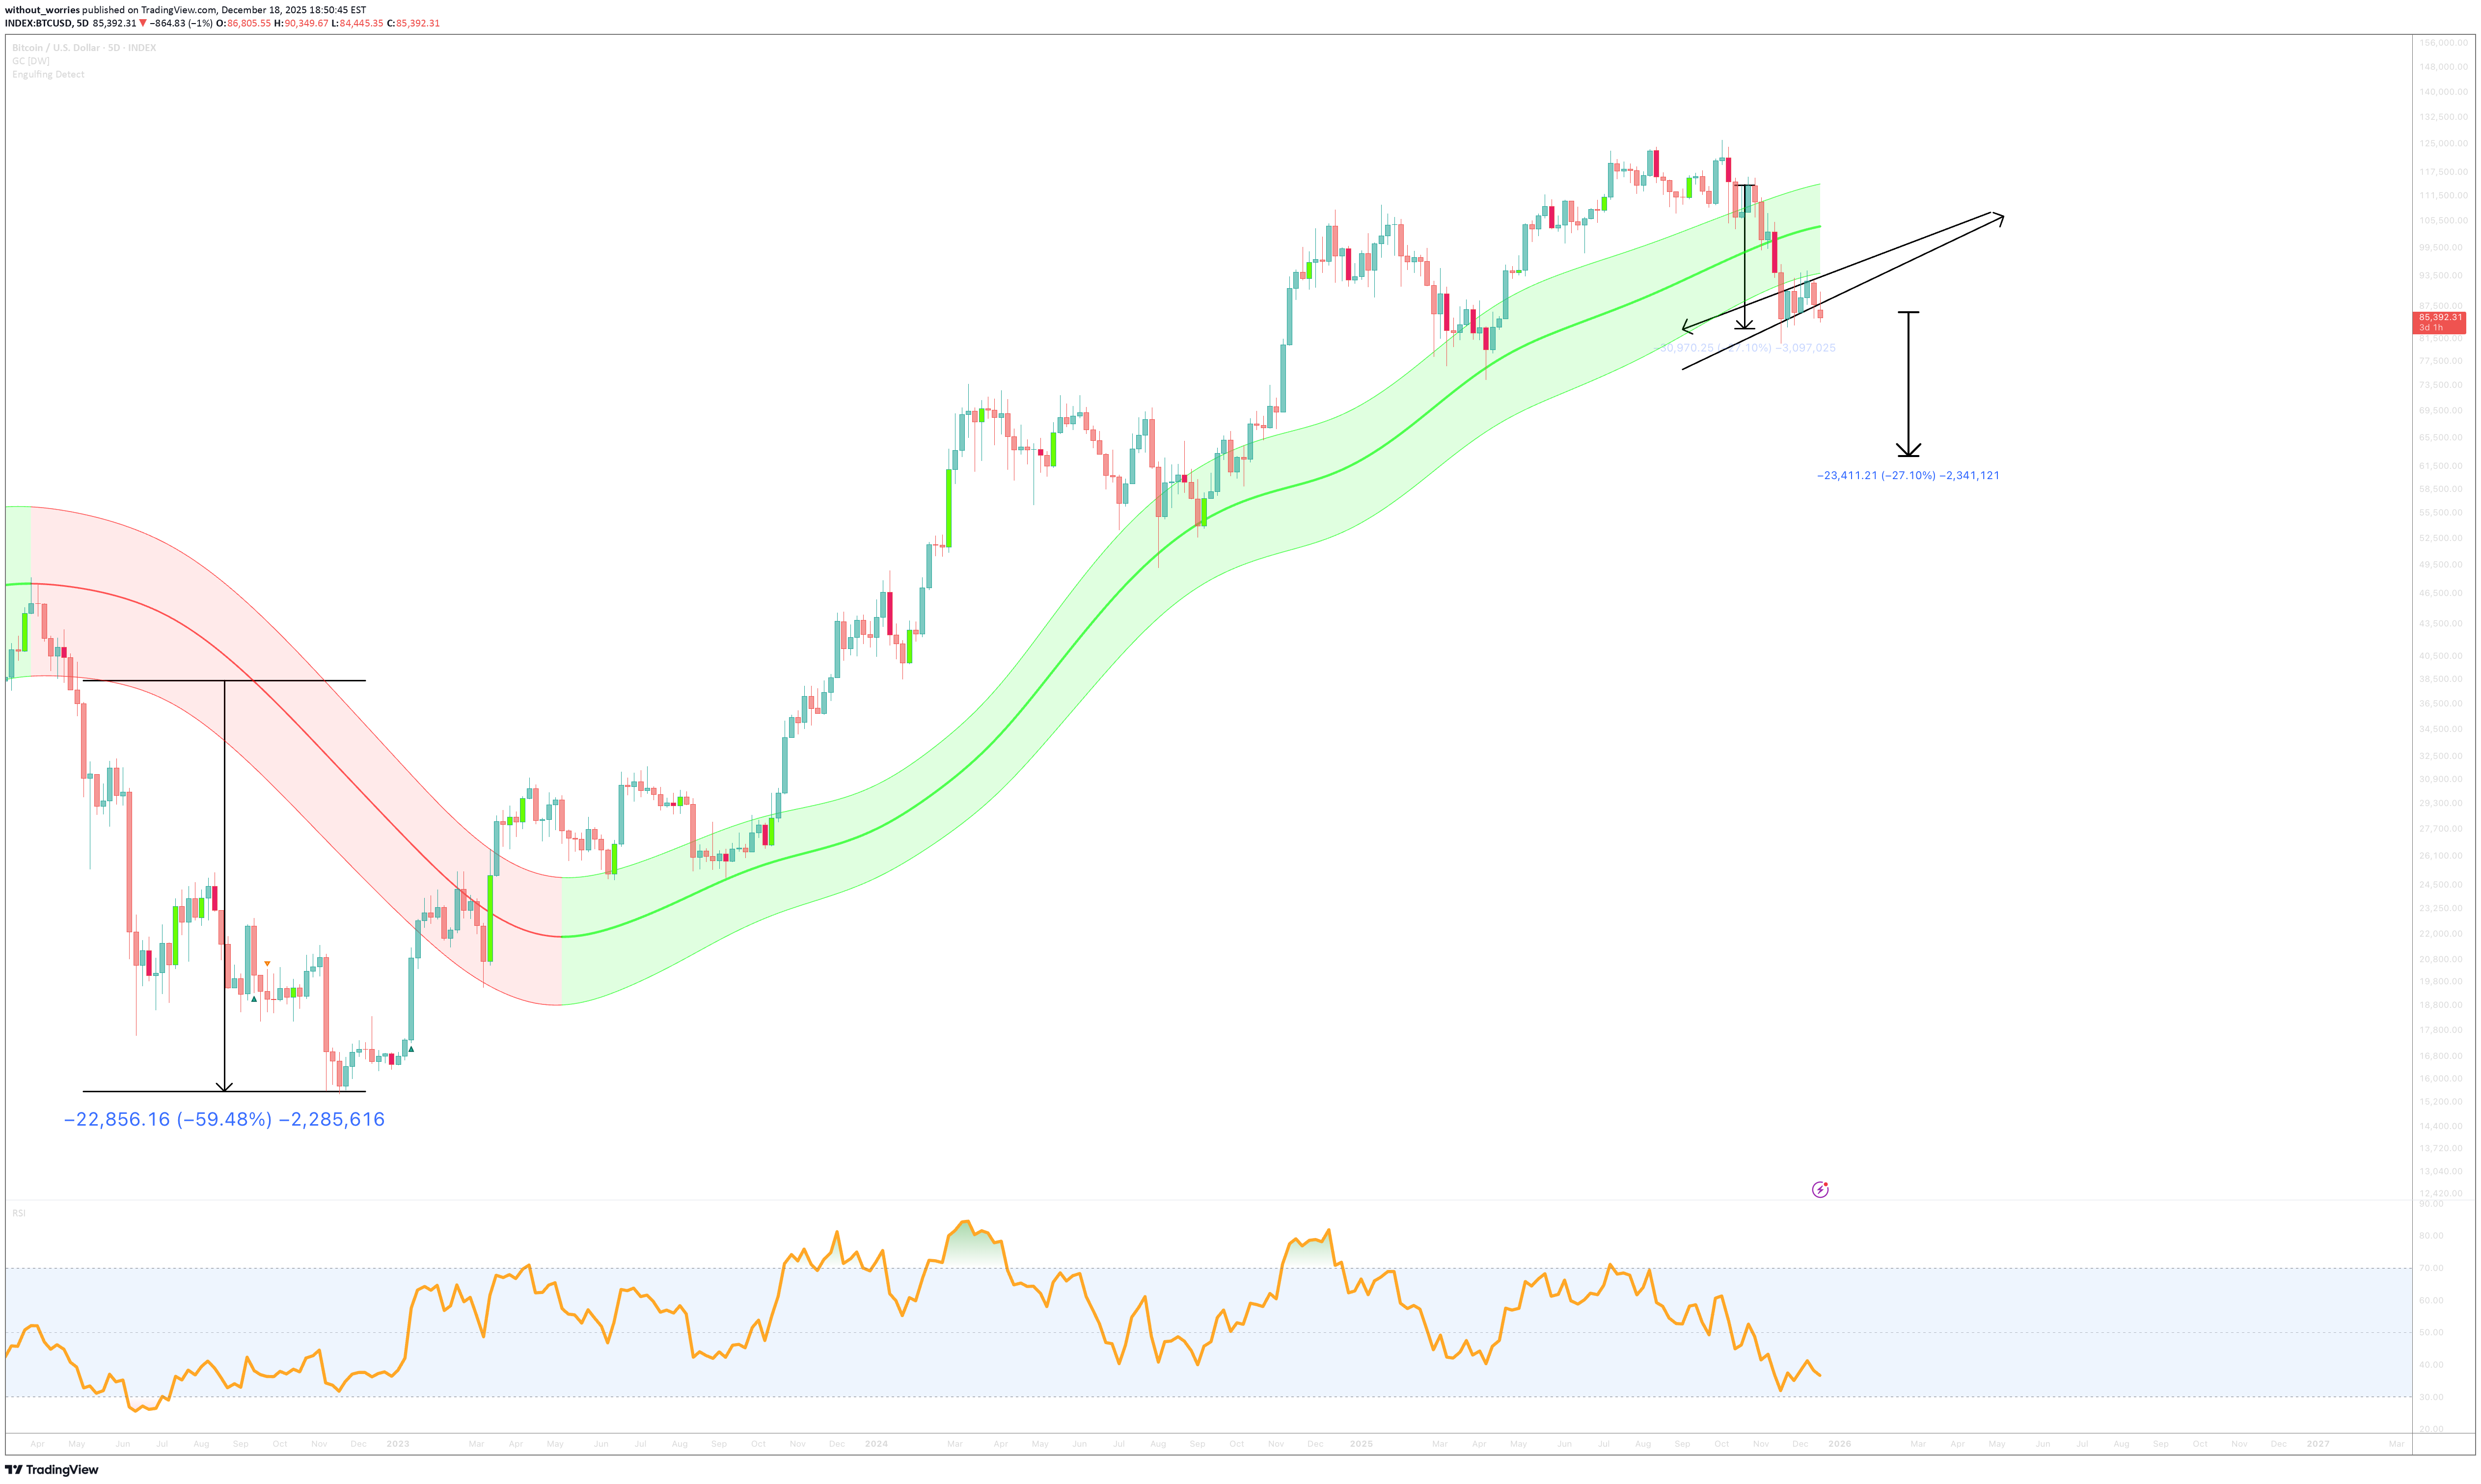
For most of the bull run price rode the Gaussian channel like a moving runway: pullbacks tagged the mid-band, buyers defended, trend continued. The last swing changed that. We got a clean displacement down through the 5 day channel and now BTC is compressing under/inside the band in what resembles a rising wedge attempt. That’s not “game over” by itself, but it is the same kind of “regime change” that historically turns smooth uptrends into ugly, time wasting corrections. The key observation When BTC is above the Gaussian channel and the slope is positive (green), risk markets treat the move like it’s “funded.” When BTC closes below the channel, the market starts acting like credit just tightened. That matters because Strategy’s risk isn’t a magical liquidation button. It’s a financing loop. BTC trending up? Then MSTR tends to trade rich, capital raises are easier, more BTC bought and the flywheel spins faster. So much win. BTC trend breaks? MSTR multiple compresses, capital raises get expensive, obligations become louder, flywheel develops square edges. So BTC closing below the channel is the chart equivalent of Strategy hearing the banker clear his throat. 5 day historical closes below the Gaussian channel Price structure: what the wedge is really saying Right now, the market is doing the classic “I’ll bounce… but not with conviction” behaviour. You must have noticed every time price action climbs surely and slowly it is hammered down in one swift 10 minute $5-10k sell off. That's not retail. That's someone who knows the fan and back of a dogs bum after a huge curry are about to meet. 50-60% corrections are typical once Gaussian channel resistance is confirmed. That's in addition to the already made 30% correction from $126k. A confirmation takes price action down to the $36k area. Why this matters specifically for Strategy Think of Strategy as a trader who doesn’t get auto liquidated, but does have: scheduled obligations (interest + preferred dividends), a reputation trade (mNAV / “BTC proxy premium”), and a dependency on market windows to refinance or raise. When BTC is trending cleanly, the market ignores the obligations. When BTC breaks trend, the obligations become the plot. So the risk isn’t “Strategy must sell tomorrow.” The risk is: BTC drawdown + MSTR premium compression = less flexibility = fewer “nice options” = higher chance they choose an “ugly option” (dilution, costly financing, or BTC sales) In other words: a BTC regime flip turns Strategy’s bold bet into a test of liquidity optics. Scenarios to watch 1) Bear continuation (base case if price stays under the channel) Price fails to reclaim the Gaussian channel (especially the mid/upper band). Wedge support breaks, downside expansion develops. Target zone: low $60Ks Narrative match: Strategy’s flywheel slows, market starts pricing the balance sheet like it matters again. 2) Bull save BTC reclaims the channel and holds it (not a wick, a candle body close and follow through) with a break above wedge resistance and converts it into support. Then the “forced selling” fear premium fades fast. Narrative match: financing window reopens, reflexivity returns. Closing thoughts The Gaussian channel isn't a crystal ball; it's a mood monitor for the market. And right now, it's showing a shift from "euphoric greed" to "nervous sweating." Price has been kicked out of its smooth uptrend and is now flopping around below the channel like a fish on the dock. That's not a healthy pullback; it's a regime change. For Michael Saylor and MicroStrategy (MSTR), this isn't about a magic liquidation threshold. It's about oxygen. Their entire leveraged long flywheel requires the high-octane fuel of a bullish trend. BTC closing below this channel is the equivalent of the engine starting to sputter. The obligations don't disappear; they just get a lot louder when the music stops. Ww Disclaimer =================================================================== Let's be brutally honest here. This is an observation, not an instruction manual. I'm connecting dots on a chart and speculating about corporate finance like an armchair quarterback. I am not a registered financial advisor, and this is absolutely not financial advice. Trading and investing, especially in volatile assets like Bitcoin and related equities (like MSTR), is a fantastic way to incinerate capital. You can and likely will lose money. The models (Gaussian channels, wedges) are just pretty stories we tell about past price movements. The market has a PhD in humbling overconfident analysts. MicroStrategy is a complex entity with liabilities, strategies, and management decisions that are entirely opaque to us on the outside. This flywheel theory is a simplification. The company could have plans, hedges, or lines of credit we know nothing about. Or it could be closer to the edge than anyone realises. We. Don't. Know. Do your own research! Now, if you'll excuse me, I need to go check if my own portfolio is obeying its Gaussian channels. Spoiler: it is, awesome.
without_worries
A continued crash to $45k for Bitcoin? - December 2025
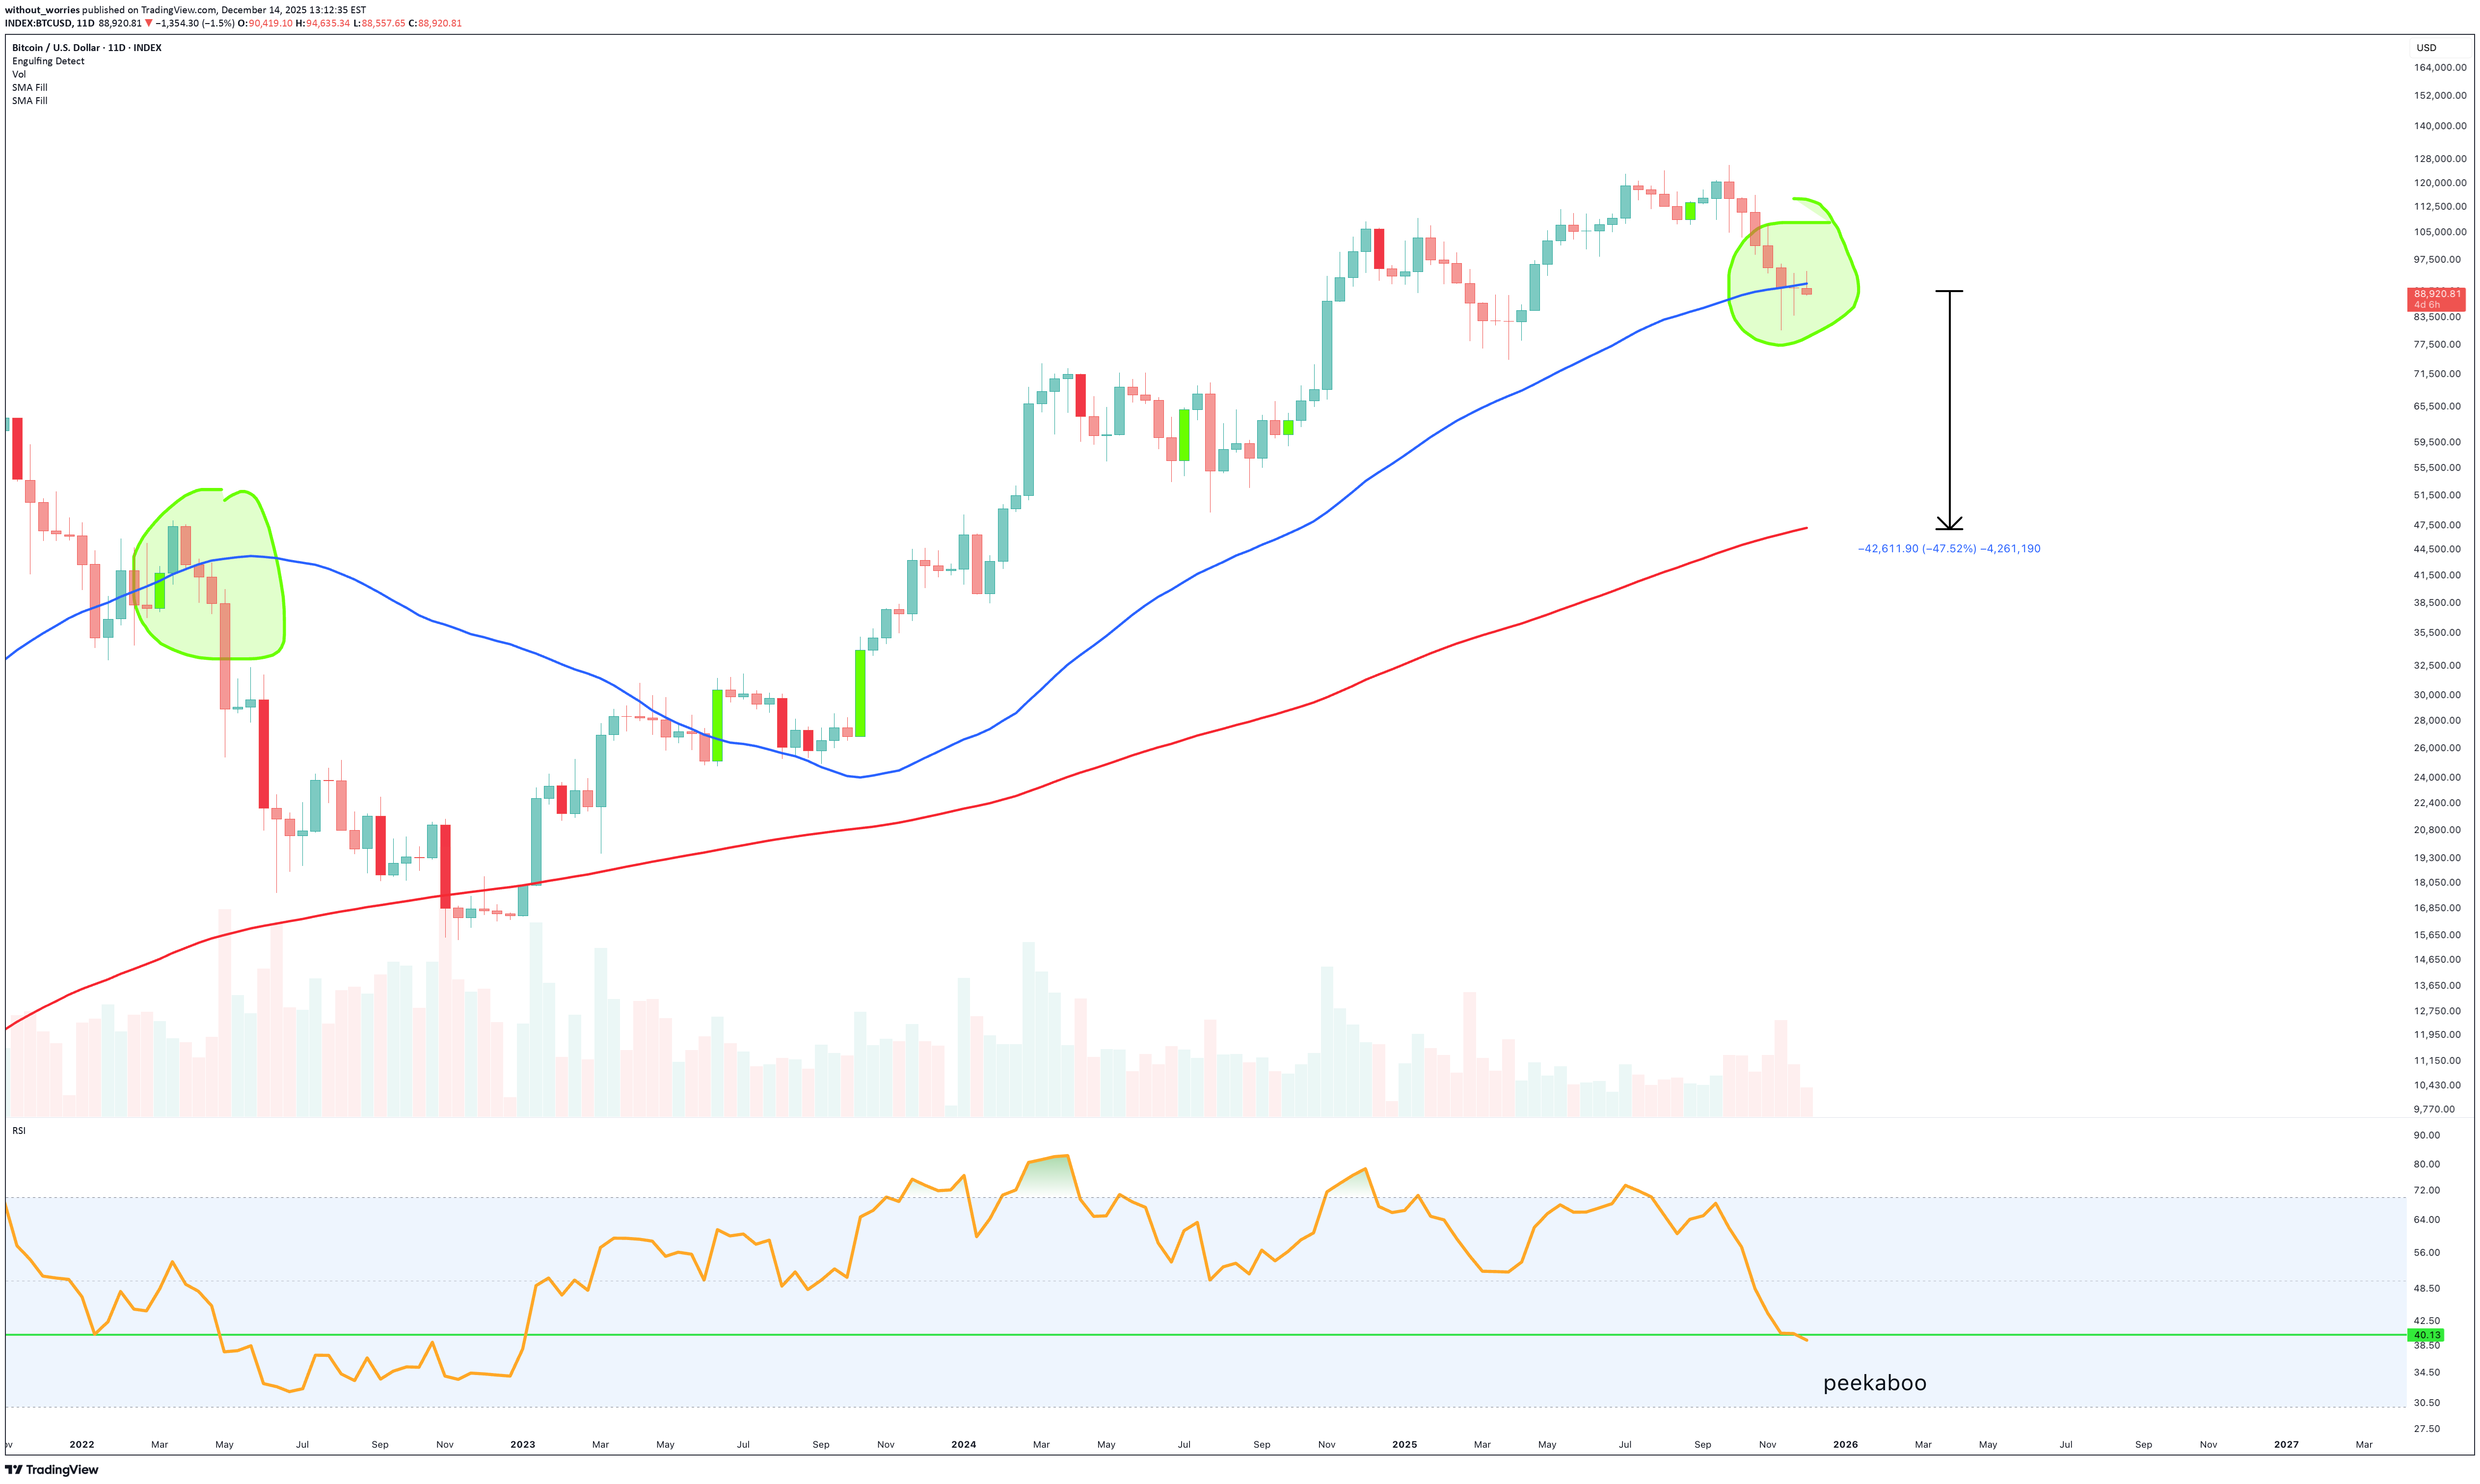
Bitcoin has 5 days to stop the current candle body print under the 11 day 50SMA. Throughout the entire history of Bitcoin, a candle body close under this level has meant a test of the 11 day 200SMA. It is that simple. Never a false signal. Here are all the historical data points: 50SMA on the 11 day chart throughout all Bitcoin history At the moment the candle prints as a Gravestone DOJI. Zoom in a little further to the 3 day chart and you can see price action follows the 200SMA. Does not matter what the asset is, anytime you see this, it is a sign of weakness. Look left. Regardless of asset, a complete collapse typically follows. Even if price action staggers like a drunken sailor finding his way back to port. The idea " Is a Bitcoin crash to $40–45k next? – October 2025 " published around $120k made the break of market structure very clear. This idea is a continuation of the same break of structure. The spite continues to pour in for this idea. The market does not care. Micheal Saylor's lenders will likely become very nervous should this continuation confirm. A forced liquidation of Strategy would be the best thing that could happen to the Bitcoin space in my opinion as the cash to pay out Dividends must come from somewhere, and that means selling Bitcoins. In an already depleted marketplace. Have noticed influencers gaslighting audiences with "Black rock" is buying your panic selling at this time posts. Conclusions Let’s not dress this up like a TED Talk. Bitcoin has five days to avoid doing the thing it has never once avoided in its entire history. That’s not drama, that’s statistics, the boring kind that ruins hopium. A confirmed candle body close under the 11-day 50 SMA has always resulted in a test of the 11-day 200 SMA. No exceptions. No “yeah but this time BlackRock…”. No spiritual awakening mid-candle. Just gravity doing what gravity does. At present, price is printing a gravestone DOJI. Which, despite the name is not a bullish candle, unless you’re a fan of irony or funerals. The break of market structure was identified months ago near $120k, when optimism was peaking and common sense was being shouted down by people with laser eyes and affiliate links. Since then, price action has done exactly what broken structure does: grind, fail, and roll over. A move toward $45k is not a prediction pulled from thin air, it’s a mechanical outcome if the current signal confirms. If that level is reached, it will be framed as a “black swan”, despite being broadcast loudly, publicly, and repeatedly in advance by yours truly. As for the Saylor situation, leverage works both ways. Lenders get nervous. A forced seller in a thin market is never bullish, no matter how many times “BlackRock” is whispered like a protective spell. If this cascade happens, it won’t kill Bitcoin. It will do something far worse to the influencers: it will expose them. And frankly, that might be the healthiest thing this market has seen in years. Ww Disclaimer ============================================================== This is not financial advice. It is not a call to panic, sell the bottom, or tweet angrily at strangers. Markets can invalidate any thesis at any time. If price action reclaims structure and closes decisively back above key moving averages, this outlook changes. Loyalty to a chart after it’s wrong isn’t conviction, it’s just stubbornness with a Wi-Fi connection. If you’re trading with leverage, emotion, or borrowed confidence from YouTube thumbnails, none of this will save you. If you’re trading probabilities, history, and structure, then this is simply the chart doing what it has always done, while people insist it won’t.Further study of this idea on the same 11 day chart except on the Gaussian channel. This fact has a 100% success rate. It states: a) For every time price action closed a 11 day candle body inside the Gaussian channel, price action tested the bottom of the channel. b) For every time price action closed a 11 day candle body inside the Gaussian channel, price action tested the Fibonacci 50% level. That means if price fails to recover $95k by this Friday, there is a 100% probability price action drops like a brick to $45k Buy some crypto, influencers tell me it'll make you rich.This chart has confirmed, until the opposite happens. That is, a candle body closes above the 11 day 50 SMA as throughout history. You'll not know this until the end of January. In the meantime, price action has confirmed a bearish trend. Remember this is a 11 day chart, price action takes time to develop. What to expect as this unfolds: 1) A rally back to market structure (look left last green circle), a rally back to structure is not untypical on confirmation regardless of asset. 2) The rally takes price action to $100k to $106k, or 20% 3) At this level no trade exists. This is market structure. 90% of folks will be bull, I'll be neutral. Always wait for further confirmation. 11 day
without_worries
S&P 500 to 10,000 inside the next 4 years - December 2025
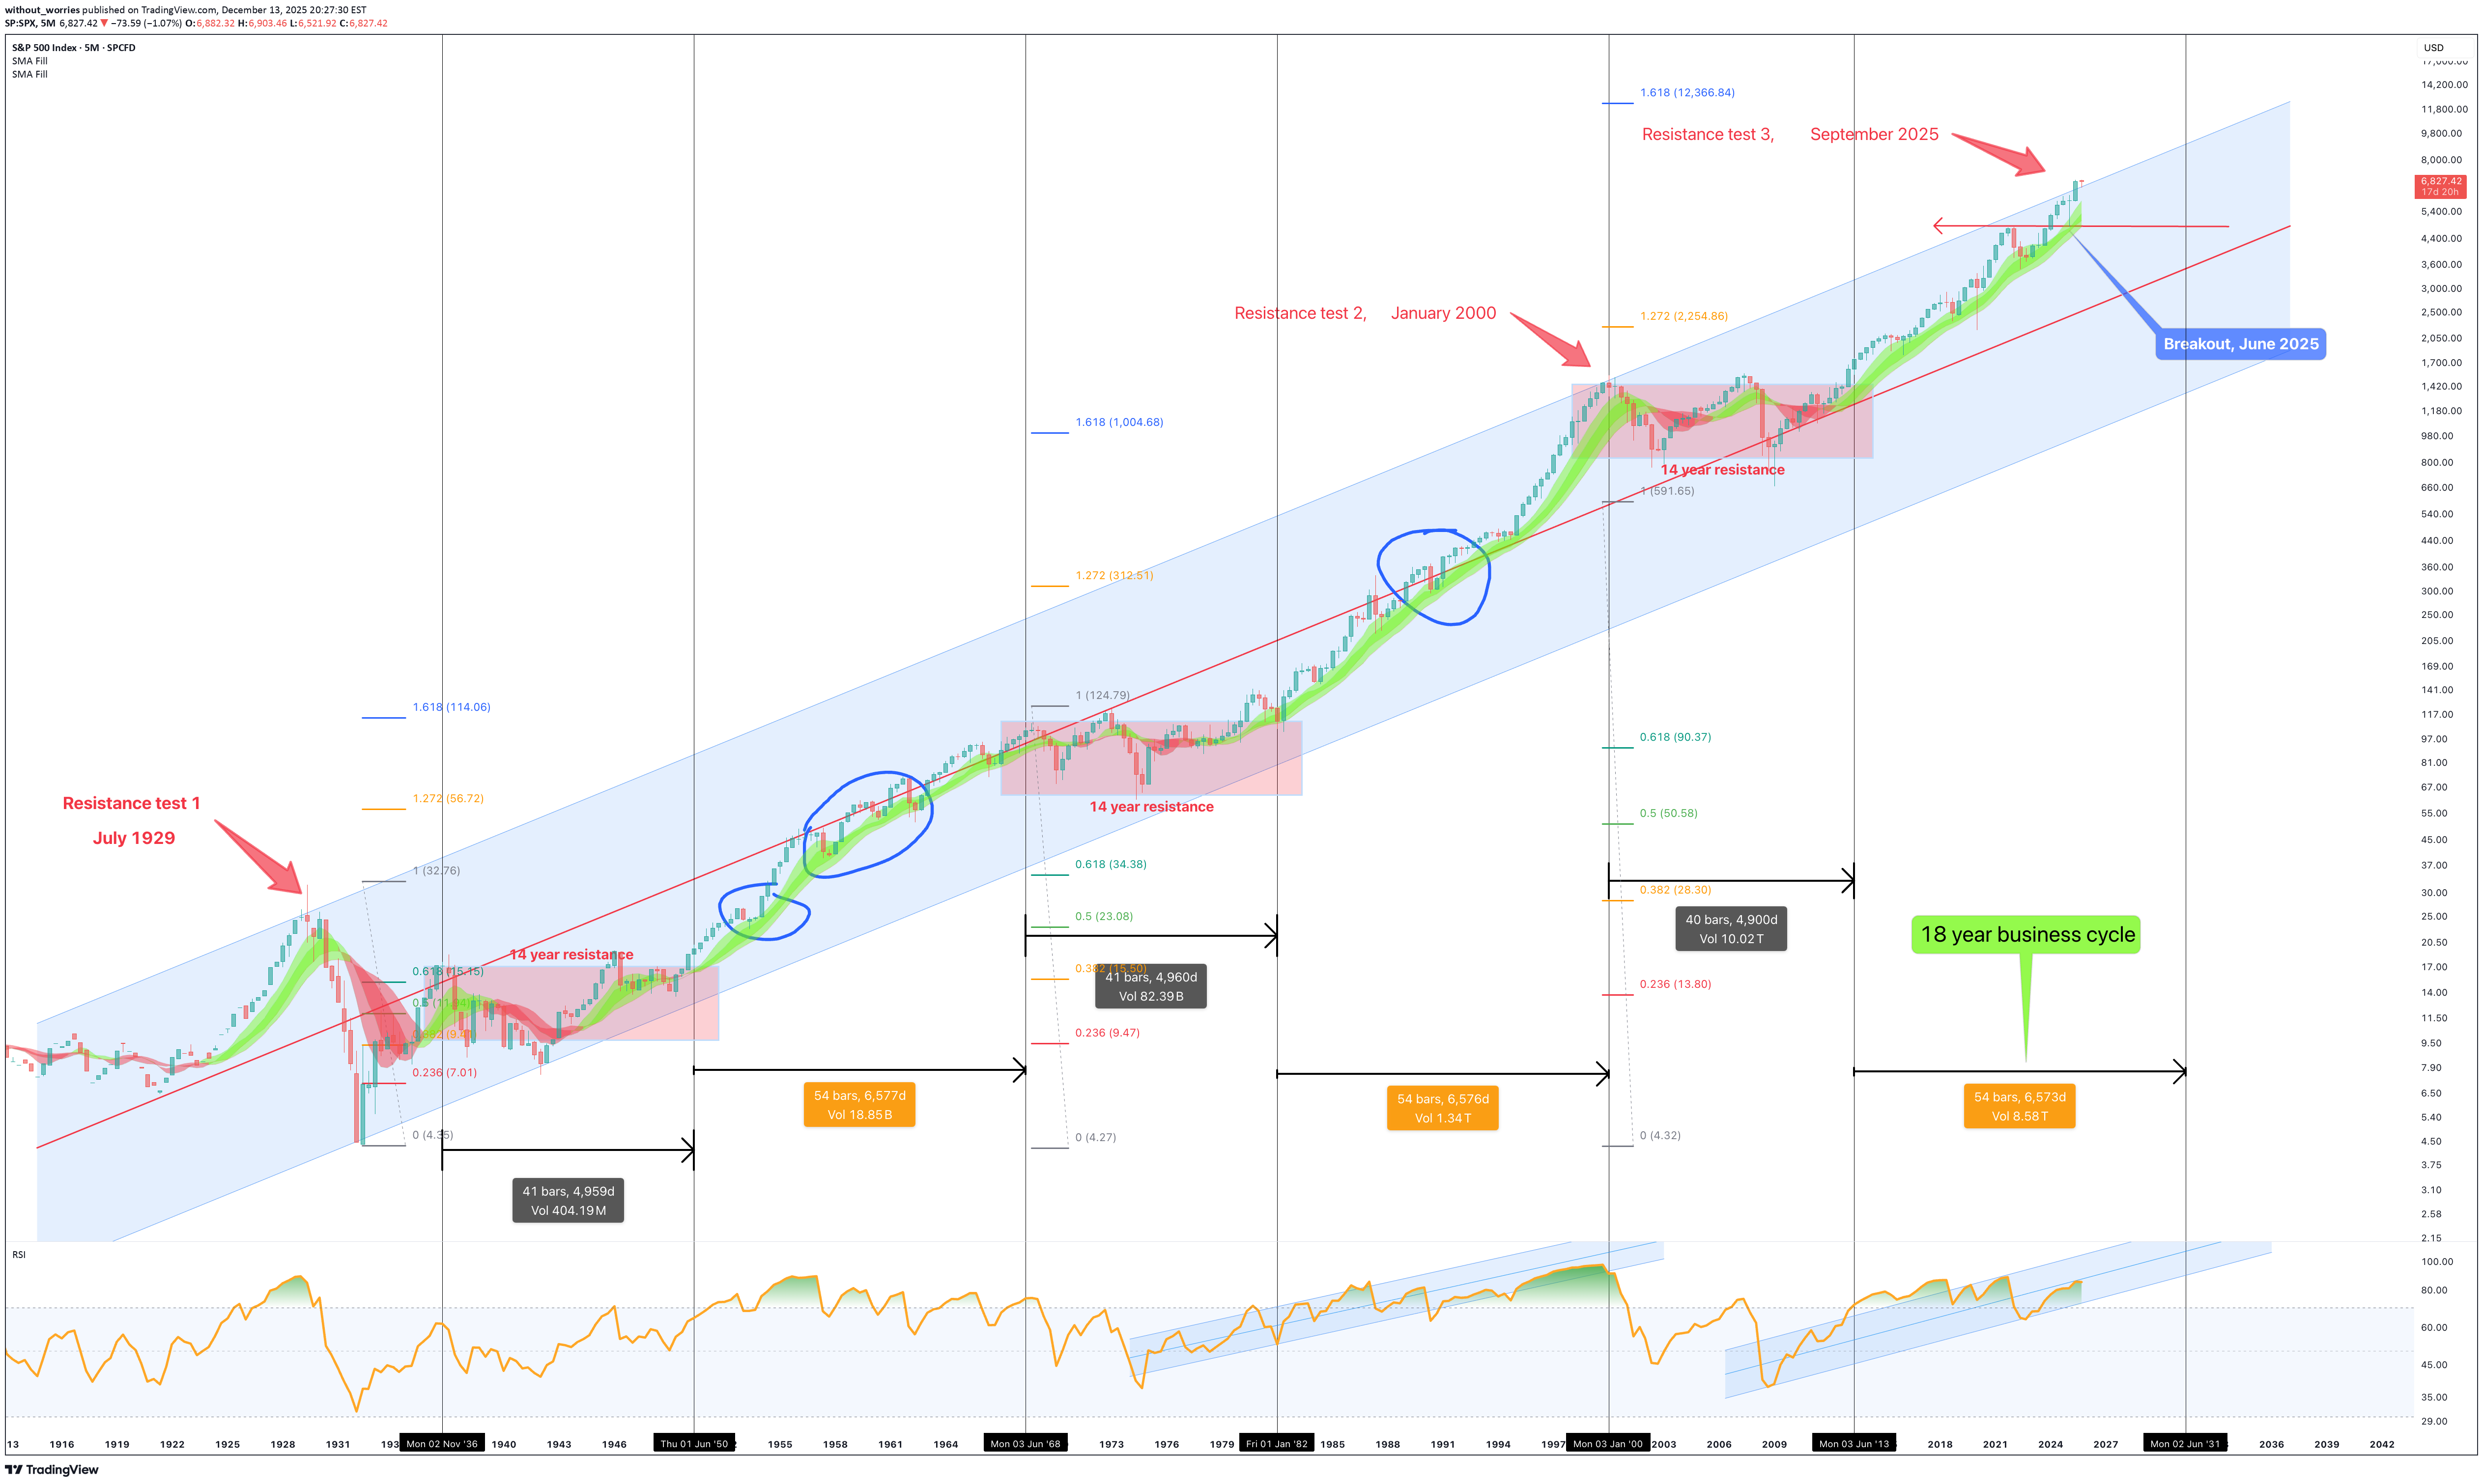
** This is an outlook for the next 3 to 4 years ** ** The bull market is not yet done, sorry bears ** Yes, read that right, 10,000 or 10k for the S&P 500. The markets shall continue to grind higher during this 10-year bear market everyone is talking about. Upwards and onwards for investors as unemployment numbers rise, graduates question the mysterious reason why their unable to land employment on the degree they just dropped $150k on; inflation runs out of control, working people struggle, the market is just not going to care. The best opportunities come at a time when you don’t have the money to invest, have you ever noticed that? The story so far A crash is coming, have you heard? Our ears are ringing out 24/7 with noise on the most predictable crash since computer user Dave reports an uninterrupted hour of use on Windows Vista. News of an AI bubble the size of Jupiter that is about to collapse in on itself and create a new star only seem to gather pace. The same finance prophets on Youtube with a hoodie in a rented flat forecasting which way the FED will move on rates. A 40 minute video to deliver a single sentence titled: “EMERGENCY VIDEO: Market collapse (MUST WATCH before tomorrow!!)”, 10 seconds in “And Today’s video is sponsored by…. ” and if it’s not a sponsorship, it’s a course they’re trying shill. Many story tellers weren’t yet out of school during the dom com crash, but they’re now they’re experts of it. Finally we have “a recession is coming” brigade. Of course it is. There’s always a recession coming. It’s like winter in Game of Thrones, they’ve been warning us for ages. Haven’t you heard? Recessions are now cancelled thanks to money printing and low interest rates. Capitalism RIP, all hale zombie companies. In summary there’s no shortage of doom and gloom. Everyone is saying it. So what am I missing? Let’s break this down as painless as possible so as not to challenge waining attention spans. You’ll need a cuppa before reading this, for the people of the commonwealth, you know of what I speak. A proper builders brew. Take your time to digest this content, there's no rush (did I mention it's a 5 month candle chart?). If you’re serious about separating yourself from the media noise to the News on the chart, then you're in for a treat. It is proper headline material. When you’re done, you'll pinch yourself, did he just tell me all this for free? What’s in it for him? (Absolutely nothing). Tradingview might bump $100 my way like Xerxes bearing gifts, but in the end the content of this idea may radically change the way your view the market today. The contents: 1. Is the stock market in a bubble? 2. What about this 10 year bear market people are talking about? 3. A yield curve inversion printed, isn't a monster recession is due? Is the stock market in a bubble? No. A handful of stocks are. The so-called “magnificent seven” stocks that make up about 40% of the market, Yeah, they’re in a bubble. No dispute from me there on that. It has never been riskier to be an index only fund investor. Especially if you're close to retirement. Now I’m not about to carve a new set of stone tablets explaining why, if you want the full sermon, that’s on my website. Here’s the short version: a tiny bunch of tech darlings are bending the whole market out of shape. If you’re only invested in index funds, then you’re basically strapped to the front of the roller coaster hoping the bolts hold should those seven stocks decide to puke 20% in a week. Suffice to say, a handful of stocks, tech stocks, are distorting the entire market. Index only investors are exposed to a greater risk than at any point in those past 20 years should the magnificent seven decide to sell off quickly. But what if they don’t? What if they just sell off slowly? Which is my thesis here. In the final 12 months leading up to the dot com crash, during the 1999-2000 period, the Nasdaq returned 160%. RSI was at 97 as shown on the 3 month chart below. Now that’s a bubble. In the past twelve months the Nasdaq has returned 20%. That’s not a bubble, that’s just a decent year. Above average, nice not insane. Yet people are acting like it’s 1999 all over again. A similar story for the S&P 500 as shown on the 3 month chart below. In the five years leading up to the crashes of 1929 and 2000 the market saw a return of 230% with RSI at 94 and 96, respectively. Today the market has returned 60% over the last 5 years with RSI @ 74. Adjusted for recent US inflation, and it’s roughly 30% real return! The two periods often recited the most by doomsayers, 1929 and 2000, exhibit conditions not found in today’s market. Fact. What about this 10 year bear market people are talking about? Warren Buffet, perhaps the most famous investor in the world, has amassed a cash pile the size of the size of Fort Knox. Legendary short seller Michael Burry is quoted as having Puts on the overbought tech stocks, that’s fair. The masses have translated all this as a short position on the stock market. It seems everyone is preparing for Armageddon. My question, why are the masses so convinced of a stock market crash? “Whenever you find yourself on the side of the majority, it is time to pause and reflect.” Mark Twain Let’s talk about the main 5 month chart above… There’s so many amazing things going on in this one chart, could spend hours talking about it. Will save that for Patrons, but the key points exist around support and resistance. You’ll remember the “ Bitcoin in multi year collapse back to $1k - December 2025 ” publication? It is of no surprise to me the Bitcoin chart now indicates a macro inverse relationship to the S&P 490 (minus tech stocks). Bitcoin is a tech stock all but in name, it follows the tech stock assets like a lost puppy. If you strip away the blotted tech sector you realise we’re in for a bumper rally in the stock market in the coming years. This happens as a result of money flooding out of the blotted tech sector (that includes crypto). These sectors are about to crash straight through the floor towards middle earth. When the masses catch on that businesses are not finding value in AI tools beyond generating cat videos on Youtube, the bottom falls out of those bankrupt entities, with hundreds of billions of dollars looking for a new home. That’s when investors pivot to value . Sometimes I feel like I’m the only one with this information when I scan through the feeds, how is this not the most obvious trade of the decade? For the first time in 96 years the S&P 500 breaks out of resistance. Why is no one else talking about this? 2025 was the year it happened and yet not a whisper. The 1st resistance test occurred in July 1929. The 2nd in January 2000. The breakout occurred in the first half of 2025 and will be confirmed by January 1st, 2026 providing the index closes the year above 6530-6550 area. 12 trading days from now. The 18 year business cycle, roughly 6574 days (the orange boxes) is shown together with the black boxes representing the 10 year bear markets in-between (14 years until past resistance is broken - pink boxes). Should you not know, The 18 year business cycle, In modern market economies (especially the US and UK), they are repeated cycles where: Land & property prices rise for about 14 years Then there’s about 4 years of crisis, crash, and recovery Together that’s roughly an 18-year land / real-estate business cycle, a pattern that is argued to show up again and again. When we remove the darlings of the stock market you find the valuation for the S&P 490 suggests that the vast majority of the US market is currently priced near a level of Fair Value relative to GDP, provided that the current economic structure persists. The high majority of influencers and financial experts talk about the end of the business cycle, there’s even “how to prepare for the crash” videos. If we look left, it is clear, the 18 year business cycle is far from over. So why are you bearish? A yield curve inversion printed, isn't a monster recession is due? There is a general assumption that recessions mean bad things for the stock market. You’re thinking it right now aren’t you? “ Of course they are Ww - everything will crash in a recession! ” Listen…. you couldn’t be more wrong. Ready for some dazzle? This level of dazzle wins your Harvard scholarships when meritocracy isn’t an option for you. And it’s free, without the monstrous loan debt at the end. Can you believe that? What if I told you the stock market does not care about recessions? Let’s overlay every US recession on the same 5 month chart. The vertical grey areas. There has been 14 US recessions over the last 96 years. The majority, that is 9 of them, occurred during a bear market. The recessions that saw the largest drop in the stock market, 1929 and 2000, were known overbought bubble periods. We know that is not representative of the current market as discussed in the first section. Here is the dazzle. Focus on the recession during the business cycles. What do you notice? The recessions during business cycles (blue circles) never saw a stock market correction greater than 10%. In other word, utterly irrelevant. Conclusions Let’s land this gently, before someone hyperventilates into their keyboard. The S&P 500 is not in a bubble. A handful of stocks are and that distinction matters far more than most people are prepared to admit. Yes, the Magnificent Seven are stretched. Yes, AI enthusiasm has reached “my toaster is sentient” levels. But the rest of the market? Strip away the tech confetti and you’re left with something far less dramatic and far more dangerous to bears: a structurally healthy market breaking a 96-year resistance. Not testing it. Not flirting with it. Breaking it. And doing so while the internet is convinced the sky is falling. This is where people get confused. They expect crashes to announce themselves loudly, with sirens and YouTube thumbnails. They don’t. Crashes arrive when optimism is universal, not when fear is a full-time job. Right now, fear is working overtime. If history rhymes, and markets are essentially drunk poets with a spreadsheet, then the evidence points to continued upside over the next 3–4 years, not a sudden plunge into a 10-year ice age. Now that does not mean straight up. Expect: Volatility Rotation Pullbacks that feel terrifying in real time and irrelevant in hindsight What it does not suggest is the end of capitalism every time the RSI sneezes. The 18-year business cycle is not complete. The long-term channel remains intact. RSI conditions are elevated but nowhere near the manic extremes seen in 1929 or 2000. Those periods were bubbles. This is not. Here’s the uncomfortable bit for many: The biggest risk right now isn’t being long. it’s being so convinced a crash is imminent that you miss the next leg entirely. Especially if you’re hiding in cash waiting for a disaster that keeps failing to show up. And before anyone shouts “What about tech collapsing?!”, yes — that’s precisely the point. If capital rotates out of bloated tech and into value, industrials, energy, financials, and boring businesses that actually make money, the index doesn’t die. It grinds higher while everyone argues about why their favourite stock stopped working. S&P 500 to 10,000 isn’t a fantasy screamed into the void. It’s the logical outcome of structure, cycles, and history, assuming capitalism doesn’t suddenly apologise and shut down. And if it does? Well, none of us will be worrying about our portfolios anyway. Ww Disclaimer =================================== This is not financial advice. It is not a signal, a promise, or a guarantee that markets will behave politely while you feel clever. Markets can remain irrational longer than you can remain solvent, especially if you’re trading leverage, emotion, or YouTube confidence. This outlook is based on historical price behaviour, long-term cycles, and observable market structure. If those conditions change, the thesis changes. Blind loyalty to an idea after the data disagrees isn’t conviction, it’s just stubbornness in a nicer font. If you’re looking for certainty, reassurance, or someone to blame later, this will disappoint you. If you’re looking for probabilities, context, and a framework that doesn’t rely on shouting “CRASH” every six months, you're welcome. Ww
without_worries
Bitcoin in multi year collapse back to $1k - December 2025
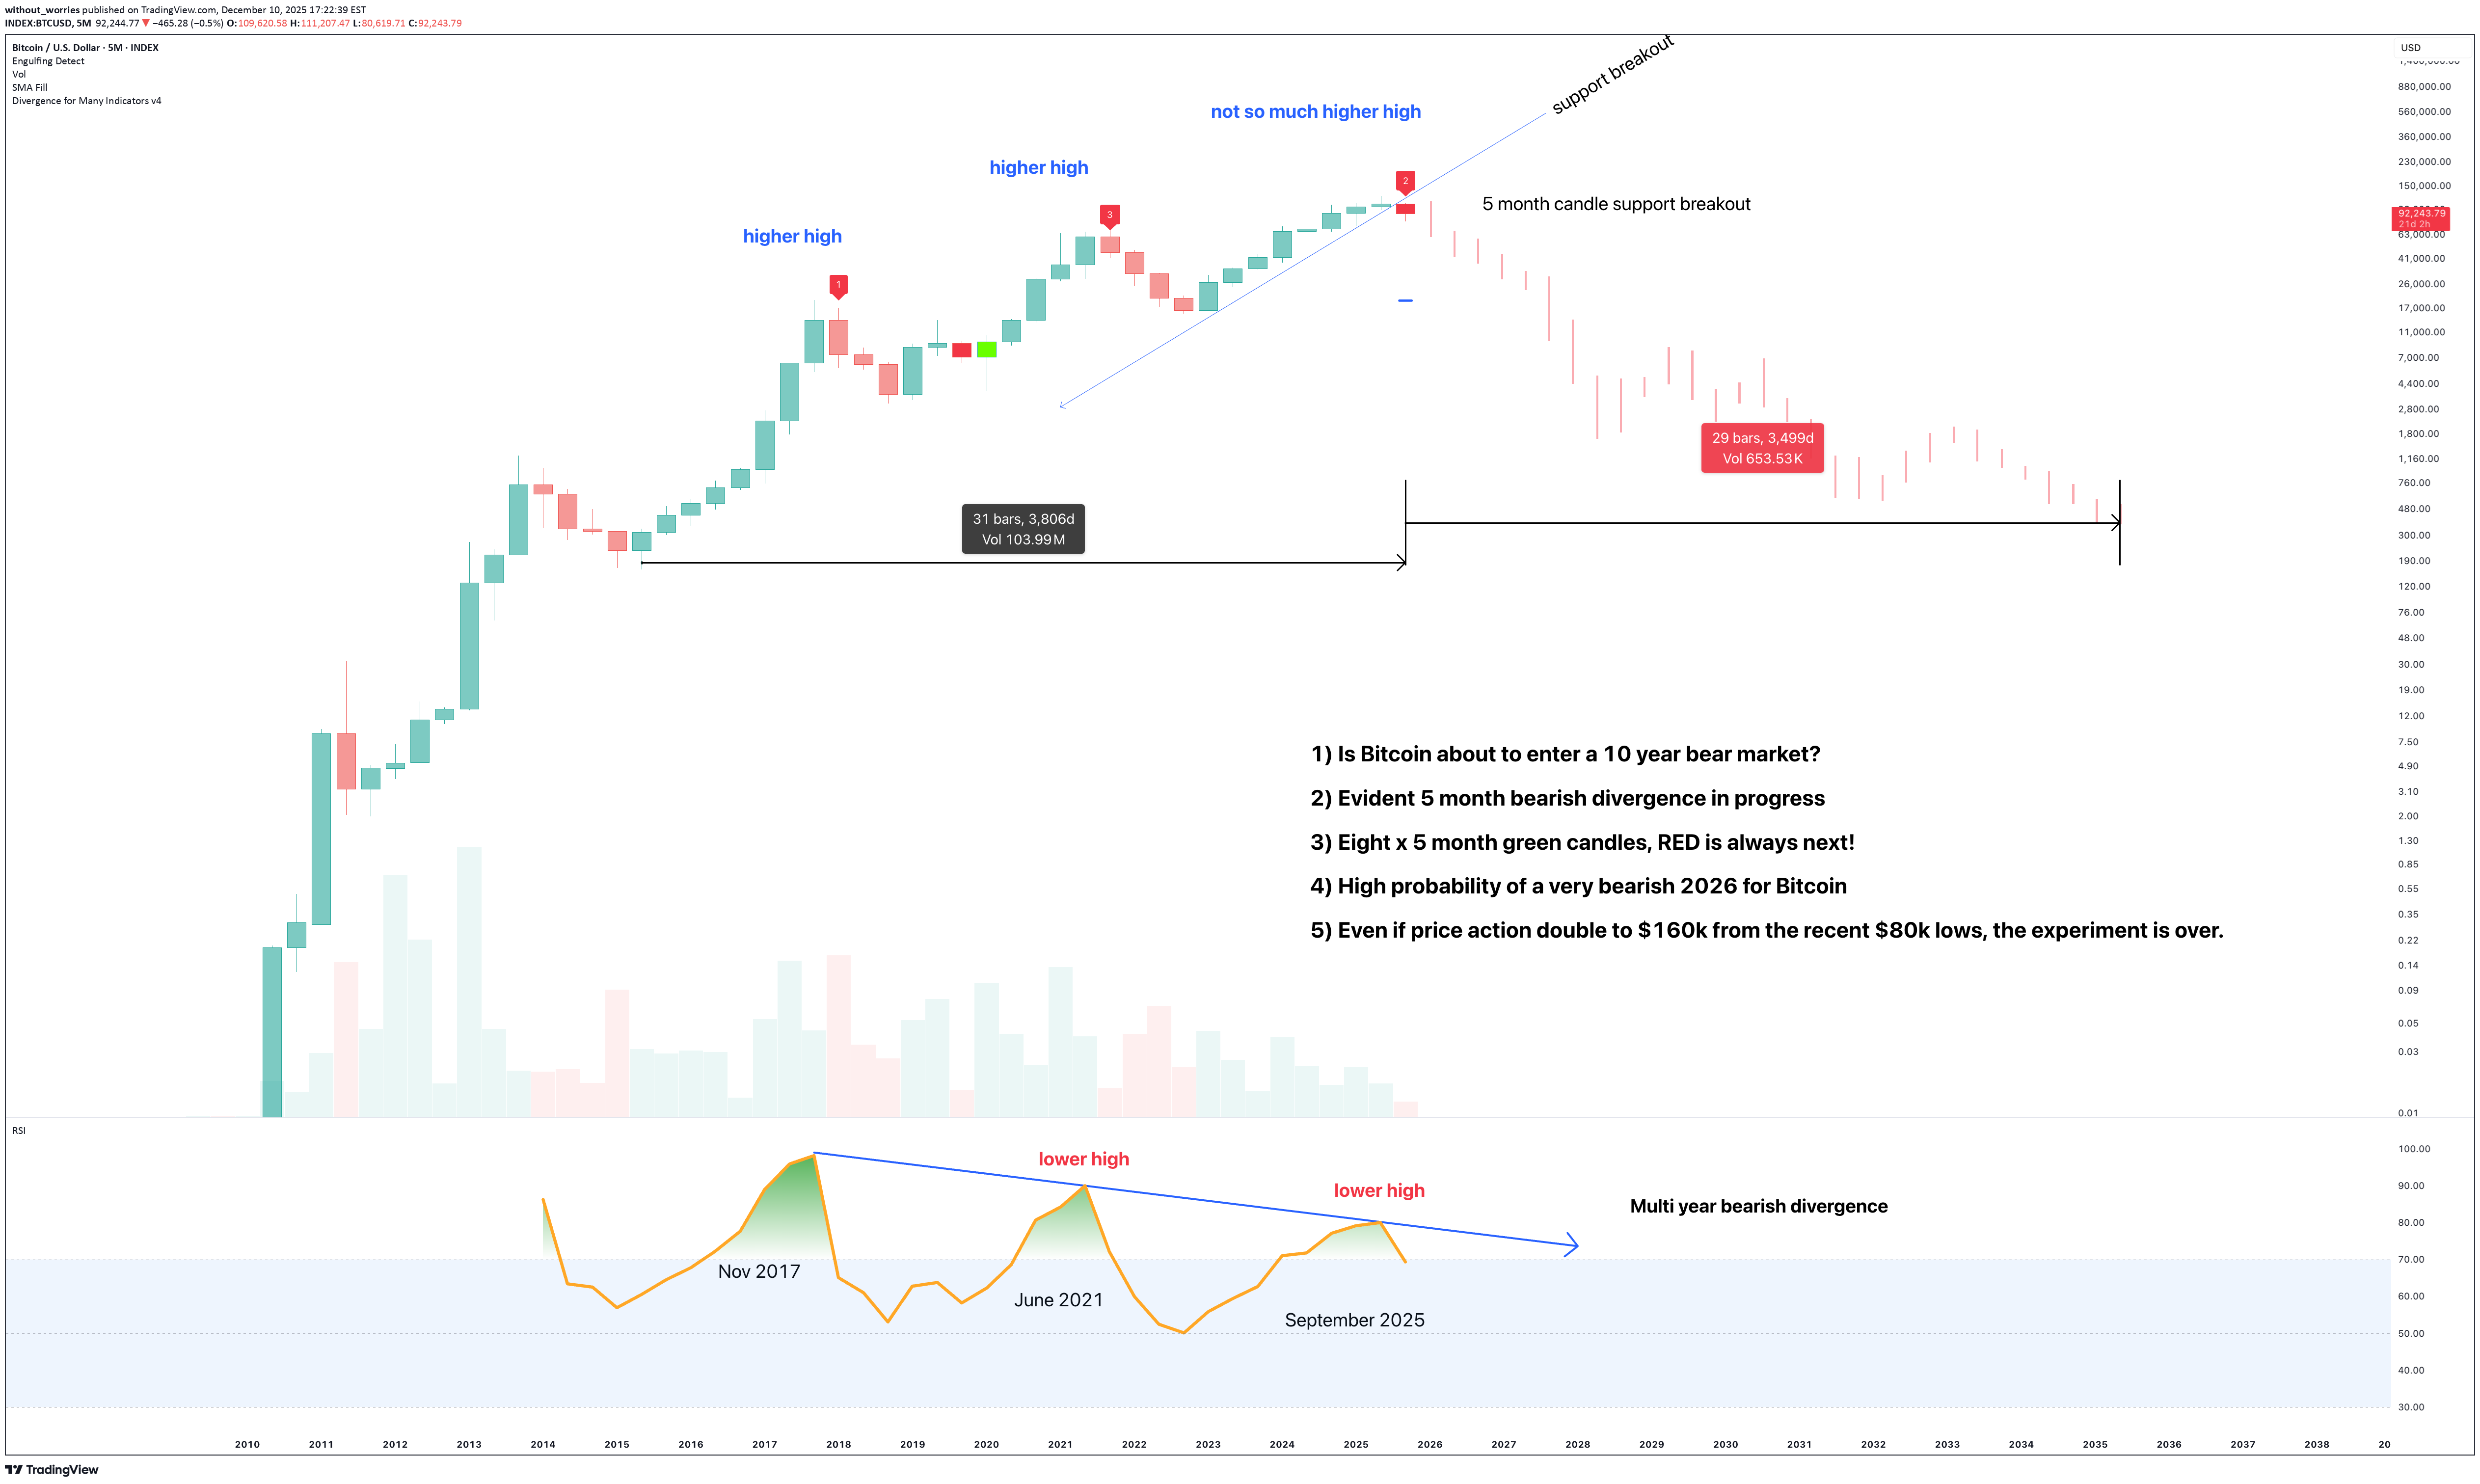
Perhaps you've noticed as have I, Media studies and Art collage students now turned financial experts flock to Youtube to inform peers of investment opportunities with the great Boomer wealth rotation that is set to land on their laps. Who would not be in disbelief at the possibility of wealth generated over generations is now at risk of being smoked on speculation in mere months. It is a real risk, and few seem to want to talk about it. Over the next 10 years wealth is expected to rotate from one generation to the next. During that time this one chart about screams "stay away". Few care to listen. Instead it's all recession talk, crash, mountains of debt, sky-high prices, and chaotic politics. Everything seems out of whack, distortion and noise as the AI tech bubble grinds on. Remember the post " Is Alt season dead? - June 2025 " when everyone was convinced of moon?, or " 3 week idea as price action broke down from $120k ". Read the comments, do you see yourself here? Shouting at the wind of sellers as your feet were lifted from the ground? Opportunities to generate significant returns in the years ahead do exist, just not not in crypto. If you stick around over the next 2-3 years, I'll show you them. But you're on your own, will not be guiding folks on every turn or daily pullback. That's for Ww homepage. Instead, this is a post to highlight the Rotation from Growth to value has already begun. Opportunities on real value, on real businesses that generate profit. That's the ticket. Not another "bearish Bitcoin post" As 2025 draws to to a close, the end of another 4 year cycle plays out perfectly. Few want to believe until that 70% correction is complete. They'll return with videos such as "It was manipulated!" or some nonsense. The truth is, a 700% return was made from the lows. That's decent. However, this cycle top was far more nefarious than price action lets on, it was the first time Bitcoin closes last year of a bull market at a lower price than the year began! Let that sink in for a moment. Still not sinking? 1) In the last year of a Bitcoin bull market, usually the most bullish year of the 4 year cycle, price action would nearly double. 2) Seriously. Look left. 2013, 1017, 2021, er 2025 hello. Did you try switching it off and on again? The end of the Bitcoin experiment Okay, the last year of a Bitcoin bull market, price action closed lower. That's not FUD, that's fact. It is the first time in the history of Bitcoin price action that has seen a lower close during the last year of the bull market. Think about that for a moment. That's not adoption, that's gravity gripping maxis by the ankles. The Bitcoin white paper implied a future that creates a globally accessible financial infrastructure. One that aims to give everyone equal opportunity to access a neutral monetary network, regardless of nationality, credit history, or status. Instead why we got was laser eyes and individuals who amassed chunks of the circulating supply. That's arguably more centralised than the US dollar! Since most dollars today exist outside of the US, not in it. (Wait until those dollars come flooding back home, that'll be an entertainment not even a Netflix Warner Bros combo could create). A significant bearish divergence prints On the above 5 month chart we have a higher high matched with a lower high in RSI. Same settings used on the divergence tool. There are now 21 days remaining of the year for that 5 month candle to print. If history is our teacher, two more red candle prints will follow. That's basically all of 2026 to be red. Not just a little bit red, but a scene so bloody even Quentin Tarantino uses the black and white filter. Conclusions, (or how to lose a fortune and blame the illuminati) Right. So to wrap this up for anyone still listening. We’ve established that the world’s gone mad. We’ve got people who until recently thought a “bear market” was a poorly attended gay pride event in the woods now lecturing you on monetary policy from their mum’s box room. The great Boomer wealth handover is coming, and it’s shaping up to be the biggest game of Hot Potato with Grandparents lifesavings. And your entry ticket is a magic internet bean that just had its worst party year *ever*. The facts, for those who enjoy them: 1. Bitcoin just wet itself. In the final, supposedly explosive year of its bull run, it closed *lower*. That’s like the finale of a fireworks display being a single, sad squeaker from a party popper. History screamed “double!”, 2025 whispered “...meh.” 2. The dream is a meme. The promise was a noble, decentralised utopia. The reality is laser eyed influencers and a supply more concentrated than a Kardashian’s self tanner. It’s not a revolution; it’s a pyramid scheme with better graphics. 3. The chart is screaming get out. A macro bearish divergence is printing. In layman's terms, the engine is smoking, the wheels are coming off, and the satnav is politely suggesting, for the 21st time, “At the next available opportunity, please turn the $§%$ around.” So, what’s the takeaway? This isn’t FUD. It’s an intervention. While the world is distracted by AI chatbots writing sonnets and political circuses, real value is quietly shifting. It’s not in speculative digital tokens; it’s in actual, boring, profit-making businesses. I know, double yawn, but the rotation has begun. You can still make 5-10x on stock positions if you chose wisely, manage risk, and are above all… are patient. That means no more 4hr charts and screaming day traders on Tik Tok. Ww Disclaimer ========================== This isn’t financial advice. I’m a bloke with a chart, not a wizard. I’m patiently waiting for Tradingview Mods to elevate me to that status. Nudge nudge. I could be utterly, spectacularly wrong. Bitcoin could moon tomorrow, propelled by a tweet from a billionaire who owns too much of it. You might buy a business that makes widgets and it goes bust because widgets become passé. That’s your gamble. My only point is this: when the history books are written about this period, the chapter won’t be called ‘The Genius of the Crypto Bros.’ It’ll be called ‘The Great Distraction,’ and it’ll sit right between “Tulip Mania” and “That time we all bought NFTs of Monkeys.” The real opportunity isn’t where the hype is. It’s where the silence is. And right now, that's not crypto. Now, if you’ll excuse me, I’m off to invest in something sensible. Probably tinned goods and shotgun shells. You know, real value.
without_worries
هشدار جدی: آیا بیت کوین تا نوامبر ۲۰۲۵ به سقوط ۵۶ هزار دلاری نزدیک است؟
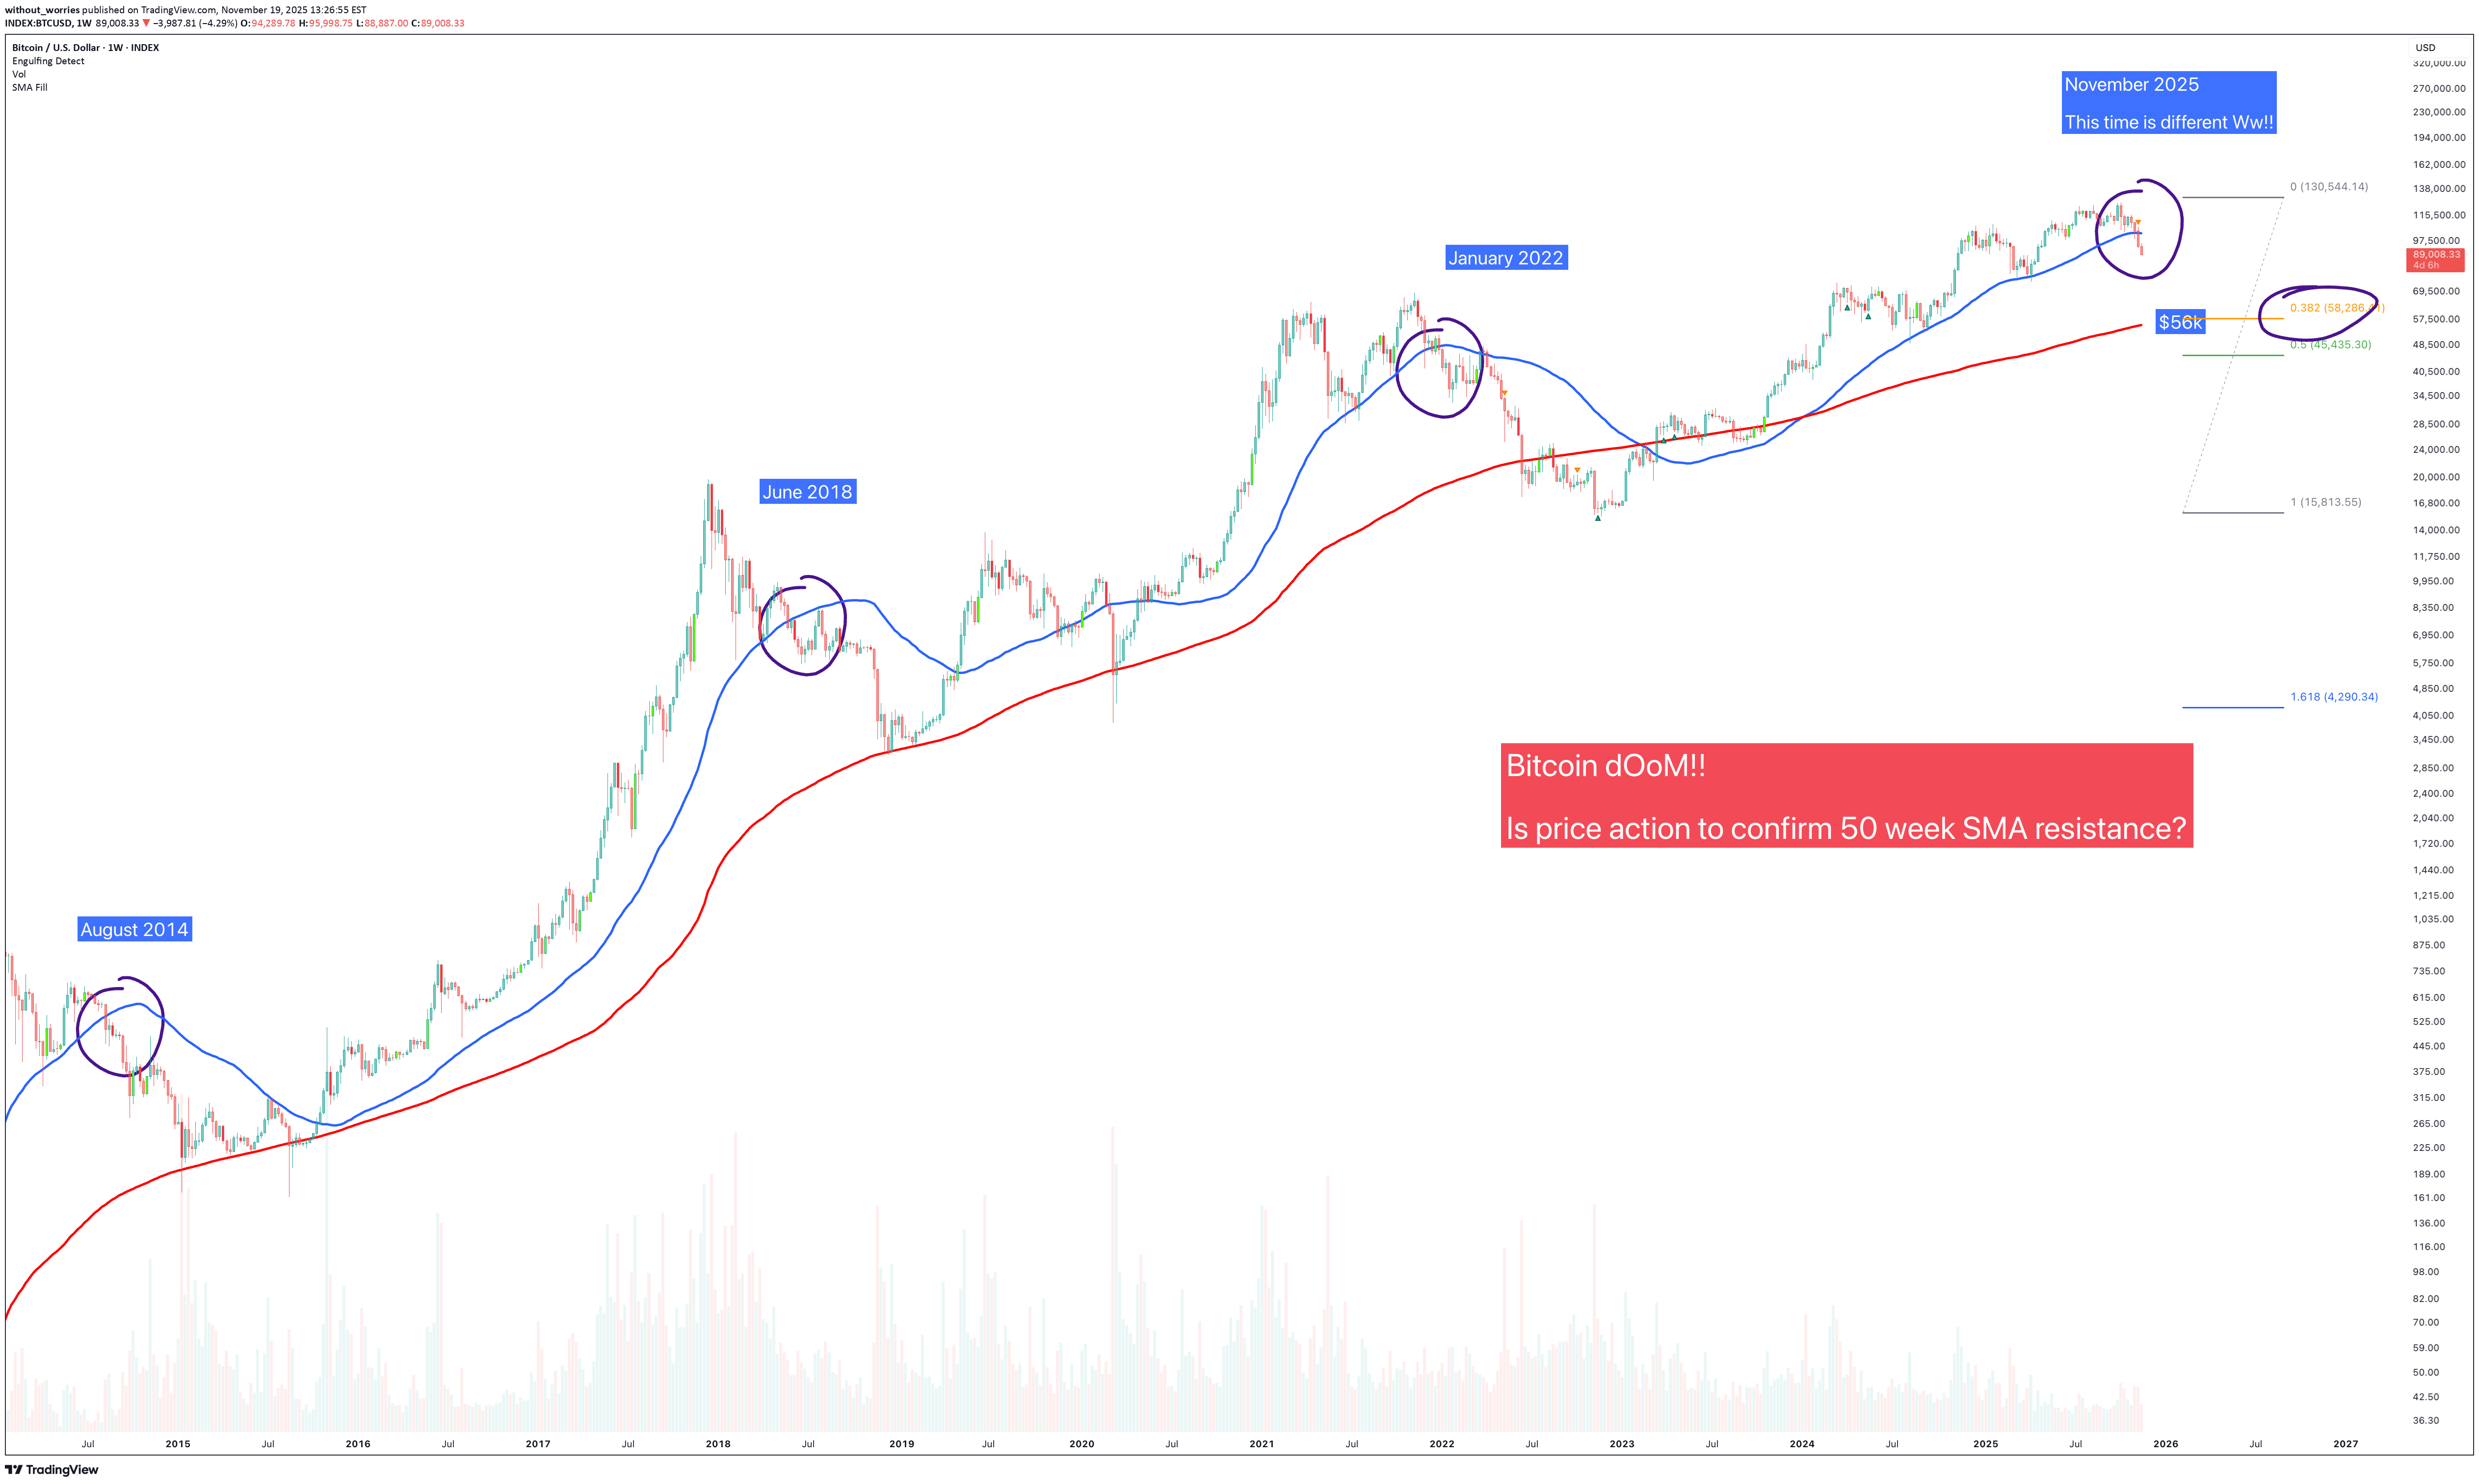
The above chart been brought to my attention by a number of folks asking for an opinion. So here it is.. remember, am just a messenger not target practice. Price action shown on the above weekly chart has closed under the 50 week SMA, or so I’m told. “Is that it? The top now in Ww?” Look left, if you’re using two moving averages: 50 week SMA (blue) 200 week SMA Then for you, the top is in. It’s over, go home. Congratulate yourself once again for providing exit liquidity for those that entered long positions at $15k. They have your everlasting thanks. What's the hullabaloo? Throughout the history of Bitcoin a test of the 200 weekly SMA occurred every time price action closed under the 50 week SMA. That’s not up for debate, it is a chart fact. Today that would be a highly predictable test of $56k, which is also the Fibonacci 0.38. This forecast is going to upset a lot of people. The influencers promised them tales for fortune and glory. Instead.. they got a lesson in basic economics, but they had to pay $50,000 for it. You don't get refunds for stupidity, do ya? Is this time different? It is not possible to tell right now. Many might look at the chart and quit, they’ve had enough. That would be a mistake. Why? Confirmation. Look left. Always look left. Until Monday 24th, November it is not known if the break of the 50 week is confirmed. Indeed if you take a closer look, price action has not actually closed a weekly candle body under the 50 week SMA, it has closed through it. That’s important. Today January 2022 Confirmation June 2018 Confirmation August 2014 Confirmation Conclusions So here we are again, Bitcoin teetering on the edge, influencers chanting “bull market!” like it’s a religion, and yet… there’s that nasty little blue line. Price action under the 50-week SMA has never ended well. Not once. Every single time, without exception, it’s been followed by a cozy trip down to the 200-week SMA. Historically, that’s what Bitcoin does, it falls until it hits something red and expensive looking, then everyone acts surprised. And where’s that level today? About $56k. Right on the Fibonacci 0.38. It’s like gravity with maths. But before you light the torches and start the “Ww’s turned bearish” posts, calm down. The candle hasn’t confirmed yet. That’s right, you’ve got until Monday, November 24th to find out if this is the real deal or just another fake-out designed to make you question every life decision since buying at $110k. Look left. Every time price closed through the 50-week, the same story played out: August 2014: crash. June 2018: crash. January 2022: crash. It’s basically Bitcoin’s version of Groundhog Day, but without Bill Murray or the happy ending. If it confirms below that line, that’s it. The 200-week SMA becomes the magnet. If not, we’ll bounce, the influencers will return, and everyone will convince themselves they knew all along. Either way, I’m not saying “doom.” I’m just saying, maths, it works. Ww Disclaimer =============================================================== This isn’t financial advice. Obviously. If you’re taking investment cues from a bloke with a sense of humour about market collapses, you might want to re-evaluate your decision making process. If you sell here and it pumps that’s on you. If you hold and it dumps, that's also on you. If you blame “market manipulation,” congratulations, you’ve just described every loser in crypto since 2017. I don’t have a crystal ball, just charts and they don’t lie, even if people do. So whether Bitcoin crashes to $56k, or rallies to $160k, or starts taking payments in “Hopium,” I’ll still be here, tea in hand, smirking, watching the comments fill up with “You were wrong!” from people who were never right. Without Worries (Ww) “Look left, not up.”The S&P 500 currently at 6630, the same price it was in mid-September. Not a crash. At that time Bitcoin was at $118k -$40k, yes.. that's a crash. Stock market = 1 Crypto speculation = 0Down $40k from $126k, only $30k to go as Micheal Saylor reveals "Microstrategy admits a bitcoin sale is possible" finance.yahoo.com/news/microstrategy-admits-bitcoin-sale-possible-180141373.html The house of cards slowly begins to collapse.
without_worries
هشدار بزرگ: بازگشت کانال قرمز نابودی به سهام مایکرواستراتژی (MSTR) در نوامبر ۲۰۲۵!
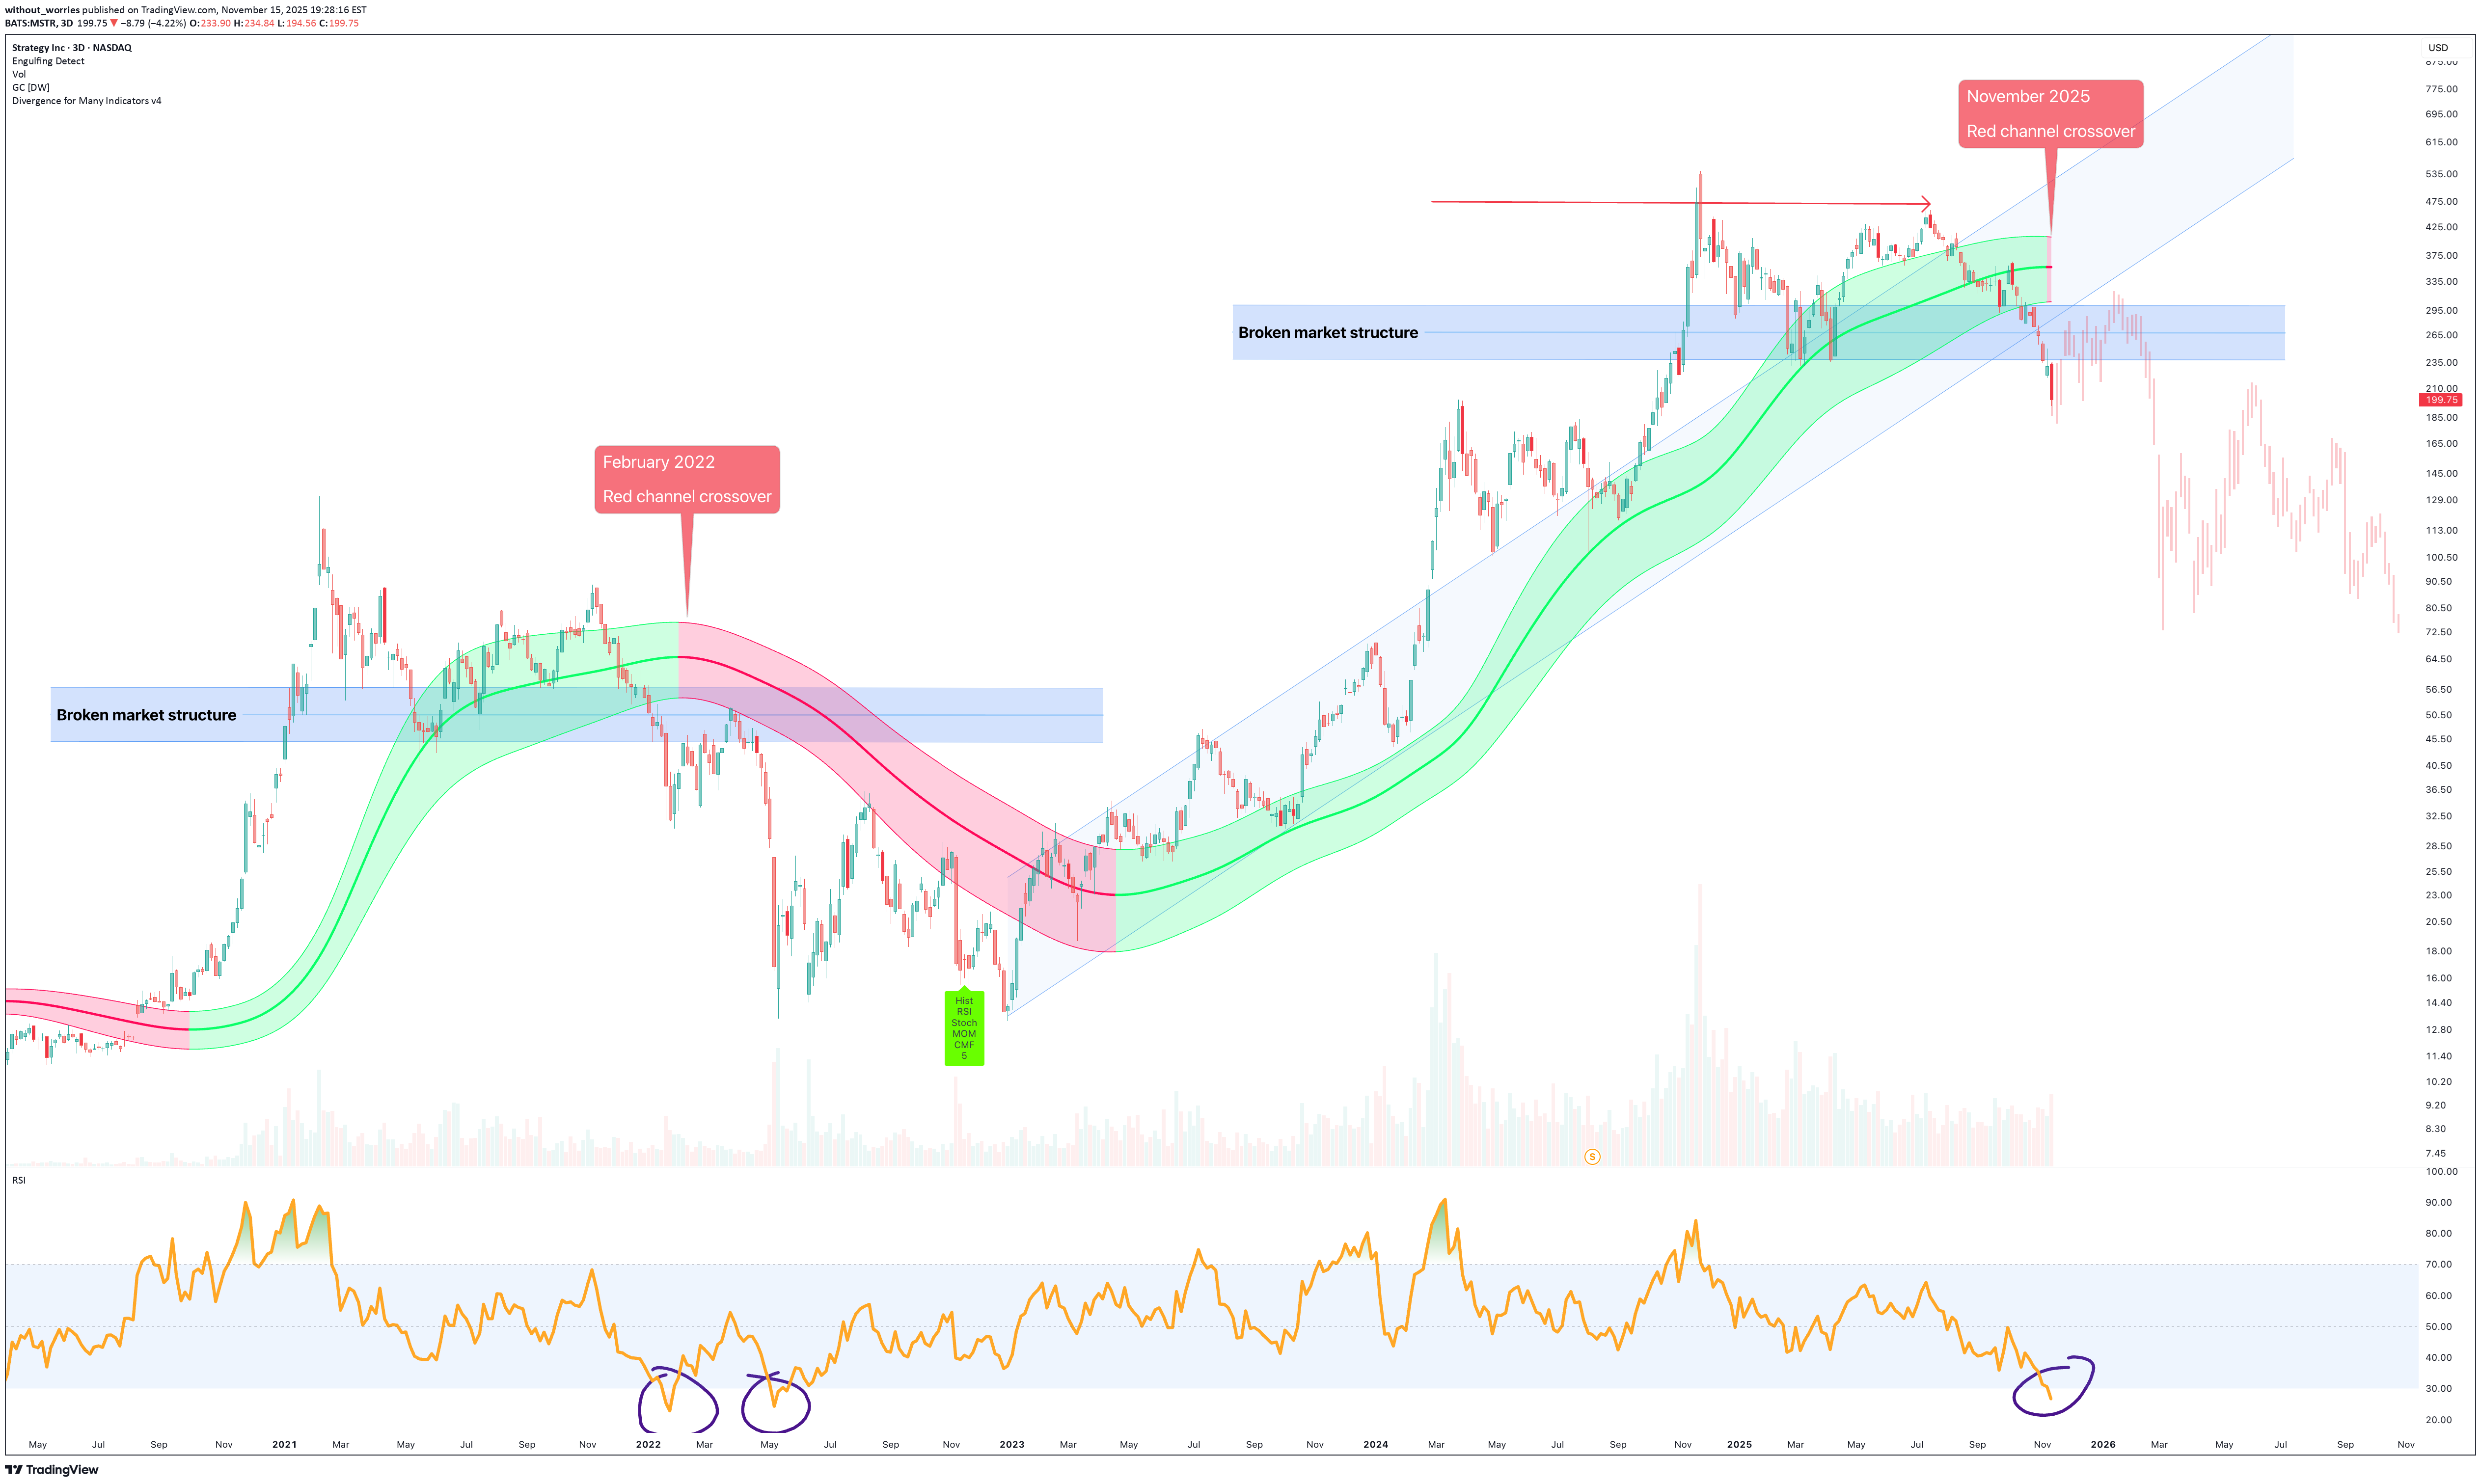
Ah, MicroStrategy…. the stock that’s half software company, half Bitcoin cult. Every time you think it’s about to behave like a normal tech firm, Michael Saylor pops up with a grin, another billion dollars of debt, and the conviction of a man who’s never heard the words “margin call.” And here we are, November 2025, staring at the Red Channel Crossover. Sounds ominous doesn’t it? Like something NASA would warn about before the Sun goes super nova. Déjà Vu: February 2022 Says Hello Look left. The last time price action crossed into the red channel was February 2022. Market structure broke. Price dumped. Holders prayed. And then just when everyone thought it was over, sneaky sellers rotated the gravity dial to 2G. Now we’re back at it. November 2025, same crossover, same setup, same “this time is different” nonsense. Every influencer on X is already typing “Buy the dip 🚀”, as if adding a rocket emoji somehow fixes negative momentum. The technicals The green channel represents calm waters, an uptrend, happy times, and Saylor buying jets with the profits. The red channel is the opposite. It’s like when the hangover kicks in and you realise that was not sugar free Red Bull. Each time MSTR entered this red zone, it meant one thing: Broken market structure, 50–70% correction, Mass denial phase. Right now, the chart’s showing that same red crossover again, after breaking below structural support around the $240 area. If you’re still shouting “to the moon” at this point… well that rocket exploded months ago. RSI & sentiment RSI is rolling over faster than a drunk at a wedding. Momentum’s drained and what’s left are bag holders explaining to their spouses that “it’s a long-term store of value.” It’s not. It’s a tech stock with a crypto addiction. So what happens next? If history’s anything to go by, and it usually is, price action is heading for the same fate it suffered post February 2022: First, a short-lived bounce to sucker in the hopeful. Then, the slow, grinding descent into despair. A retrace toward the $80–$100 region would fit perfectly with prior cycle behaviour. And if Bitcoin confirms its own Gaussian bear trend, well… let’s just say Michael Saylor’s going to need more than “diamond hands”, he’ll need a therapist. Before that can happen expect price action to test the $300 area to confirm broken market structure. Today price action is considerably oversold, this idea only becomes validated after a resistance confirmation on past support . Wrote that in bold for those of you who struggle to get past the headline. I blame Tik-Tok Conclusions Every cycle it’s the same story: 1. MSTR breaks structure. 2. The red channel appears. 3. Everyone panics. 4. Then comes the silence. The only variable is how many motivational tweets Saylor can post before margin calls start rolling in. This setup isn’t new, isn’t rare, and isn’t bullish, it’s just math doing its job while people pretend it’s spiritual warfare. So yes, the red channel crossover is back. Same movie. Different year. Still ends badly for the extras. Ww Disclaimer ================================================================== This isn’t financial advice, obviously. If you need a stranger on the internet to tell you not to buy a company using borrowed money to gamble on Bitcoin, you deserve the portfolio you get. If it pumps, you’ll take credit. If it dumps, you’ll blame the FED. Either way, I’ll be here limiting my desire to say "I told you so"."MicroStrategy Admits a Bitcoin Sale Is Possible" finance.yahoo.com/news/microstrategy-admits-bitcoin-sale-possible-180141373.html "This marks a significant shift from Chairman Michael Saylor's long-standing "never sell" philosophy and signals a new chapter for the world's largest corporate Bitcoin holder. CEO Phong Le Reveals Hidden Kill-Switch in MicroStrategy’s Bitcoin Strategy MicroStrategy has confirmed a scenario almost no one thought possible: the potential to sell Bitcoin, its core treasury asset. Speaking on What Bitcoin Did, CEO Phong Le outlined the precise trigger that would force a Bitcoin sale: First, the company’s stock must trade below 1x mNAV, meaning the market capitalization falls below the value of its Bitcoin holdings. Second, MicroStrategy must be unable to raise new capital through equity or debt issuance. This would mean capital markets are closed or too expensive to access." Some great details here: youtube.com/watch?v=W7cCucQJtSIThis trade is now active. What that means: 1) Be long like Donkey Kong, all the way to the $300 area. 2) Exit in full by year end toward mid-January. Can't time it exactly, but that's the general exit period. On the daily chart below price action is oversold amidst the panic. A "Incredible buy" probability signal has printed. It is reliable. Ride price action back to market structure. It will feel euphoric, exit around $300.know many are short at the moment, that's unwise. Remain long to market structure as shown in main chart.
without_worries
صلیب مرگ بیت کوین: آیا نوامبر ۲۰۲۵ پایان جهان ارزهای دیجیتال است؟
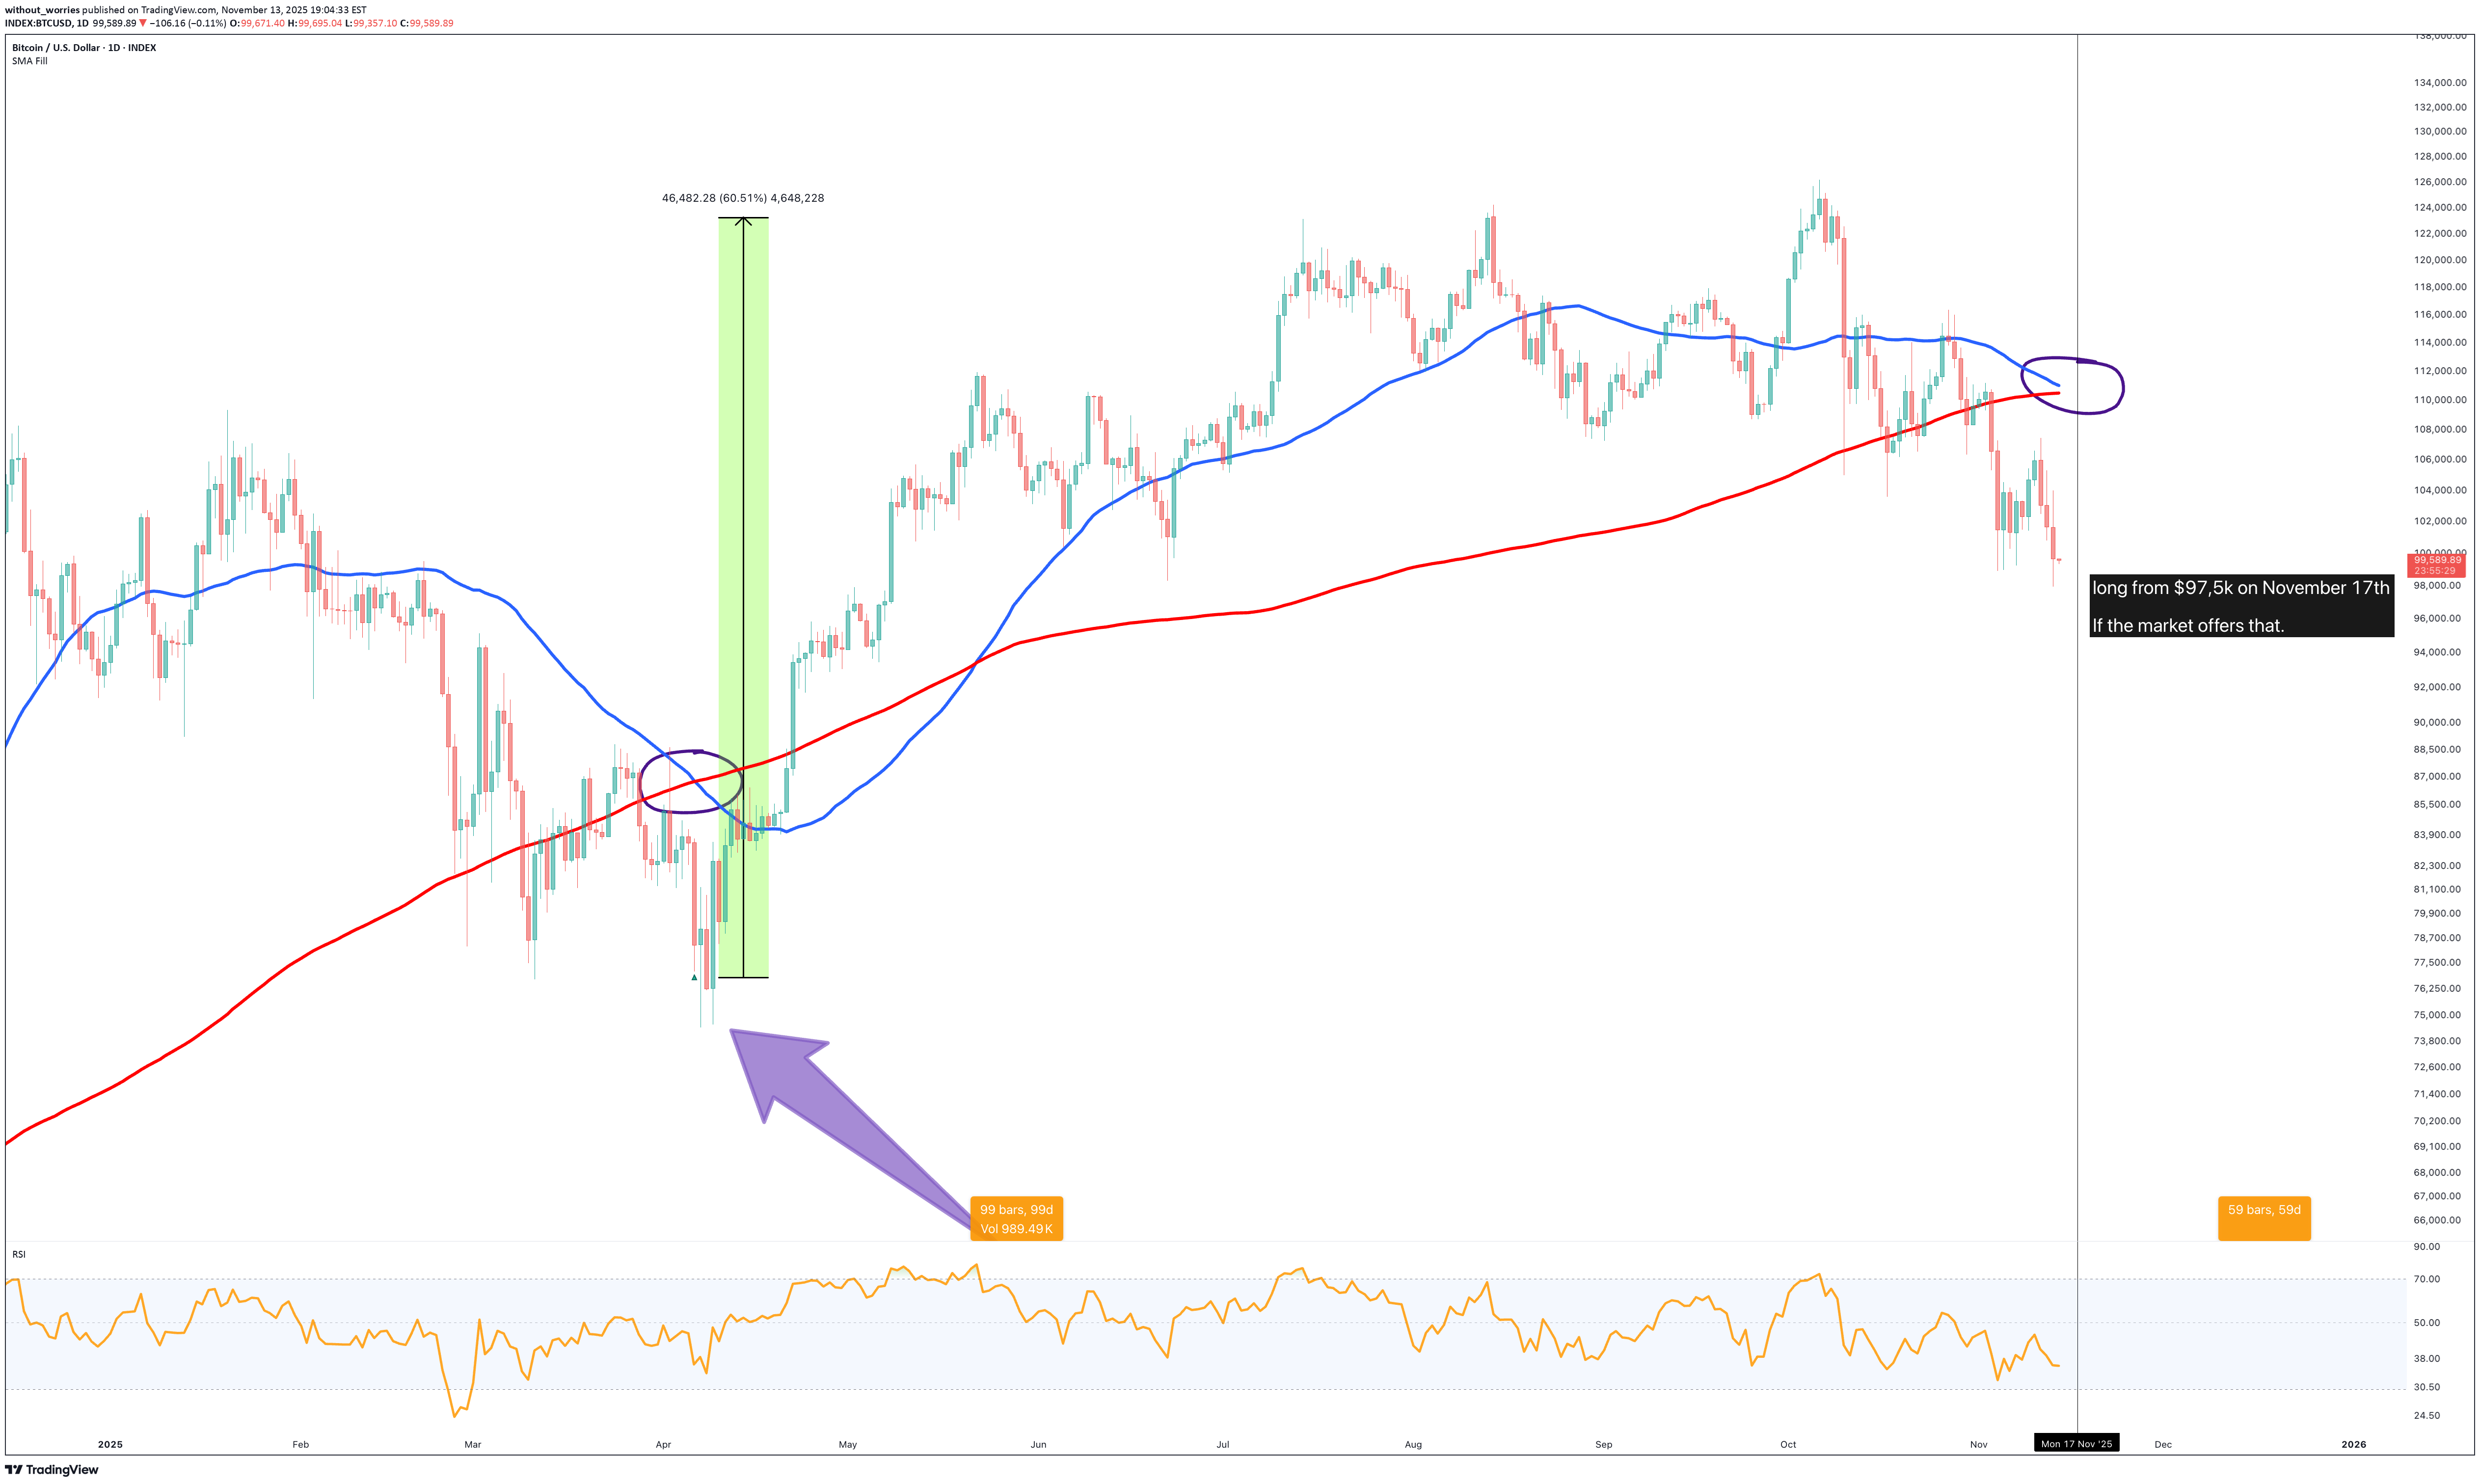
A Death Cross. Sounds terrifying, doesn’t it? Like something out of a low-budget horror film. Here in deepest darkest Bavaria you can’t drive ten minutes without seeing Christ nailed to a cross at every T-junction, it’s practically the local logo. Cross the Austrian border and the numbers multiply like leverage traders in a bull run. Lovely. But this? This is the real death cross. Or at least, that’s what the market thinks. Déjà vu… for the third time This is the third time I’ve written this post. And yes, it’s always at max fear. Every cycle the same: people panic, memes fly, and somewhere someone says, “It’s different this time.” Spoiler: it’s not. If you’re feeling nostalgic, click the little triangles where the purple arrows point on the chart. you’ll see the previous posts. The critics lined up back then too, bless ’em. Loud voices, small wallets, and Mum's voice in the background "Dinner's ready!". April 7th, 2025 Death cross August 18th, 2024 Death cross The November 17th Death Cross On the 1-day chart above, the signal is forecast to print by November 17th. That’s when the 50-day SMA (blue) crosses below the 200-day SMA (red) and price action sits under the 200-day line. It’s the technical version of your mother saying, “I’m not angry, just disappointed.” This forecast uses the Trigg & Leach method, the same one applied to prior crosses and it’s nailed every one since the bull market began. Closer Zooming out.. Time to market top: circa 59 days Here’s the clever bit, or as I call it, the boring maths no one reads. Historically after each Death Cross Bitcoin rallied before topping out. The time between the cross and the pivot has been shrinking: 1st Cycle → 179 days 2nd Cycle → 131 days 3rd Cycle → 99 days Apply some arithmetic progression, that’s a fancy way of saying “find the difference and pretend it means something.” Difference 1 131 − 179 = −48 Difference 2: 99 − 131 = −32 Average difference = −40 Therefore 99 − 40 = 59 days. That puts the potential cycle top mid-January 2026, and wouldn’t you know it, mid-January sell-offs are a Bitcoin tradition older than bad YouTube thumbnails. Conclusions So yes, a Death Cross is coming. Cue the headlines, the drama, and the bloke on X explaining Fibonacci levels like they’re sacred scripture. Look left. Every time this happened, it played out the same way: panic, bounce, despair, recovery. Rinse, repeat. The maths points to mid-January 2026 for the next swing high, and then gravity takes over. If it all goes to plan, brilliant. If not, add this one to your growing folder titled “Why I don’t listen to anyone on TradingView.” Ww Disclaimer ============================================================== This isn’t financial advice. I’m not your fund manager, your priest, or your mum. If you go all-in on Bitcoin because two squiggly lines made a cross, that’s your fault, not mine. If it pumps, you’ll say you “always knew.” If it dumps, you’ll tweet “market manipulation.” Either way, I’ll still be here, drinking tea and laughing at the comment section. So yes it’s a Death Cross. But relax. It’s just a chart, not the Book of Revelation. AhmenThe idea is now active. Price action could still sell off down to $90k with ease, even lower on the typical Monday sell off. But that's just an opportunity, when there's blood on the streets, take advantage. Don't forget, this is a daily chart, the upside period is limited to 59 days with the market top not being more than double this pivot low. So if we see $80k, then $160k is the top. $90k pivot low, then $180k is the top, understand? 59 days or double price, whichever comes first. Fully exit the crypto market at that time, the bear market will be extensive. Daily chart The bearish charts on Bitcoin that are published remain valid, nothing has changed. Remember most are on weekly or 3 week time frames. The above daily chart and progress over the next 59 days barely shows over 3x three weekly candles. Ww
without_worries
هشدار جدی به بیت کوین: آیا کانال گاوسی نوامبر ۲۰۲۵ پایان صعود است؟
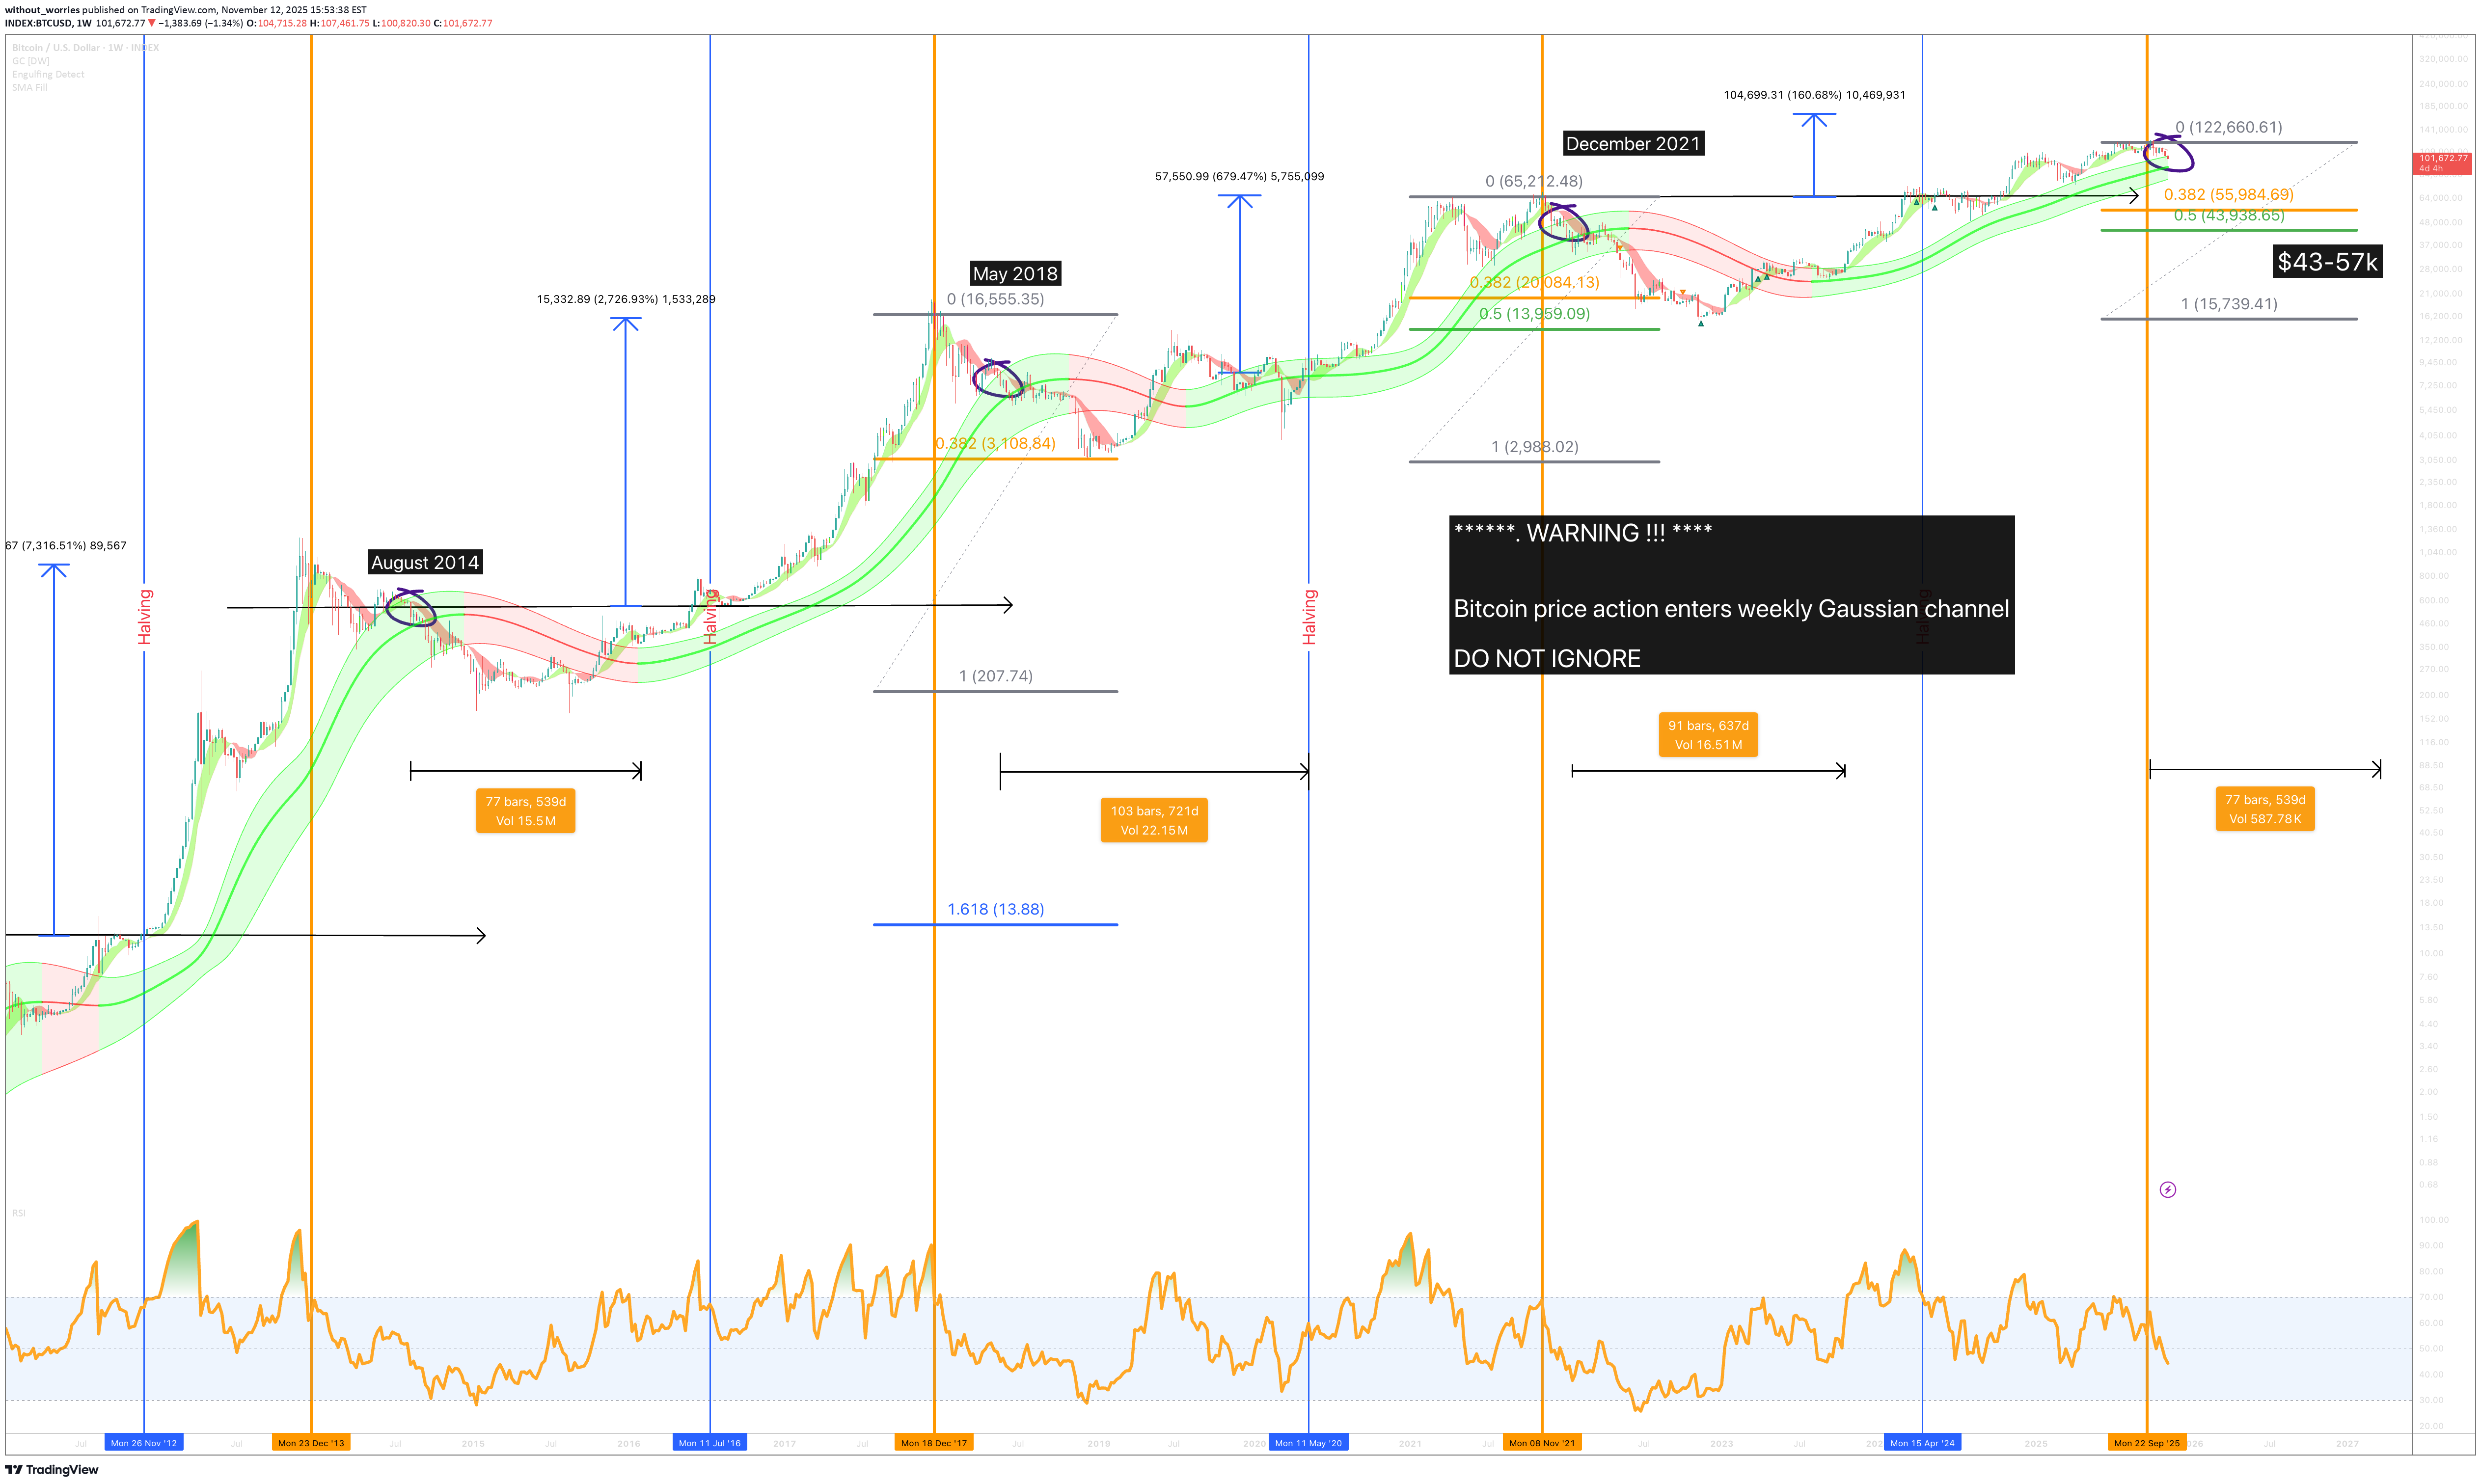
And the Bulls have until November 17th to undo that, or else… An alarm recently triggered, an alarm that had been completely forgotten about. That alarm has a message written to myself: “Bitcoin price action enters weekly Gaussian channel. Look left - DO NOT IGNORE” We look left, and pause, “ well isn’t that interesting ”, says the little voice of reason. I tell it to shut up as I convince myself this time is different. The technicals: Each candle circled from 2014 through until 2021 is the first candle to enter the weekly Gaussian channel following the market top. Now whether you believe the market top is in or not, that is not relevant. We’re only interested in facts. The facts are: Price action corrected -60% minimum upon entering the channel AFTER confirmation. Price action has until November 17th to confirm. That would result in a market bottom of $43k to $57k, Saylor’s fund would be wiped out. Price action would remain in a bear market condition for at least 18 months. Therefore no recovery until mid 2027. Closer Clarice What needs to happen to remain in a bull market? Price action must close above $110k, while technically speaking $105k is outside the channel, that would be a weak close. A weak close as the previous bar engulfs the print. Conclusions So here we are again, Bitcoin’s entered the weekly Gaussian channel, that green noodle of doom. Every time it happens, people scream “buy the dip!” as if chanting it makes the red candles go away. Look left, seriously, just look. Every single time price action’s wandered into that channel since 2014, it’s been the start of an 18-month spa retreat for the bears. “This time is different,” they say. In each cycle Bitcoin entered the Gaussian channel price dropped roughly -60 % and stayed miserable for over a year. And 2025 has been glorious right?, all Bitcoin maxis ever wanted was a fiat replacement. Congratulations, price action is the same as it was this time last year and look set to continue the trend! Why the long faces?! Isn't this what you wanted? Was never about more dollars was it? 1 Bitcoin still = 1 Bitcoin after all. Now the bulls have got until November 17th to prove this isn’t another replay. If the bulls can’t push price back above $110 k (and hold it), it’s curtains. $43k – $57k becomes the new meditation zone while Saylor and the laser-eye crew quietly delete their tweets. Ww Disclaimer ============================================================= This isn’t financial advice. It’s a bloke on the internet pointing at a rainbow-coloured curve saying “that’s bad.” If you mortgage your house because you think I’ve uncovered the secret code of the Gaussian gods, that’s on you. If it pumps, you’ll call yourself a genius. If it dumps, you’ll say the whales manipulated it. Either way, I’ll still be here, laughing at the comments section. So yes, DO NOT IGNORE the channel. But also, don’t sell your kidneys because a stranger on TradingView drew some squiggly lines.Would you like a bullish idea for Bitcoin that counters this very idea? A bullish idea with a date when the market will turn beautiful and green? (a lot sooner than you think). An idea using the same methods published twice before on this very platform that saw price action rally a minimum of 60%? Everyone is ignore this important signal.The bulls have 72hrs to push price action above 110k to get back out the channel. Otherwise this idea becomes active. Can they do it?If you look left at all previous Bitcoin bull market tops AND following weekly entry into the Gaussian channel you'll observe this pattern as shown below. What then are you watching for this week? You're watching for a small candle body close on the medium line. Should the week close out where price action is today, a small body will print. This is an indication of two things: 1) Weakness. No one is buying, apart from fools and their money. 2) A test of the lower channel is now highly probable, which is currently around $80k. After that happens, you'll be watching for a repeat of same on the lower channel. Should a weekly candle close underneath the channel, they price is very likely to continue its sell off towards the $45k area.Bitcoin now enters the 10 day channel. This is a fact throughout the history of Bitcoin. Ready? Eyes wide open? Every time a candle body has closed inside this channel, a -60% at least has followed. That would take price action to the $35k area. I know, this time is different. Saylor said wonderful things, like mortgage your house to buy Bitcoin. He'll still have a house even if he lost all, you won't. 10 day chartThe complete 70% collapse of Bitcoin price action on the higher time frames appears to be confirming. This correction is made all the more dramatic as the DXY corrects with Bitcoin. That is weak. The "Do not ignore!!" alarm strikes again.
without_worries
پیشبینی سقوط دوجکوین: آیا نوامبر ۲۰۲۵ به ۴ سنت میرسیم؟
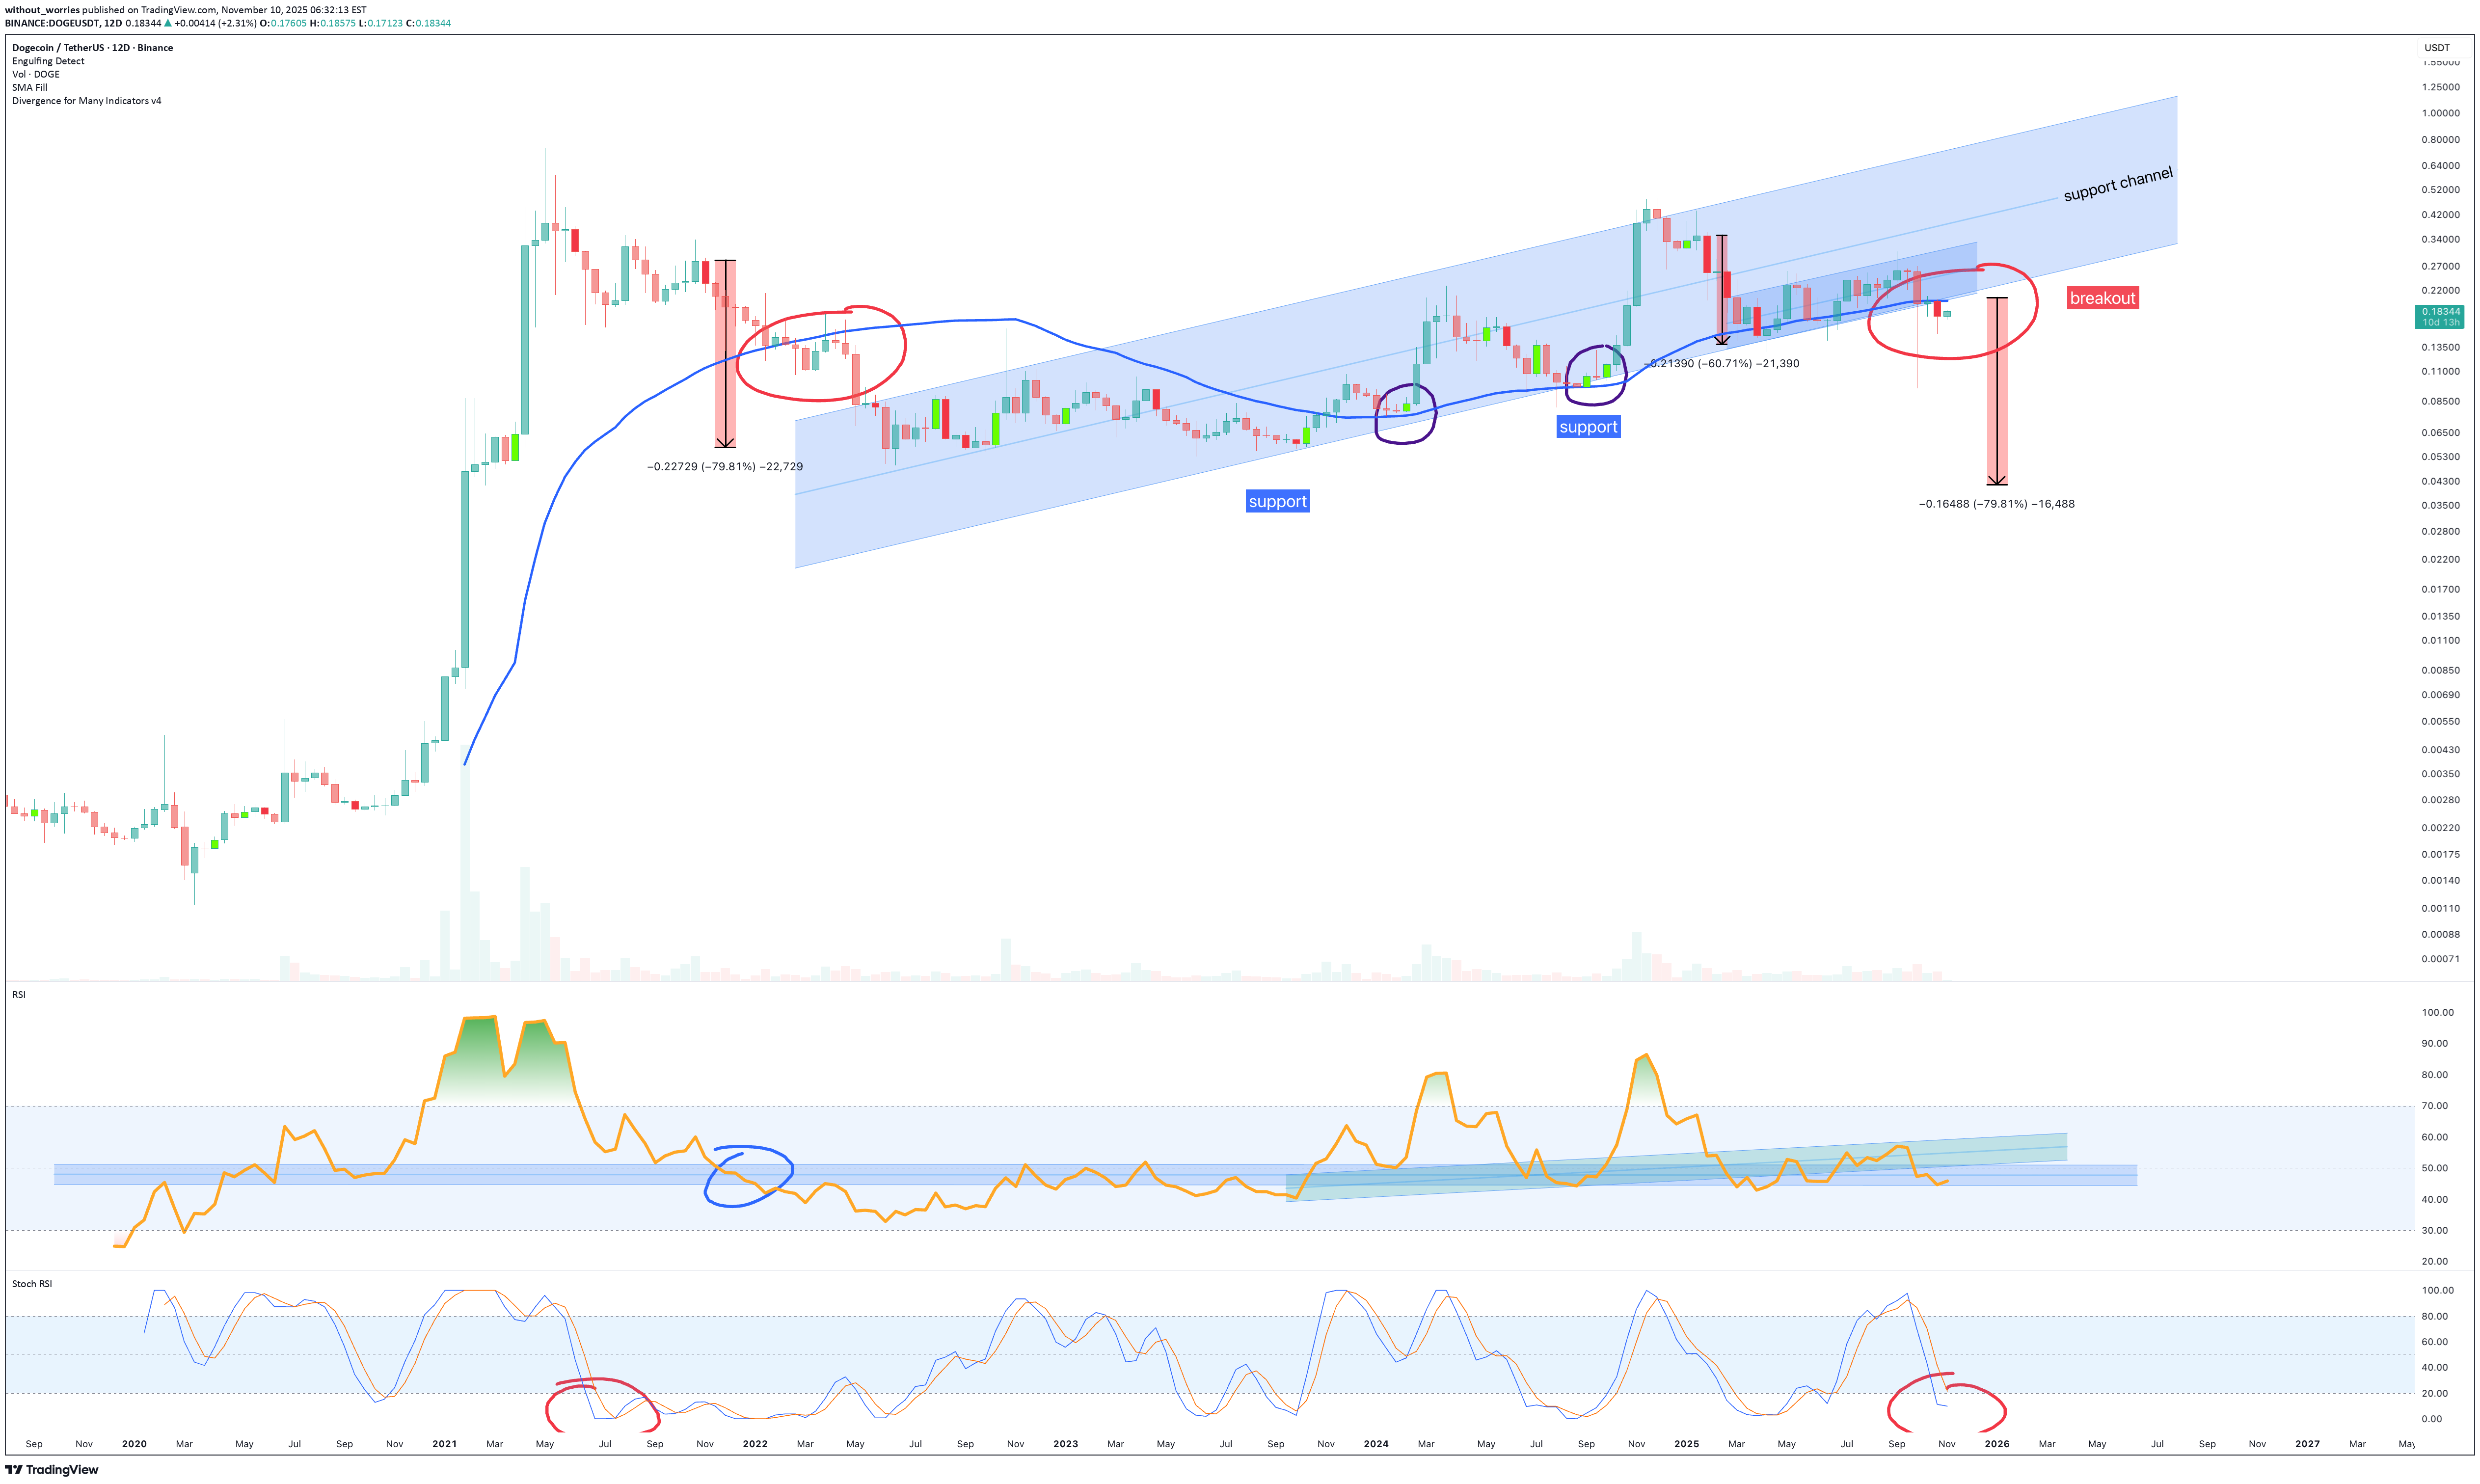
Here we go again. Dogecoin, the only “currency” that started as a joke, became a religion, and now looks like it’s back on life support. Every time the blue line (that’s the 50 SMA on shown 12-day chart above) touches price, the crowd shouts, “It’s breaking out!” Then gravity reminds everyone how charts and physics actually work. Look left As price action closed a 10 or 12 day candle on or below the blue line, that is the 50SMA, price rises to the moon or falls off a cliff. It’s like déjà vu but more expensive. The technicals (A.K.A. reality check) 1. The support channel: Price has been obediently bouncing inside that nice little rising channel since 2022. When you see price action following the channel rather than reacting to it, that’s a warning. That's a warning of impending weakness. Now price has fallen like a drunk through a coffee table. 2. The RSI: Hovering in the mid-40s, which basically means it’s deciding whether to bother trying or just give up quietly. If it creeps down to 42, abandon ship! 3. The Stochastic RSI: You can see it curling down again. That red circle? That’s the technical equivalent of a yawn before a nap, usually followed by a drop. Once you’re below 20, you’re staying there for a period. See that 78% correction from 2021? Yeah, we’ve just printed the same setup again (points 1 through 3). The only thing missing is a Twitter meme from a ketamine fuelled billionaire. The Forecast Best case: A dead cat bounce back to the bottom of the channel (~$0.17). Congrats, you’ve broken even on the way to losing more. Base case: Another 70–80% correction, just like last time. History doesn’t repeat, but Dogecoin traders sure do. Price action would test 4-5 cents in this instance. Worst case: Elon tweets something, it pumps 40% in an hour, and you buy the top again. Conclusions Dogecoin still does what it’s always done, remind us that markets are powered more by emotion than logic. It was fun while it lasted, but the joke’s over. The punchline is your portfolio. If history is any guide, the next few months will be spent pretending this is “accumulation.” It isn’t. It’s denial with extra steps. Could it moon again? Sure. So could my toaster if Elon tweets about it. Ww Disclaimer =============================================================== This isn’t financial advice. It’s a bloke on the internet pointing at a picture of a dog and some candles. If you buy Dogecoin because of this, don’t DM me crying when it tanks, call your therapist. If it pumps, you’ll call yourself a genius. If it dumps, you’ll call it market manipulation. Either way, it’ll be hilarious.On market structure. A weekly candle cannot close below 0.15 This idea becomes active should that happen. Doom!Down almost 30% already. Falling faster than an influencer's creditability.
without_worries
تقاطع مرگ بیت کوین SUI: فریب هولناک یا طلوع ۹۰۰ درصدی؟
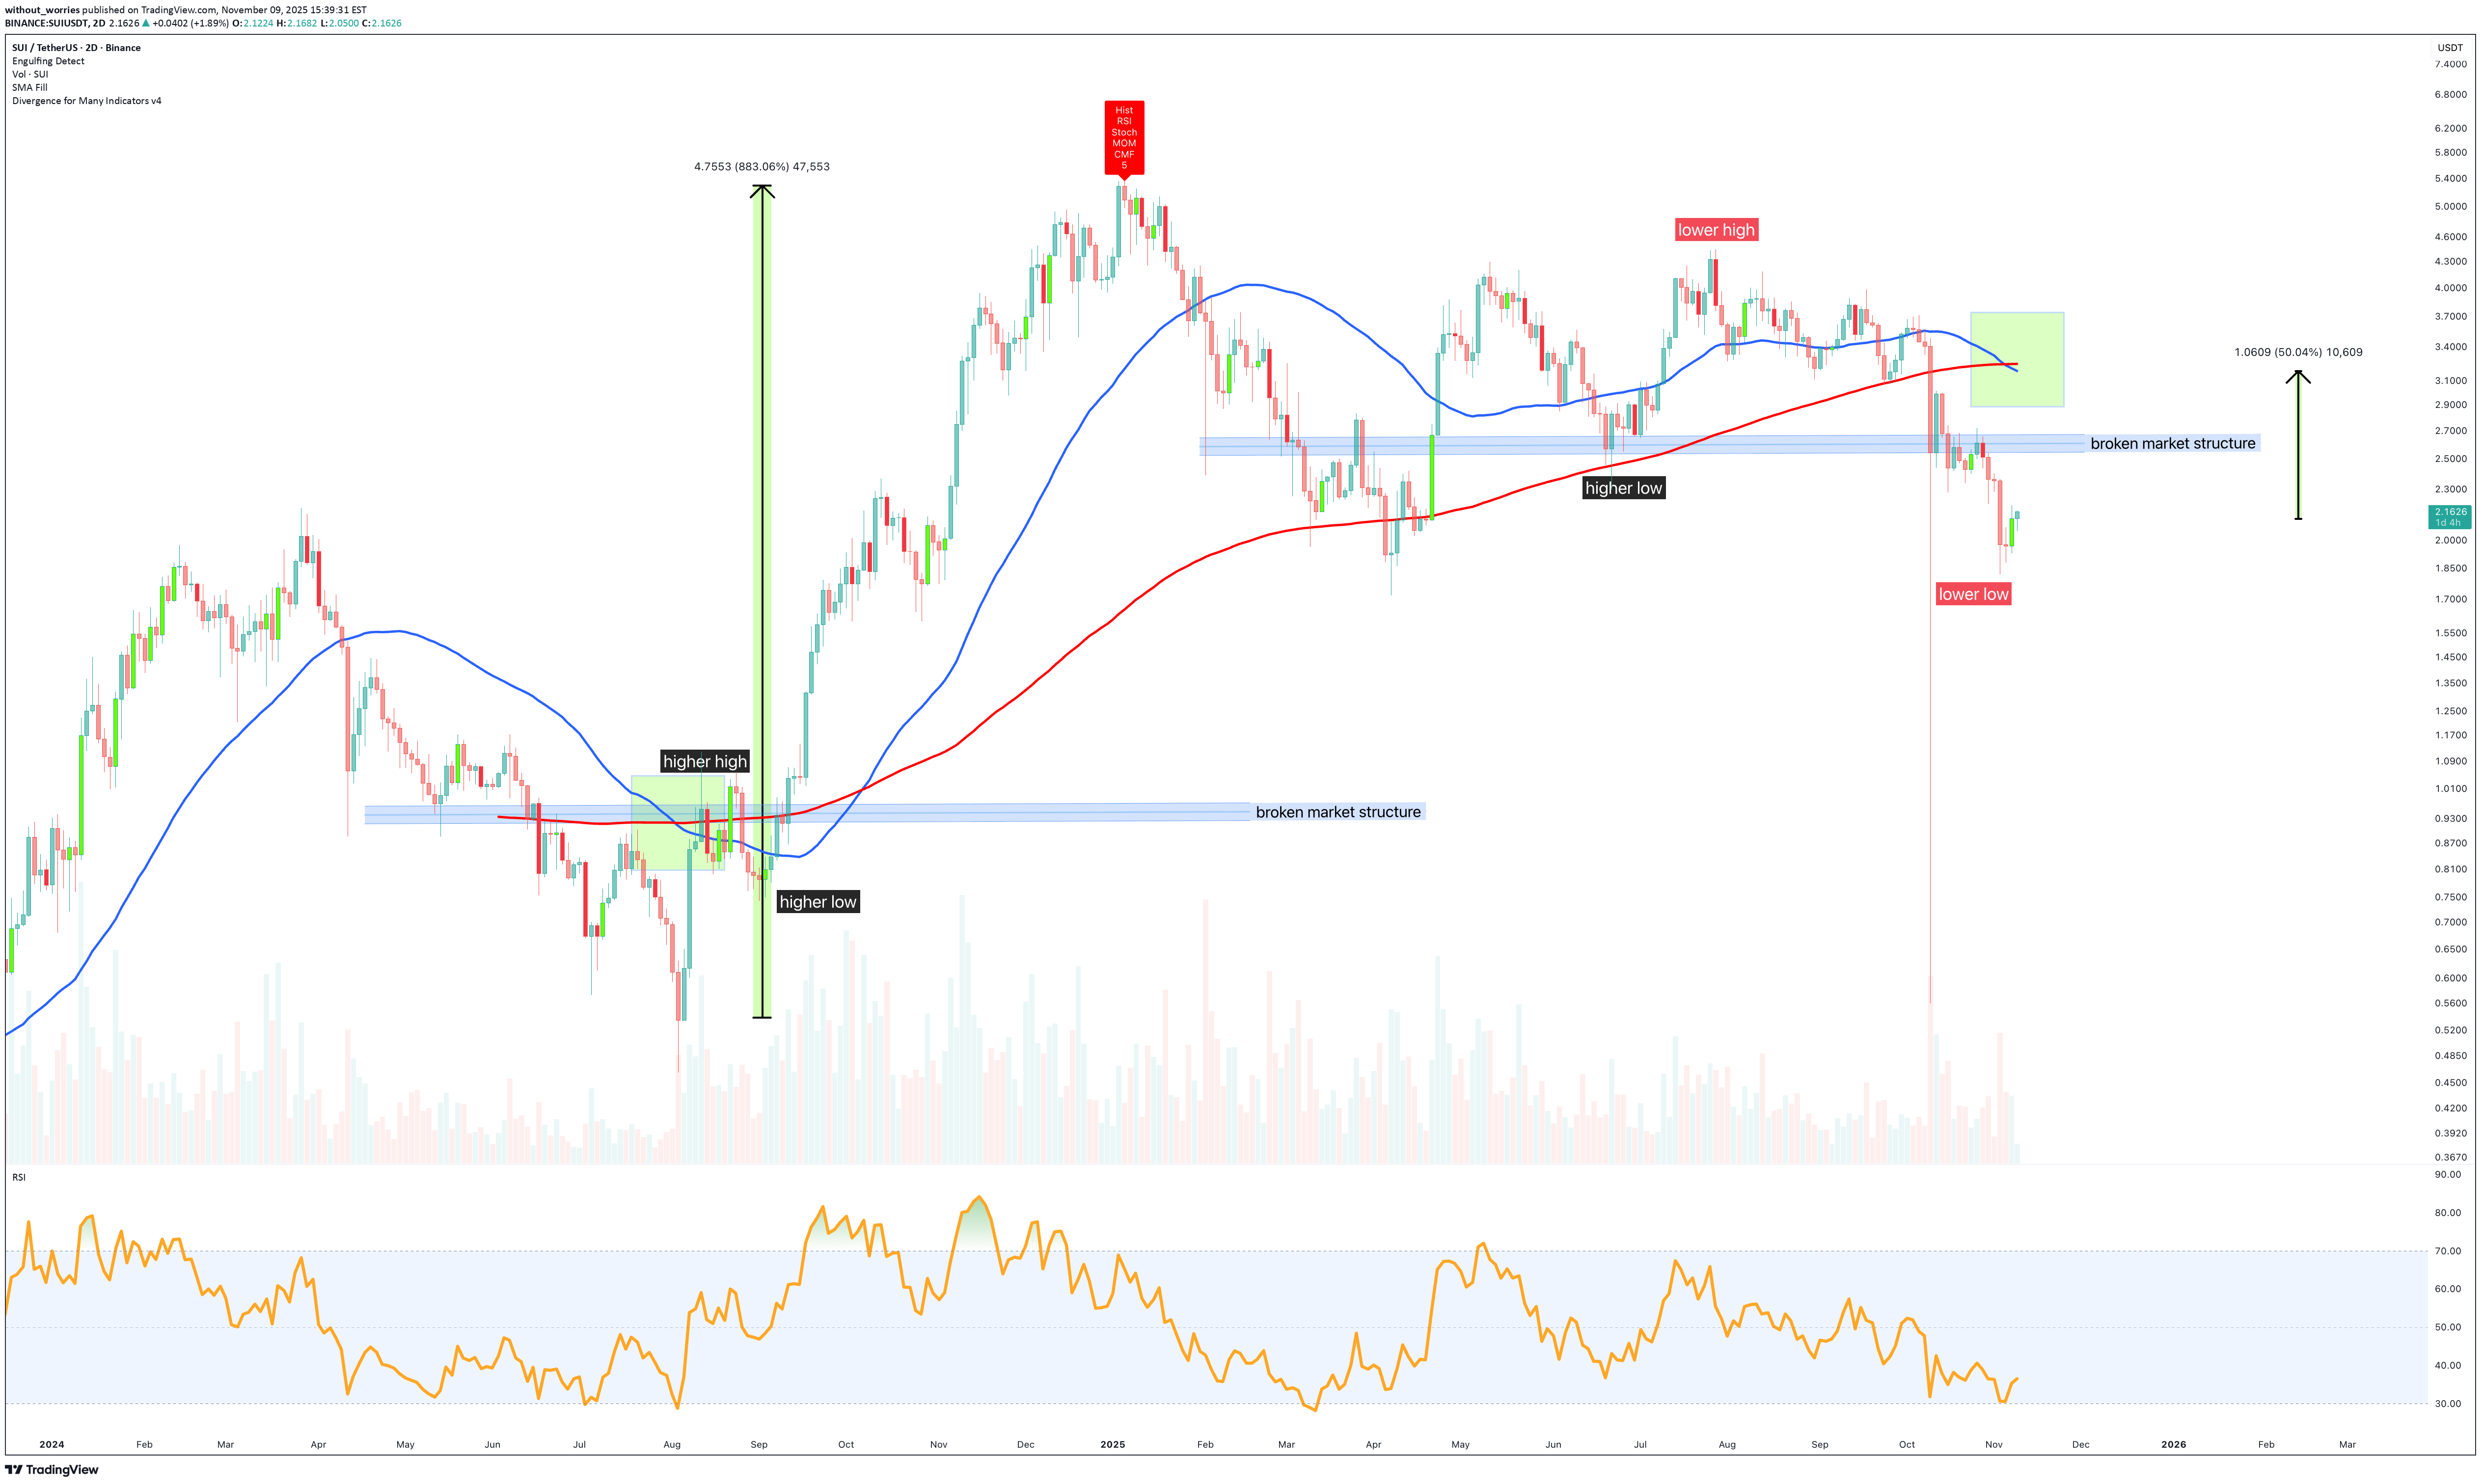
A 2 day death cross prints on the above 2 day chart of SUI. That is when the 2-day 50 SMA crosses down the 2-day 200 SMA (red). Sounds bearish doesn’t it? The truth, when looking left, was far different. Price action climbed an astonishing 900% on the 2 day death cross print. Is history repeating? Maybe. There’s two questions that first must be positively answered before a repeat of history: 1. The trend, is higher highs higher lows printing? 2. Support and resistance, which is it? Both questions are negatively answered at this moment. A long position is irrational until that changes. Moving averages do not predict the future Too easily traders see moving averages as a forecast of things to come. It feels dumb for saying this: " A moving average is the average value for a set of values over a given period of time ". You’d be surprised how many people do not realise that. Moving averages are telling you something of the past and nothing about the future. Only questions 1 and 2 can do that. What can be expected? It is clear an upward move in price action can be expected on the death cross print. At least until market structure. This would be a 50% gain from price action today. After that, questions 1 and 2 must become positive, just as before in late 2024. Conclusions The so-called death cross, a term that sounds far more apocalyptic than it deserves, has once again provoked hysteria in the usual corners of the market. Every time two moving averages intersect, a small army of self-anointed prophets appear, clutching at trend lines as though they were holy scripture. But, as ever, the data mocks the drama. The last time this same formation appeared, SUI didn’t die, it rose ninefold. That’s not a harbinger of doom; it’s a reminder that the market, unlike superstition, doesn’t care for human expectations. Until higher highs and higher lows reassert themselves, until resistance becomes support, the idea of a renewed uptrend remains aspirational rather than empirical. To treat a moving average as predictive is to confuse the rearview mirror for the road ahead. It tells us what has been, not what will be. Yet traders persist in treating it as gospel, and then curse the market for their misplaced faith when the price does not comply. A short term rally is likely to occur, as it often does when hysteria meets technical imbalance. But without confirmation of structure, such rallies are little more than reprieves, merciful pauses in an otherwise indifferent process of price discovery. Ww Disclaimer ======================================================= This isn’t financial advice. If you’re making trades because a bloke on the internet wrote “death cross” in bold letters, you deserve every emotional rollercoaster that follows. I don’t care if you’re bullish, bearish, or just bored, or if you lose money, that’s not a “market manipulation conspiracy,” that’s just you being wrong. Do your own research, manage your own risk, and please, for everyone’s sake, stop treating moving averages like they’re tarot cards.
Disclaimer
Any content and materials included in Sahmeto's website and official communication channels are a compilation of personal opinions and analyses and are not binding. They do not constitute any recommendation for buying, selling, entering or exiting the stock market and cryptocurrency market. Also, all news and analyses included in the website and channels are merely republished information from official and unofficial domestic and foreign sources, and it is obvious that users of the said content are responsible for following up and ensuring the authenticity and accuracy of the materials. Therefore, while disclaiming responsibility, it is declared that the responsibility for any decision-making, action, and potential profit and loss in the capital market and cryptocurrency market lies with the trader.