Technical analysis by without_worries about Symbol BTC on 12/14/2025

without_worries
A continued crash to $45k for Bitcoin? - December 2025
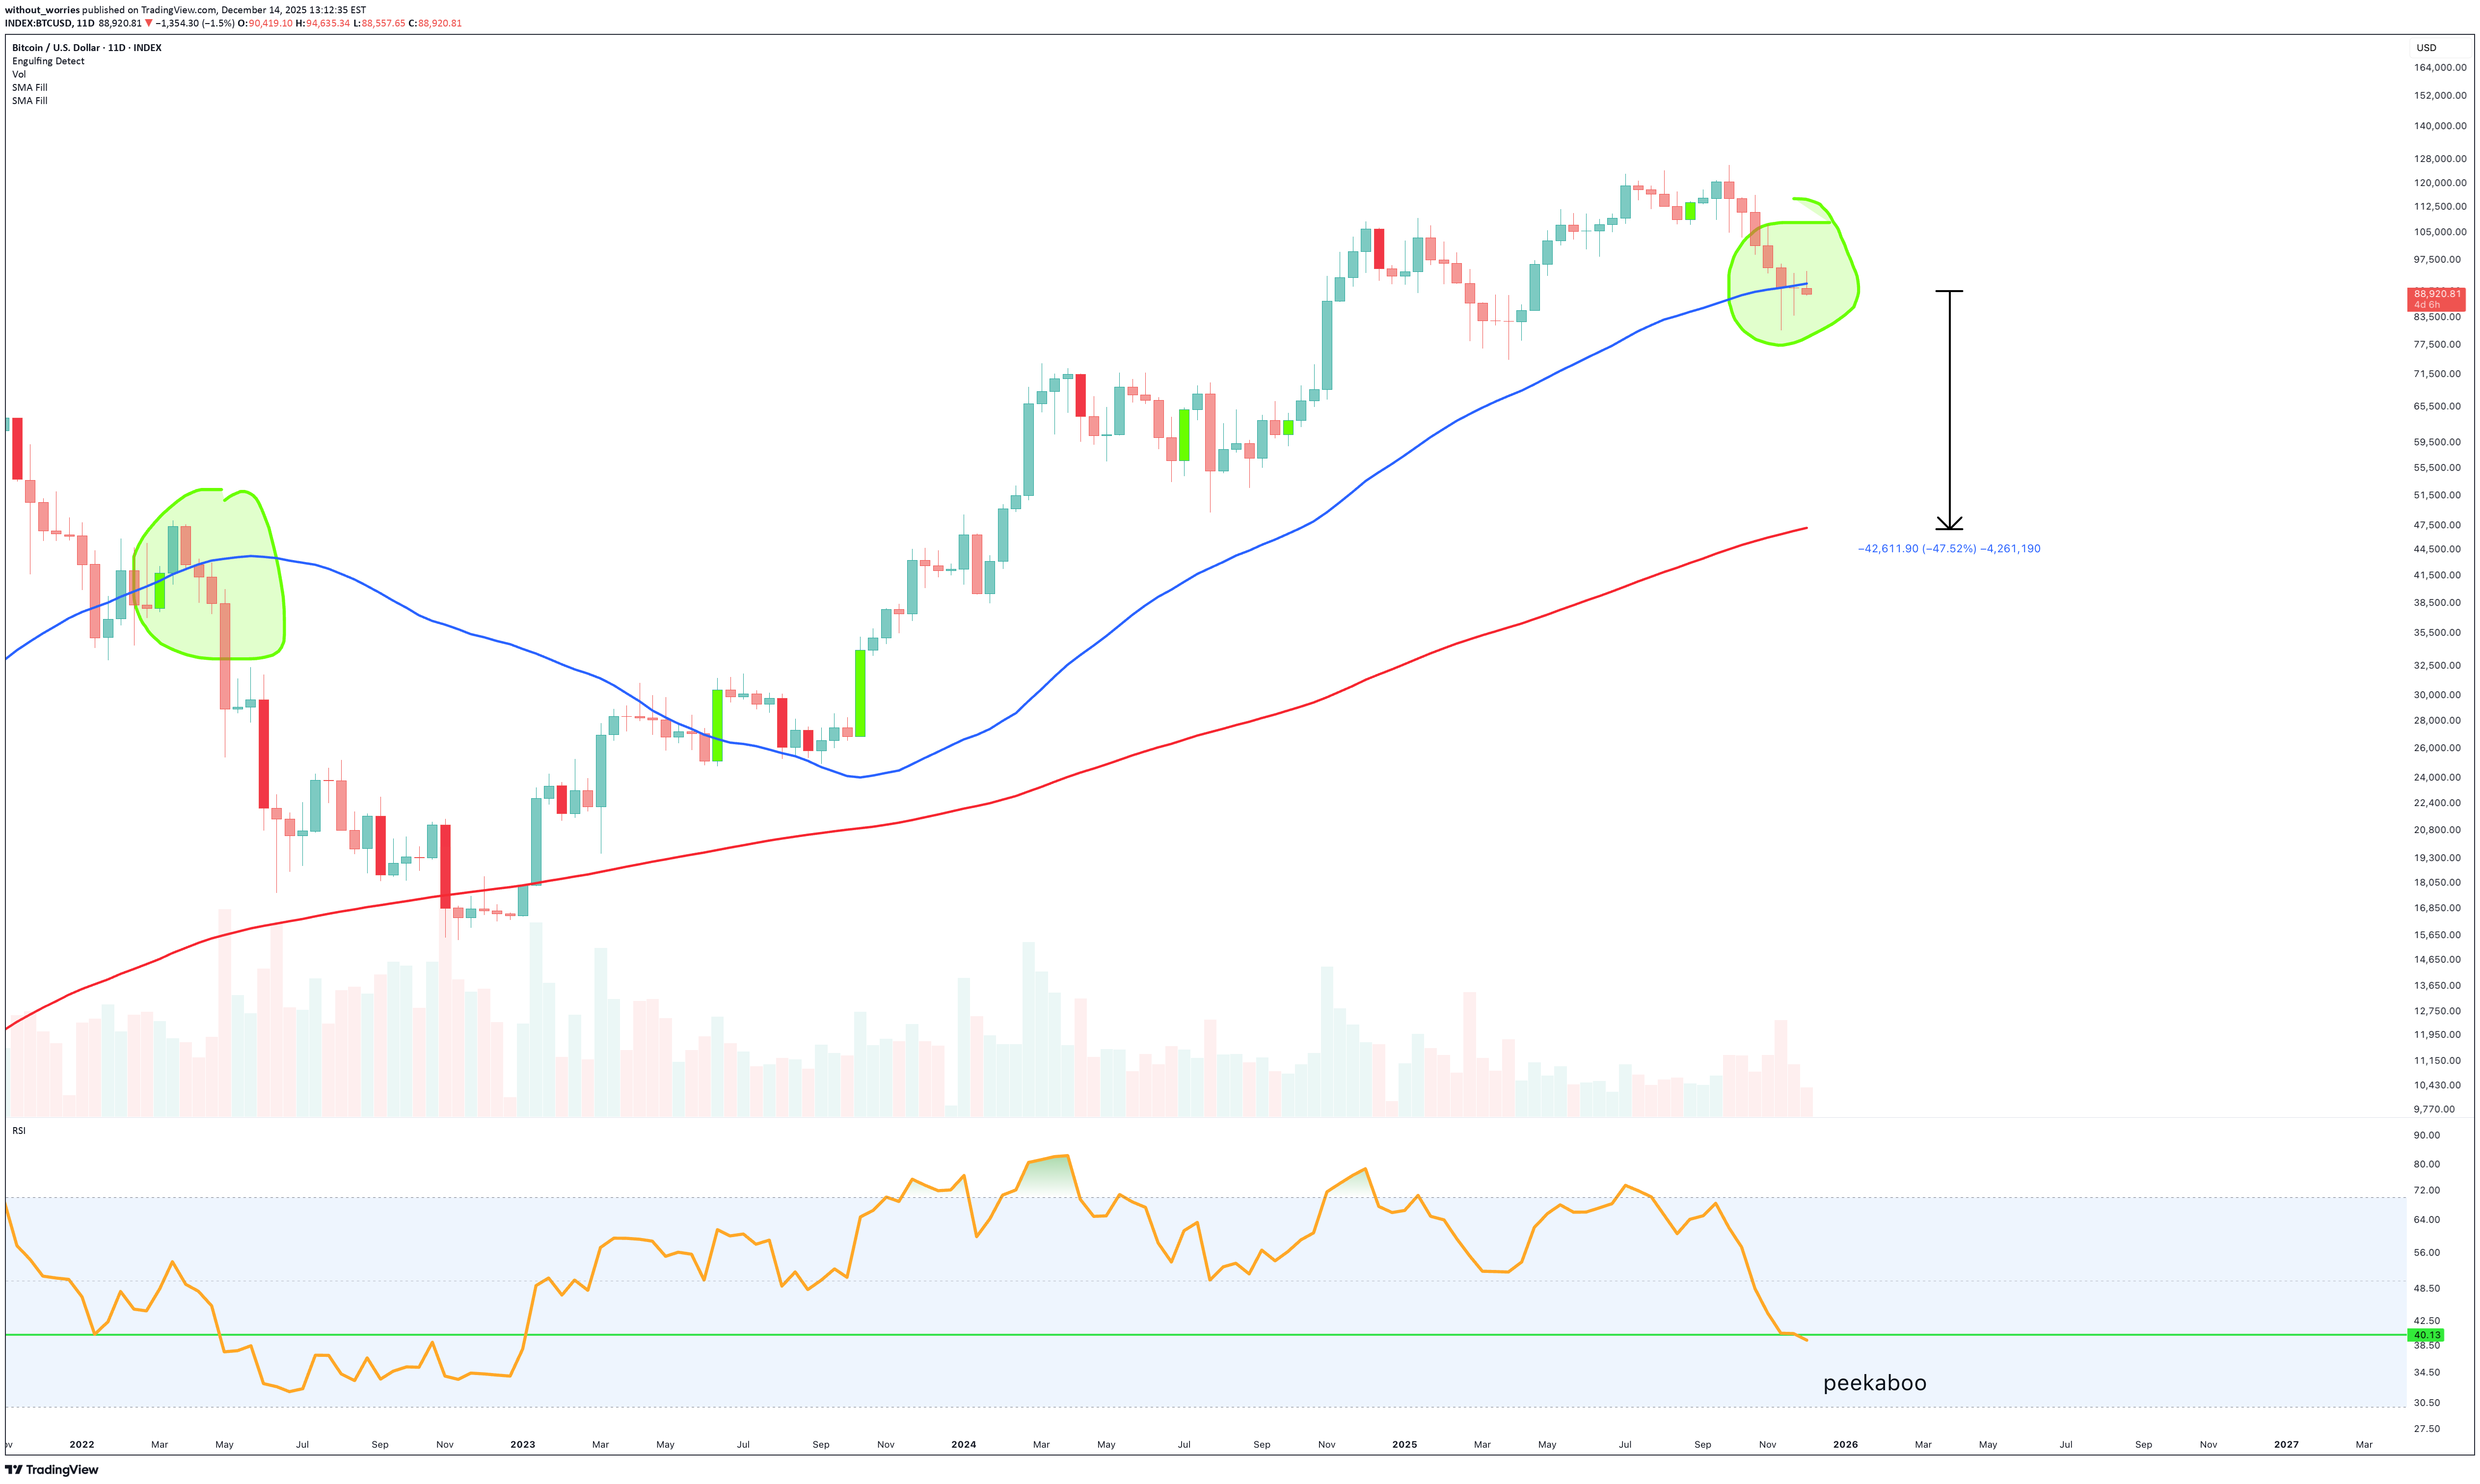
Bitcoin has 5 days to stop the current candle body print under the 11 day 50SMA. Throughout the entire history of Bitcoin, a candle body close under this level has meant a test of the 11 day 200SMA. It is that simple. Never a false signal. Here are all the historical data points: 50SMA on the 11 day chart throughout all Bitcoin history At the moment the candle prints as a Gravestone DOJI. Zoom in a little further to the 3 day chart and you can see price action follows the 200SMA. Does not matter what the asset is, anytime you see this, it is a sign of weakness. Look left. Regardless of asset, a complete collapse typically follows. Even if price action staggers like a drunken sailor finding his way back to port. The idea " Is a Bitcoin crash to $40–45k next? – October 2025 " published around $120k made the break of market structure very clear. This idea is a continuation of the same break of structure. The spite continues to pour in for this idea. The market does not care. Micheal Saylor's lenders will likely become very nervous should this continuation confirm. A forced liquidation of Strategy would be the best thing that could happen to the Bitcoin space in my opinion as the cash to pay out Dividends must come from somewhere, and that means selling Bitcoins. In an already depleted marketplace. Have noticed influencers gaslighting audiences with "Black rock" is buying your panic selling at this time posts. Conclusions Let’s not dress this up like a TED Talk. Bitcoin has five days to avoid doing the thing it has never once avoided in its entire history. That’s not drama, that’s statistics, the boring kind that ruins hopium. A confirmed candle body close under the 11-day 50 SMA has always resulted in a test of the 11-day 200 SMA. No exceptions. No “yeah but this time BlackRock…”. No spiritual awakening mid-candle. Just gravity doing what gravity does. At present, price is printing a gravestone DOJI. Which, despite the name is not a bullish candle, unless you’re a fan of irony or funerals. The break of market structure was identified months ago near $120k, when optimism was peaking and common sense was being shouted down by people with laser eyes and affiliate links. Since then, price action has done exactly what broken structure does: grind, fail, and roll over. A move toward $45k is not a prediction pulled from thin air, it’s a mechanical outcome if the current signal confirms. If that level is reached, it will be framed as a “black swan”, despite being broadcast loudly, publicly, and repeatedly in advance by yours truly. As for the Saylor situation, leverage works both ways. Lenders get nervous. A forced seller in a thin market is never bullish, no matter how many times “BlackRock” is whispered like a protective spell. If this cascade happens, it won’t kill Bitcoin. It will do something far worse to the influencers: it will expose them. And frankly, that might be the healthiest thing this market has seen in years. Ww Disclaimer ============================================================== This is not financial advice. It is not a call to panic, sell the bottom, or tweet angrily at strangers. Markets can invalidate any thesis at any time. If price action reclaims structure and closes decisively back above key moving averages, this outlook changes. Loyalty to a chart after it’s wrong isn’t conviction, it’s just stubbornness with a Wi-Fi connection. If you’re trading with leverage, emotion, or borrowed confidence from YouTube thumbnails, none of this will save you. If you’re trading probabilities, history, and structure, then this is simply the chart doing what it has always done, while people insist it won’t.Further study of this idea on the same 11 day chart except on the Gaussian channel. This fact has a 100% success rate. It states: a) For every time price action closed a 11 day candle body inside the Gaussian channel, price action tested the bottom of the channel. b) For every time price action closed a 11 day candle body inside the Gaussian channel, price action tested the Fibonacci 50% level. That means if price fails to recover $95k by this Friday, there is a 100% probability price action drops like a brick to $45k Buy some crypto, influencers tell me it'll make you rich.This chart has confirmed, until the opposite happens. That is, a candle body closes above the 11 day 50 SMA as throughout history. You'll not know this until the end of January. In the meantime, price action has confirmed a bearish trend. Remember this is a 11 day chart, price action takes time to develop. What to expect as this unfolds: 1) A rally back to market structure (look left last green circle), a rally back to structure is not untypical on confirmation regardless of asset. 2) The rally takes price action to $100k to $106k, or 20% 3) At this level no trade exists. This is market structure. 90% of folks will be bull, I'll be neutral. Always wait for further confirmation. 11 day