Technical analysis by without_worries about Symbol BTC on 11/12/2025

without_worries
هشدار جدی به بیت کوین: آیا کانال گاوسی نوامبر ۲۰۲۵ پایان صعود است؟
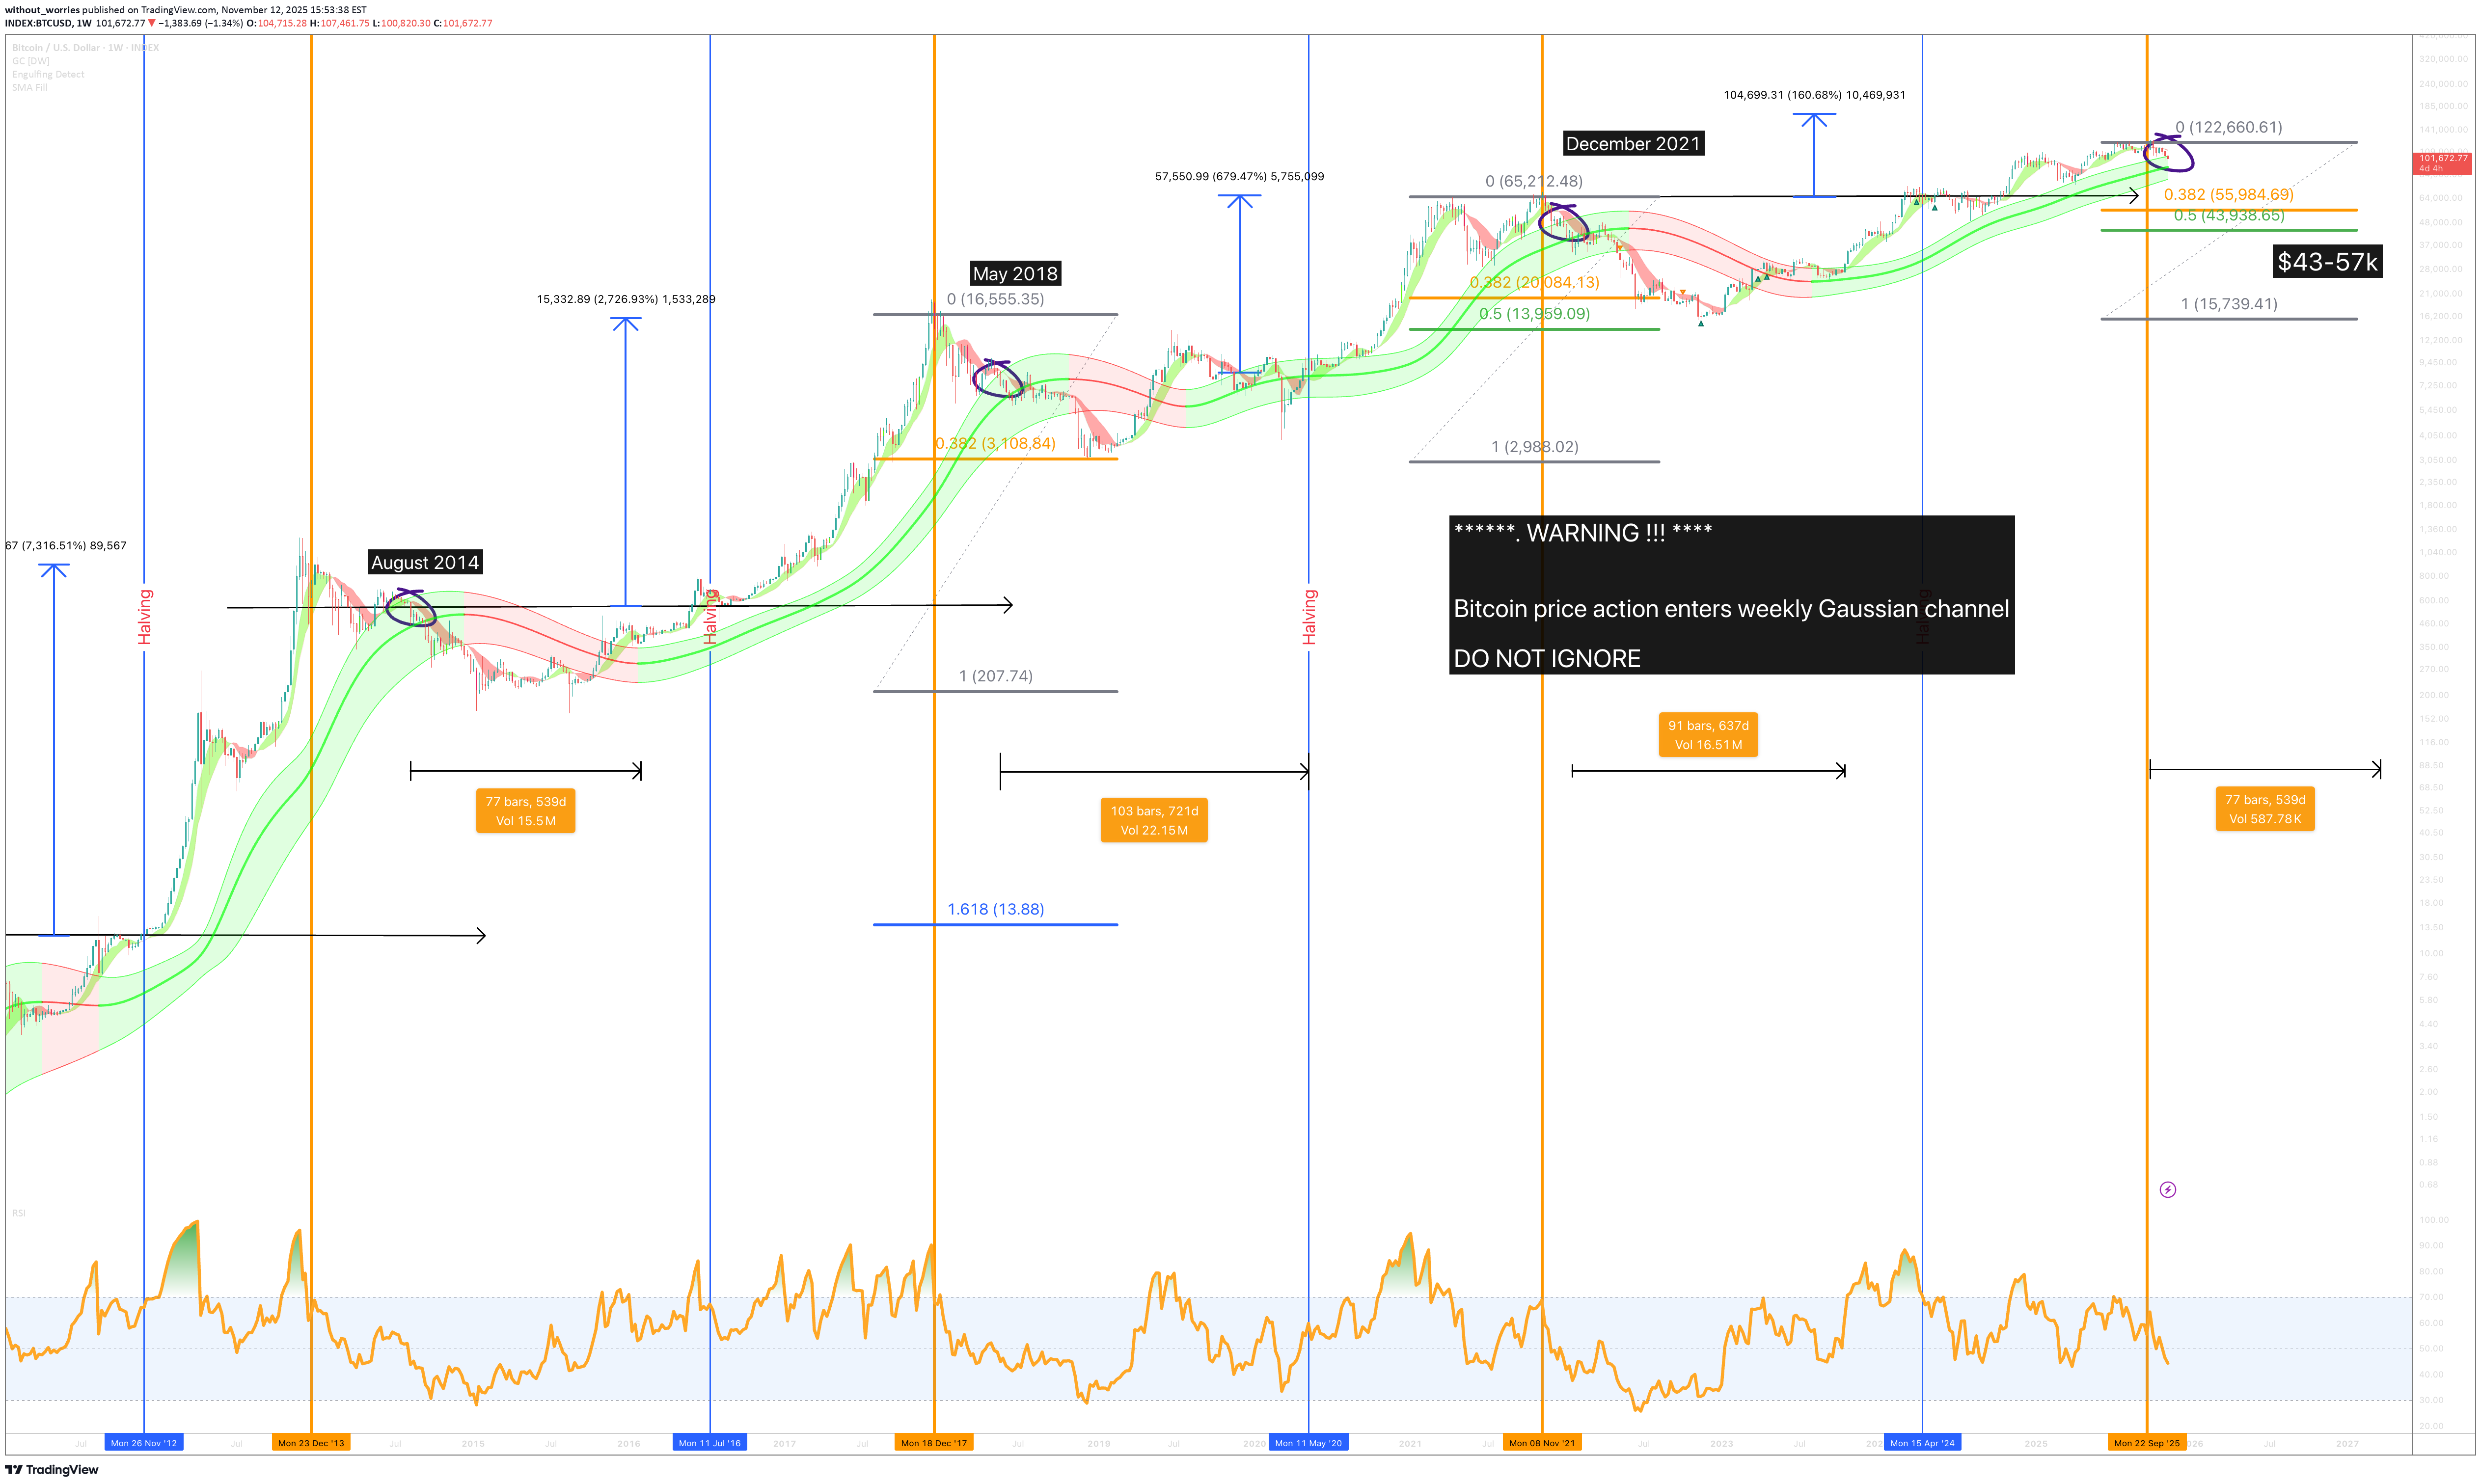
And the Bulls have until November 17th to undo that, or else… An alarm recently triggered, an alarm that had been completely forgotten about. That alarm has a message written to myself: “Bitcoin price action enters weekly Gaussian channel. Look left - DO NOT IGNORE” We look left, and pause, “ well isn’t that interesting ”, says the little voice of reason. I tell it to shut up as I convince myself this time is different. The technicals: Each candle circled from 2014 through until 2021 is the first candle to enter the weekly Gaussian channel following the market top. Now whether you believe the market top is in or not, that is not relevant. We’re only interested in facts. The facts are: Price action corrected -60% minimum upon entering the channel AFTER confirmation. Price action has until November 17th to confirm. That would result in a market bottom of $43k to $57k, Saylor’s fund would be wiped out. Price action would remain in a bear market condition for at least 18 months. Therefore no recovery until mid 2027. Closer Clarice What needs to happen to remain in a bull market? Price action must close above $110k, while technically speaking $105k is outside the channel, that would be a weak close. A weak close as the previous bar engulfs the print. Conclusions So here we are again, Bitcoin’s entered the weekly Gaussian channel, that green noodle of doom. Every time it happens, people scream “buy the dip!” as if chanting it makes the red candles go away. Look left, seriously, just look. Every single time price action’s wandered into that channel since 2014, it’s been the start of an 18-month spa retreat for the bears. “This time is different,” they say. In each cycle Bitcoin entered the Gaussian channel price dropped roughly -60 % and stayed miserable for over a year. And 2025 has been glorious right?, all Bitcoin maxis ever wanted was a fiat replacement. Congratulations, price action is the same as it was this time last year and look set to continue the trend! Why the long faces?! Isn't this what you wanted? Was never about more dollars was it? 1 Bitcoin still = 1 Bitcoin after all. Now the bulls have got until November 17th to prove this isn’t another replay. If the bulls can’t push price back above $110 k (and hold it), it’s curtains. $43k – $57k becomes the new meditation zone while Saylor and the laser-eye crew quietly delete their tweets. Ww Disclaimer ============================================================= This isn’t financial advice. It’s a bloke on the internet pointing at a rainbow-coloured curve saying “that’s bad.” If you mortgage your house because you think I’ve uncovered the secret code of the Gaussian gods, that’s on you. If it pumps, you’ll call yourself a genius. If it dumps, you’ll say the whales manipulated it. Either way, I’ll still be here, laughing at the comments section. So yes, DO NOT IGNORE the channel. But also, don’t sell your kidneys because a stranger on TradingView drew some squiggly lines.Would you like a bullish idea for Bitcoin that counters this very idea? A bullish idea with a date when the market will turn beautiful and green? (a lot sooner than you think). An idea using the same methods published twice before on this very platform that saw price action rally a minimum of 60%? Everyone is ignore this important signal.The bulls have 72hrs to push price action above 110k to get back out the channel. Otherwise this idea becomes active. Can they do it?If you look left at all previous Bitcoin bull market tops AND following weekly entry into the Gaussian channel you'll observe this pattern as shown below. What then are you watching for this week? You're watching for a small candle body close on the medium line. Should the week close out where price action is today, a small body will print. This is an indication of two things: 1) Weakness. No one is buying, apart from fools and their money. 2) A test of the lower channel is now highly probable, which is currently around $80k. After that happens, you'll be watching for a repeat of same on the lower channel. Should a weekly candle close underneath the channel, they price is very likely to continue its sell off towards the $45k area.Bitcoin now enters the 10 day channel. This is a fact throughout the history of Bitcoin. Ready? Eyes wide open? Every time a candle body has closed inside this channel, a -60% at least has followed. That would take price action to the $35k area. I know, this time is different. Saylor said wonderful things, like mortgage your house to buy Bitcoin. He'll still have a house even if he lost all, you won't. 10 day chartThe complete 70% collapse of Bitcoin price action on the higher time frames appears to be confirming. This correction is made all the more dramatic as the DXY corrects with Bitcoin. That is weak. The "Do not ignore!!" alarm strikes again.