
hossammetawee
@t_hossammetawee

What symbols does the trader recommend buying?
Purchase History
پیام های تریدر
Filter
hossammetawee
سقوط 5% طلا: هل انتهى الصعود الأسطوري؟ (تحليل مؤسسي عميق)
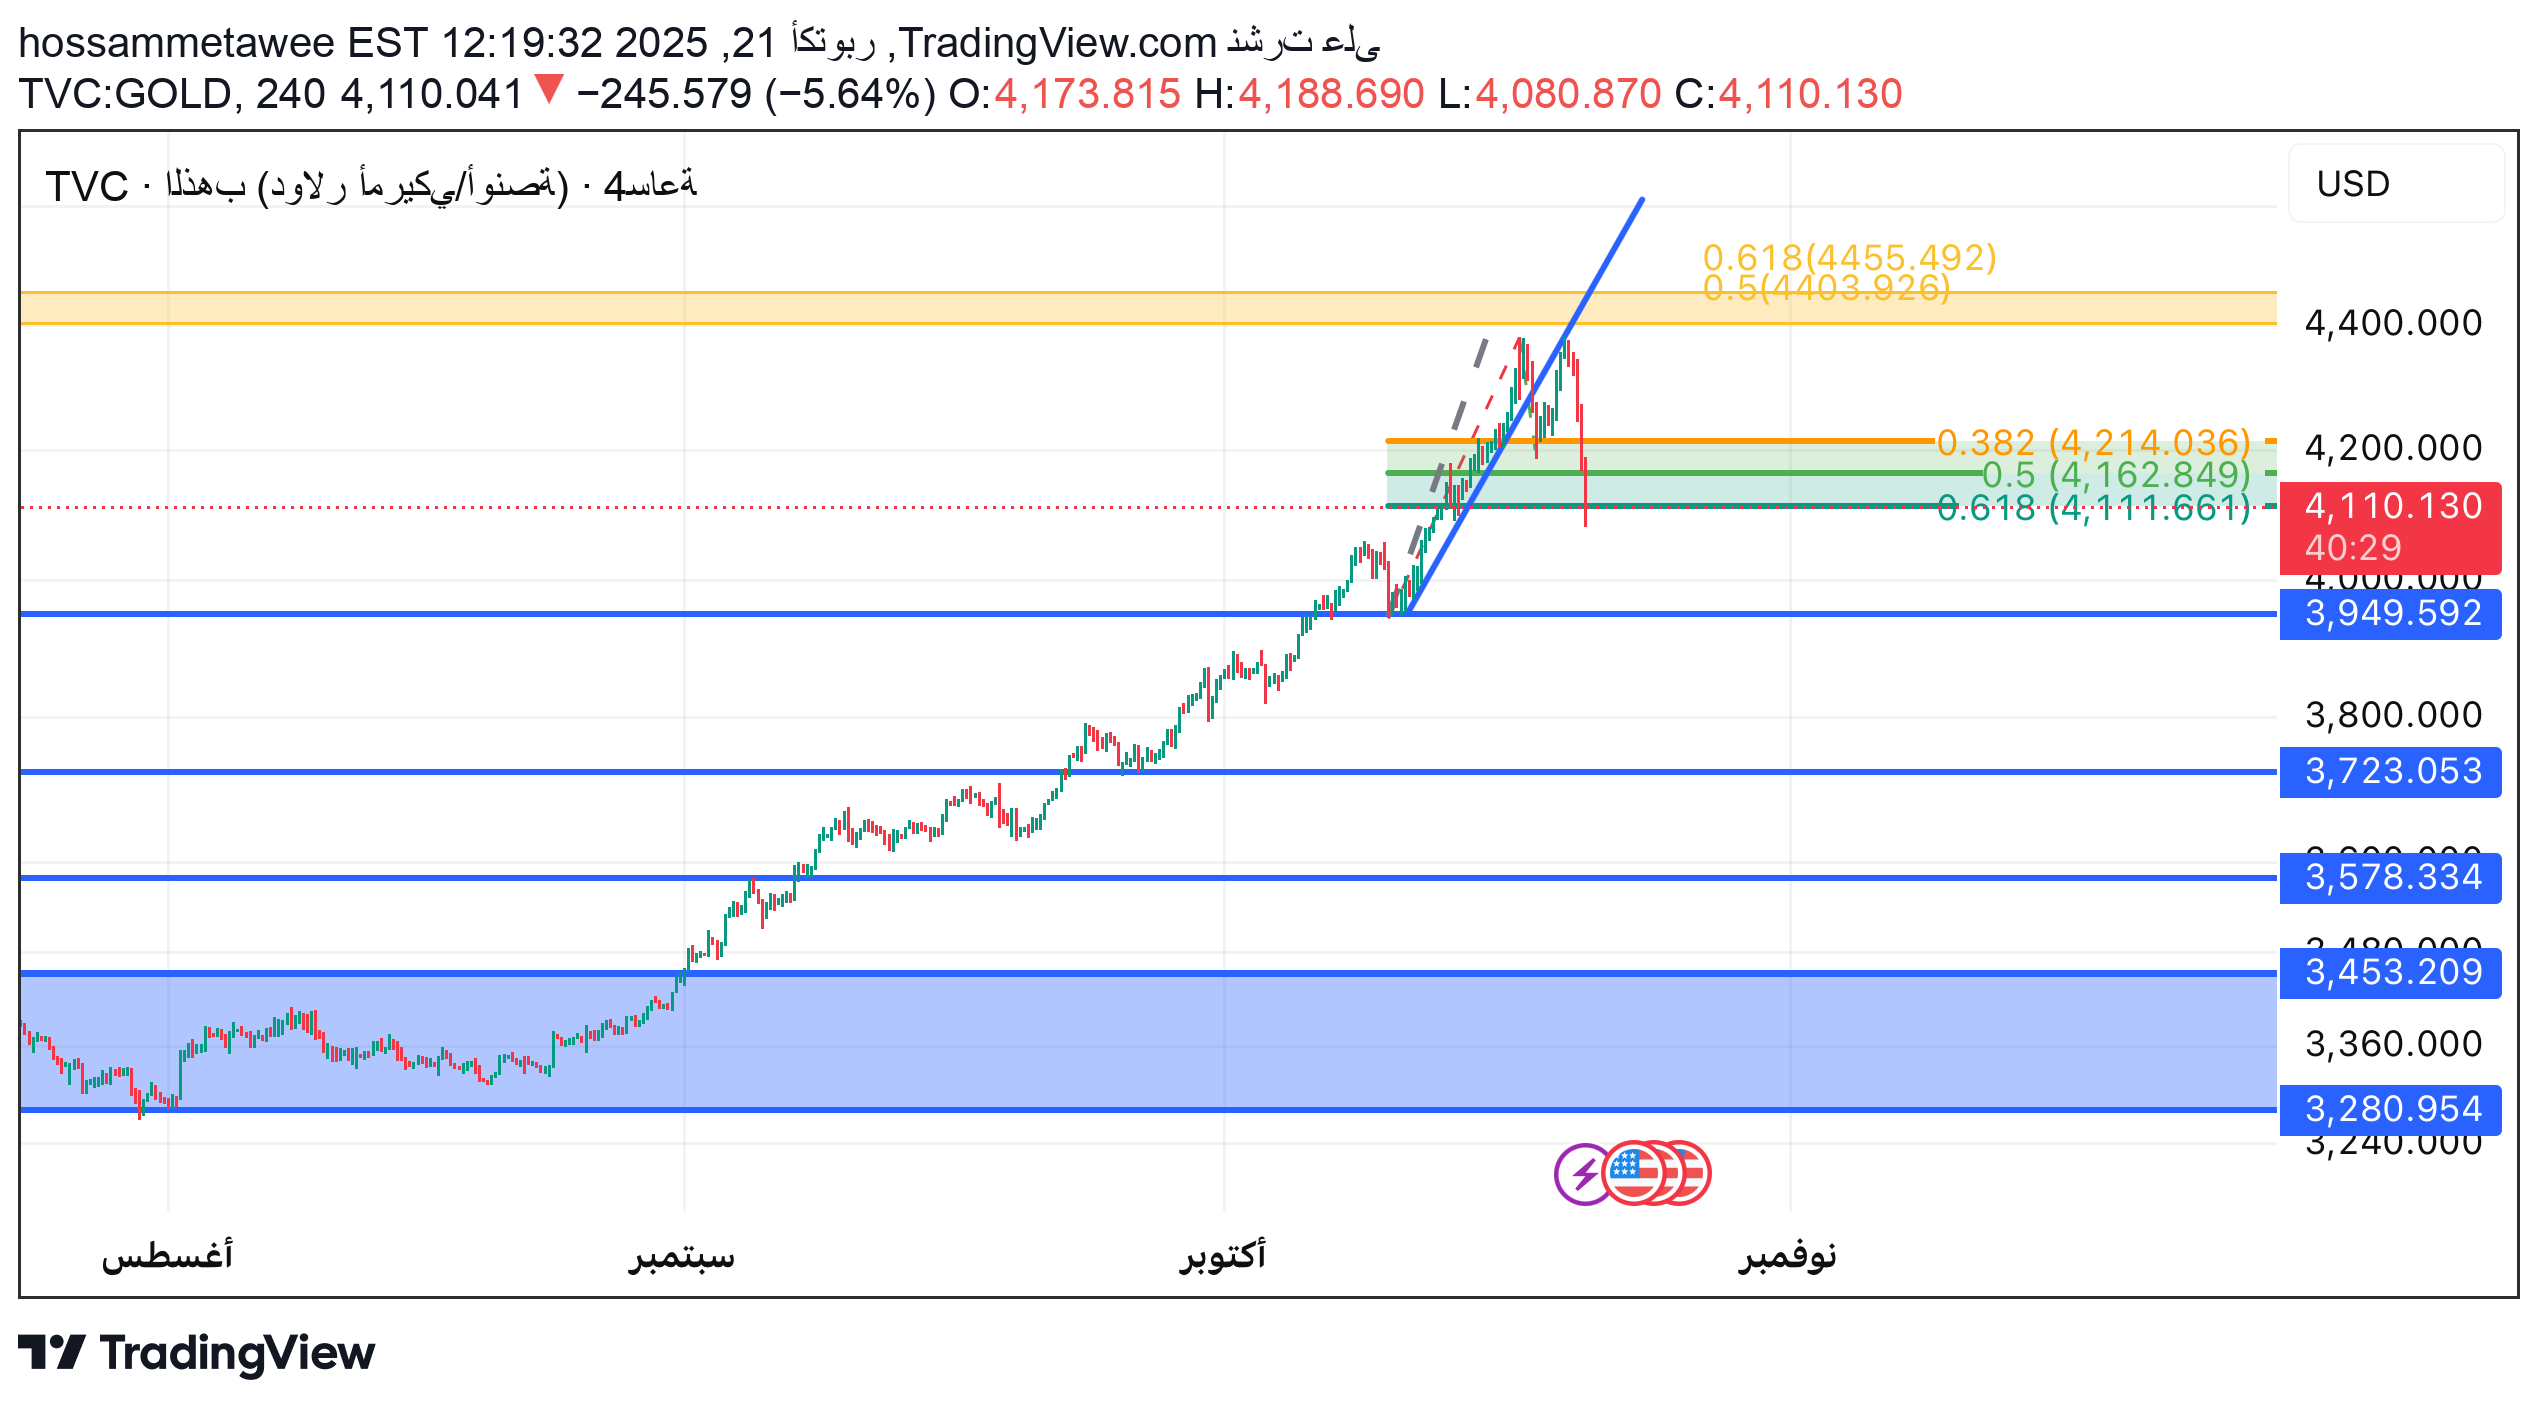
The 5% drop in gold within a session or two as we see it now is not just a passing number - it is an event with very strong connotations First: from a statistical and technical perspective •A 5% drop in gold is considered an unusual movement (Exception Move). •The average normal daily fluctuation of gold = 0.7% - 1.2% only. •So, a 5% drop means a huge institutional move (Institutional Liquidity Sweep) and not a normal correction from individual traders. ️ Second: From the perspective of the QLTS structural strategy 📉 What happened? •BOS was clearly broken on the 4-hour frame. •Huge buy-side liquidity sweep above $4,355, followed by a sharp selling rush. •The price moved directly to the Equilibrium Zone between 4,214 – 4,111. •This area is a re-distribution area and is not an immediate reversal. ⸻ 🔍 Third: Is it a trend change or a temporary correction? Gold is still in a structural upward trend, but the current decline represents an intermediate corrective wave (Wave 4) after a very strong overbought wave in the third wave. That is, it is a deep and strong correction (5%), but it is not a trend change unless it breaks $3,723-$3,580. Fourth: How to deal with him? 1Do not enter a direct purchase during a 5% collapse - the market is redistributing liquidity. 2Wait for absorption candles or a new bullish BOS from the 1H or 2H frame. 3Watch the area 3,949–3,723 because it is the activation area for the upcoming fifth ascending wave, God willing. 4If it breaks $3,580 with a daily candle, only then will we re-evaluate and consider that the trend has actually changed. ⸻ 🧭 Executive summary 🔸 The 5% decline in gold is a strong institutional correction within a larger uptrend. 🔸 The general structure has not changed yet, unless $3,580 is broken. 🔸 The closest possible area for the correction to end = $3,949 – $3,723. 🔸 After that, it is expected that a new upward wave (Wave 5) will begin, targeting the highs of $4,400+ again.
hossammetawee
الذهب GOLD | موجة صاعدة تستهدف 3815–3820 بعد اختراق 3760
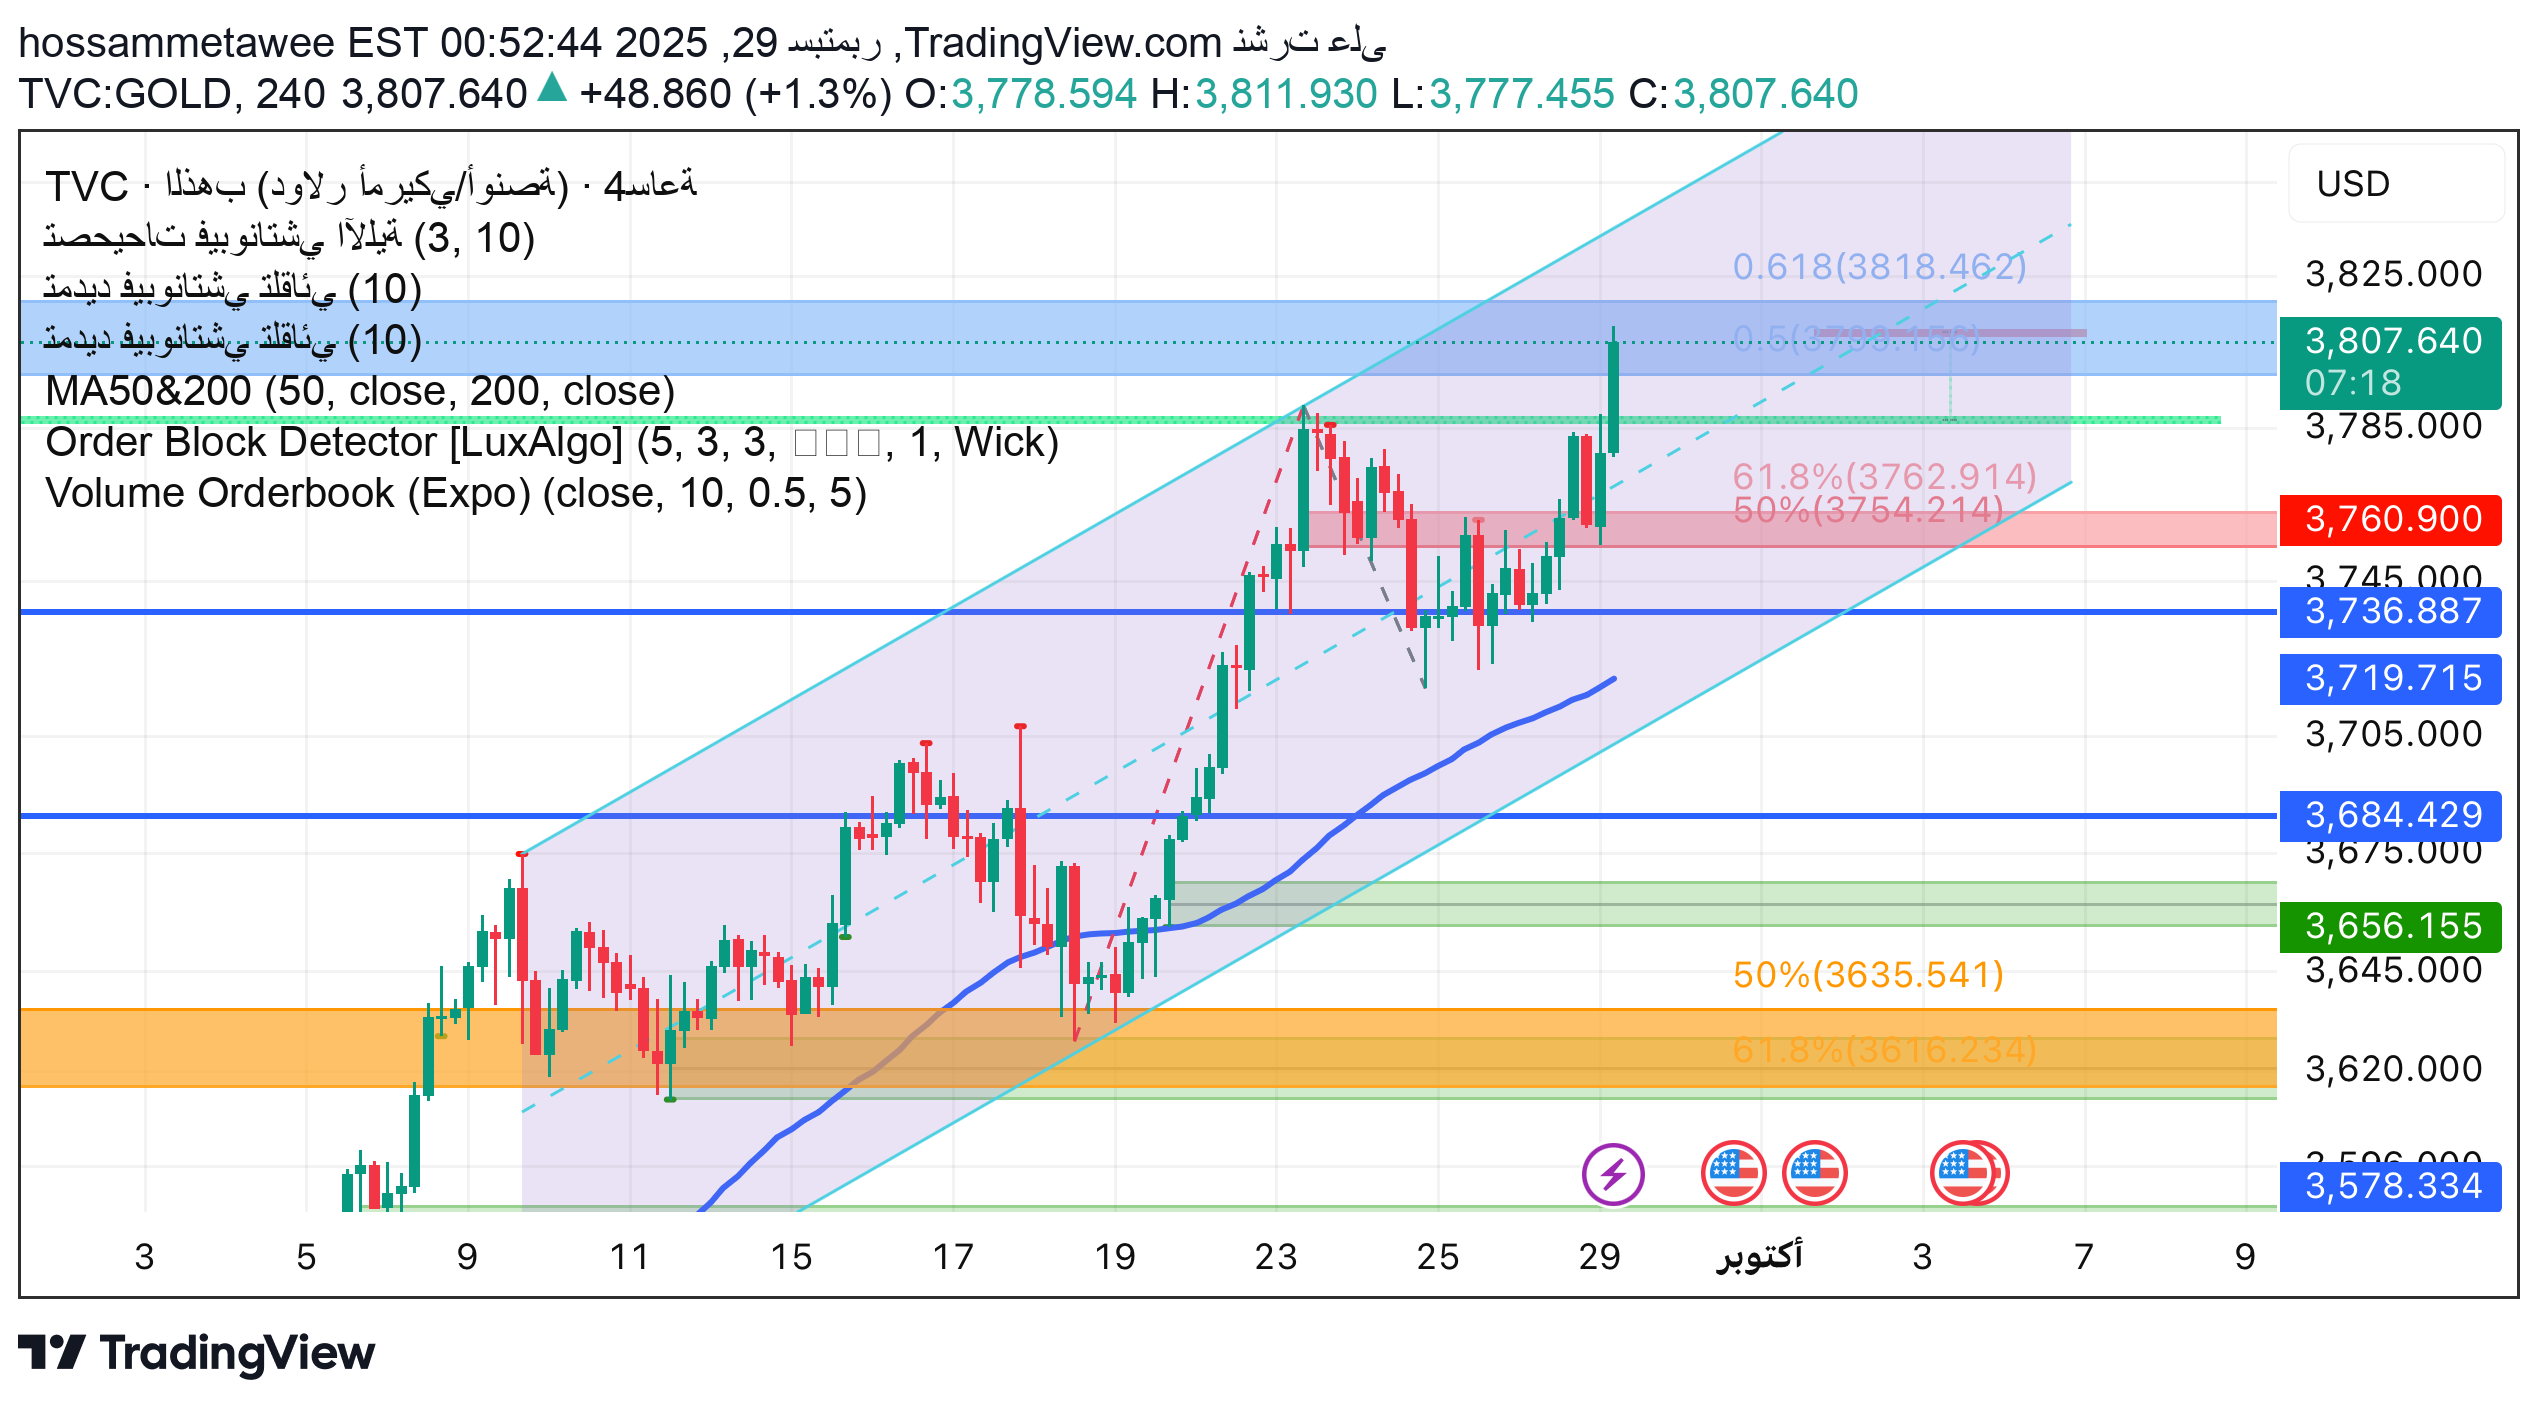
Momentum and feelings • RSI on 4H = ascending direction without strong saturation. • MFI confirms the flow of purchasing liquidity. • There is no clear Divergence yet. 1️⃣ Structural direction • The trend has been rising since the bottom of September. • 4H: a clear penetration of Premium 3760-3765 and heading towards a new top. • The current wave looks 3 extended. Gold in a 3 rising wave with 3804-3820 goals. • Buying from 3760-3765 regions after re -test is currently the best. • Breaking 3735 eliminates a short -term ascending scenario and confirms a deeper correction. 2️⃣ Liquidation map (Liquidity Maping) • BSL was targeted at 3760-3765 (former Weak High). • The next goal = 3815-3820 (area 0.618 Vobo + liquidity of the top of the summits). • SSL at 3736 and 3711. Scenarios 📈 Rising (weighted) scenario Entry: Purchase of Re -Test 3760-3765 (current support zone). SL: 3735 • TP1: 3804 • TP2: 3815-3820 • TP3 (extension): 3840 📉 The downward scenario (alternative) • Activation: Close 4H below 3735 • TP1: 3711 • TP2: 3684 • TP3: 3656
hossammetawee
التحليل الفني لعملة البيتكوين تصحيح قصير المدى وفرصة للشراء
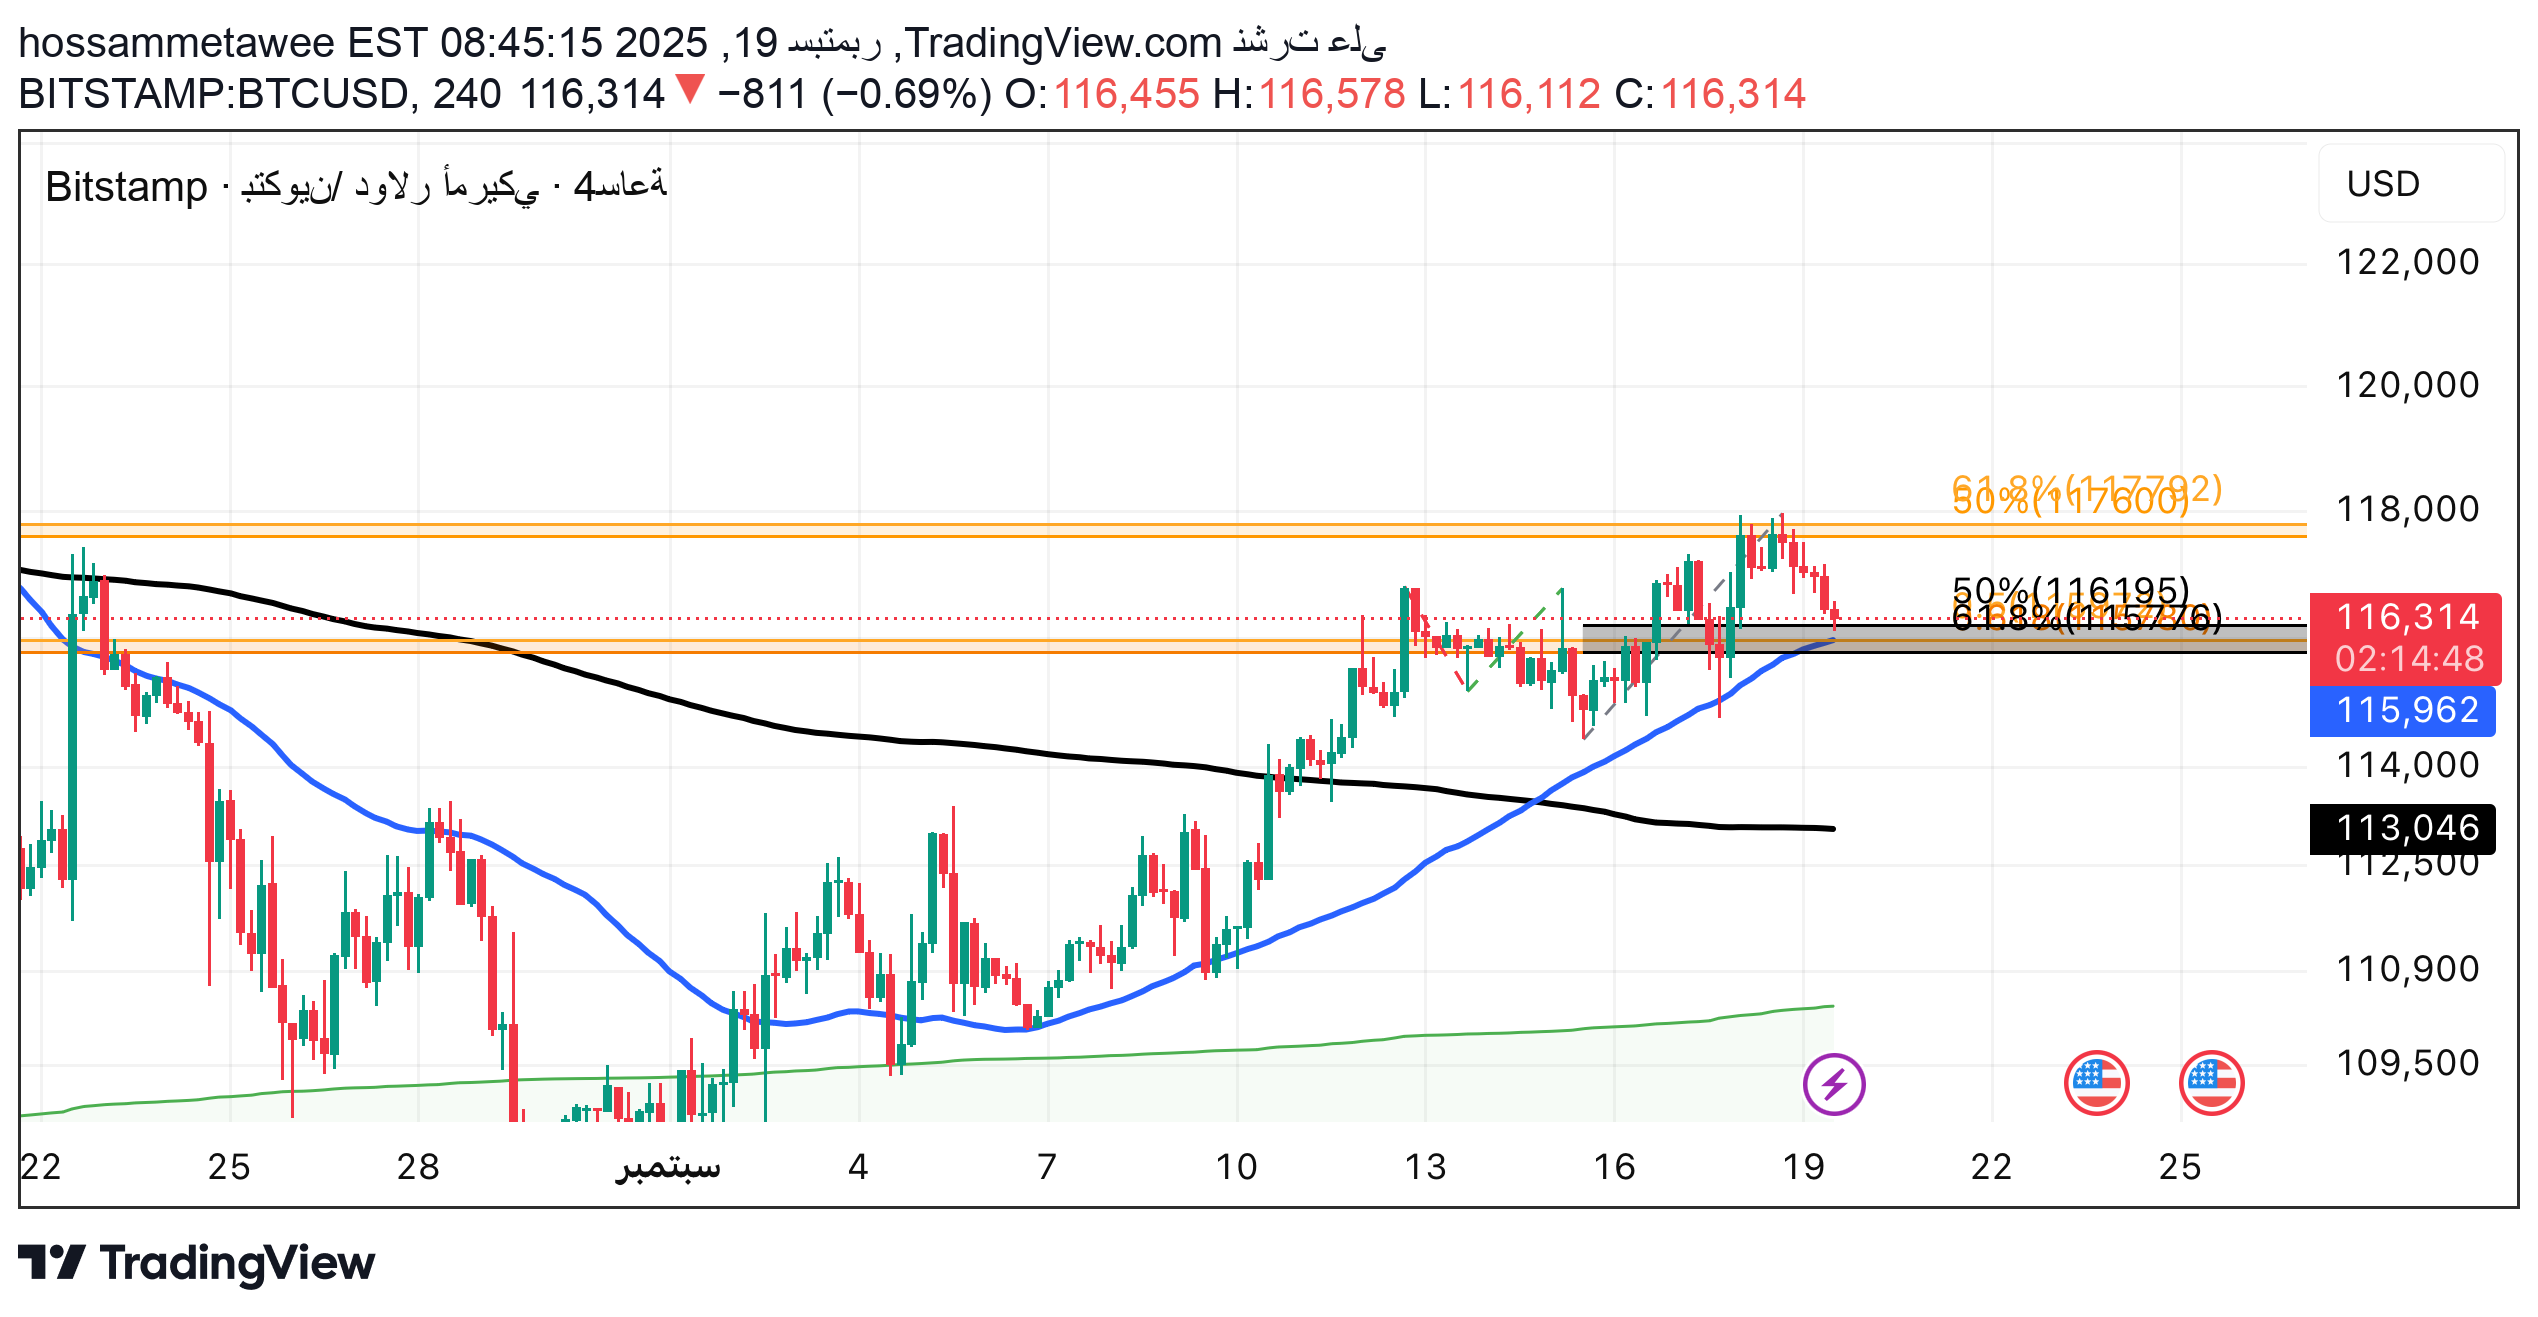
BTCUSD in a short -term correction phase of $ 115,800 - $ 114,700, which is an ideal purchase area to target $ 118,000 - $ 122,000 in the near term. Selling only if $ 114,500 is broken clear 1- Structural Trend • The weekly and daily Al -Farim is still in a medium -term ascending direction after penetrating the levels of $ 100,000, with the stability of the highest long -term averages. • On the small viruses (4H and 2 H) there is a short -term correction towards the liquidity areas of $ 115,800 - $ 114,700. 2- Internal Structure • A clear fracture of an upward sub -structure (BOS) on Freem 2H and 4 H. • The price is currently moving between 50% levels and 61.8% Vibonacci ($ 116,540 - $ 115,977). • Equilibrium is about $ 116,600. 3- Liquidity Structure • Strong liquidity areas below $ 115,900 - $ 114,700 (places to stop losses for buyers). • Clear purchasing liquidity above $ 117,600 - $ 118,000, which represents current resistance. • On the weekly Al -Farim: There is assembly liquidity near $ 122,000 - $ 124,500. 4- Multi-Timeframe Alignment (Multi-Timeframe Alignment) • BILISH BIAS. • 4H and 2 H: Corrective Bearish. 👉 Compatibility indicates a short -term drop to test liquidity, then resume the upward trend. 5- Technical Confluence • Strong resistance at $ 117,600 - $ 118,200 (Weak High + Volume Profile). • Main support at $ 115,800 - $ 114,700 (FVG + PDL + 61.8%). • The moving average 200 days supports buyers at $ 114,500. 6- Momentum & Sentiment • A negative short -term momentum (RSI on 4H retreats from the purchasing saturation areas). • The market feelings tend to be seized due to a clear breaking of $ 118,000 or a drop to test $ 114,500. 7- Dual Scenario 🔹 Al -Swario Al -Swami (favorite after the correction): • First drop to test $ 115,800 - $ 114,700. • Then an emerging bounce targets $ 118,000 - $ 122,000. 🔹 Detal scenario (if $ 114,500 is broken clearly): • The landing continues about $ 112,950 - $ 113,500. • If $ 112,000 is broken, the correction may extend to $ 106,000. 8- Trigger Conditions • Purchase only after confirming a strong reflexive reflex reversion from $ 115,800 - $ 114,700. • Selling short -term only if the price is closed under $ 114,500 with confirmation of trading volume. 9- Trend model • Buying (Main Wishing): • Entry: $ 115,800 - $ 114,700. • Stop loss: $ 113,900. • Goals: $ 118,000 - $ 122,000 - $ 124,500. • Selling (secondary scenario): • Entry: Close under $ 114,500. • Stopping loss: $ 116,000. • Goals: $ 113,000 - $ 111,000. 10- Risk Management The maximum risk: 1.5% of the capital. Divide contracts by 3 goals (TP1/TP2/TP3). • Using a trilling stop after achieving 50% of the first goal. 11- Last Candle Analysis • On Freem 4H: a lower luxurious candle with a long upper shade → confirmation of sale pressure at $ 117,200. • On Freem 2H: The current candles are moving within the support range of $ 116,600, which is more likely to drop $ 115,800
hossammetawee
سولانااختبار السيولة عند 244$ بين مقاومة ضعيفة ودعم فيبوناتشي
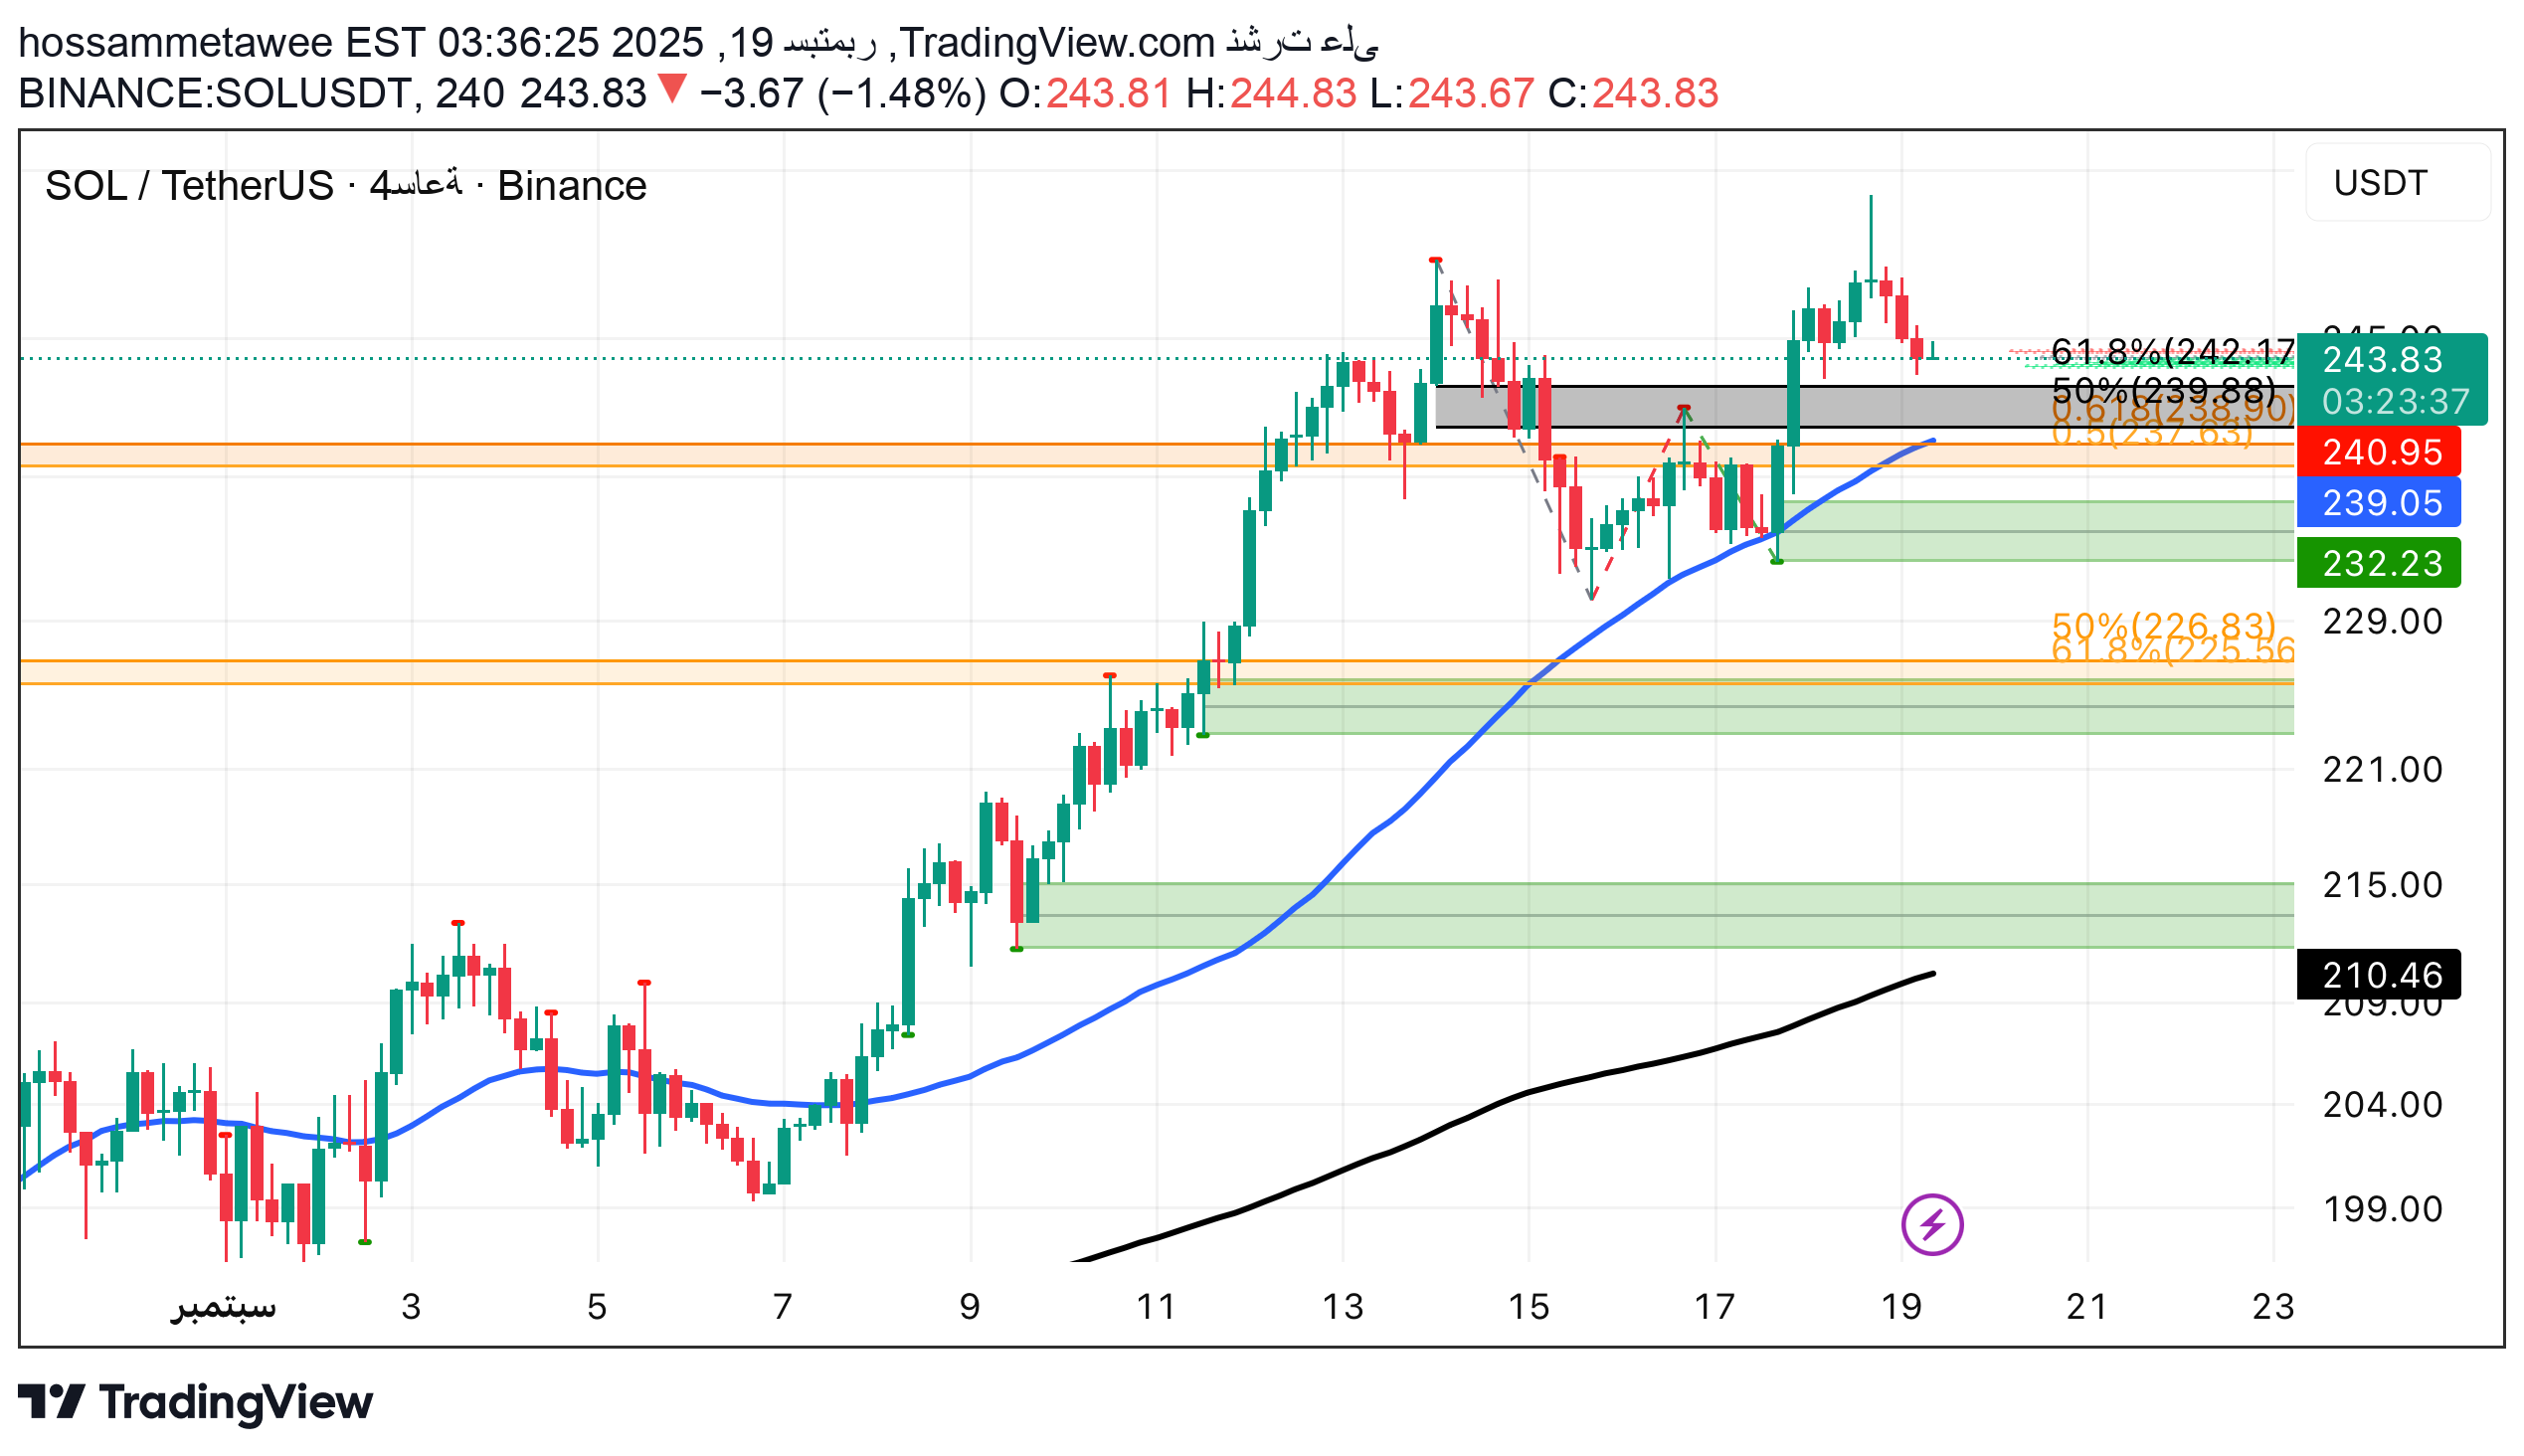
< ✅ Structure: • The general trend is still in the medium term after forming upscale peaks and bottoms. • But the current movement shows a short -term descending correction. ✅ The internal structure (Internal Structure): • The price is now trading at a possible bouncing area near 61.8% Vibonacci (242.17) - a strong support area. • Soon, we find support at 239.80 - 238.90 represents a purchasing liquidity area. Liquidation & SMC: • Assembling clear liquidity below 240, indicating the possibility of a false fracture trap and then climb. • The presence of a display area near 247-250 may represent the first resistance barrier in front of any apostasy. ✅ Confluences: • Fibonacci support 61.8% + a previous request area. • Moving average 50 supports the price from below. ⸻ 📌 Basic scenario (corrective purchase): • Entry area: 242 - 239 • Stop loss: Close 4 hours below 237 • Goals: • TP1 = 247 • Tp2 = 252 • Tp3 = 263 📌 Alternative scenario (extended landing): • If the price is broken 237 steadily → The landing may extend to 226-225 (a strong demand area + 61.8% daily). ⸻ ⚖️ risk management: The maximum risk does not exceed 1 - 1.5% of the capital. Divide contracts between 242 and 239 with a gradual targeting
hossammetawee
التحليل الفني للإيثريوم ETHUSDT – صراع حاسم عند مستويات فيبوناتش
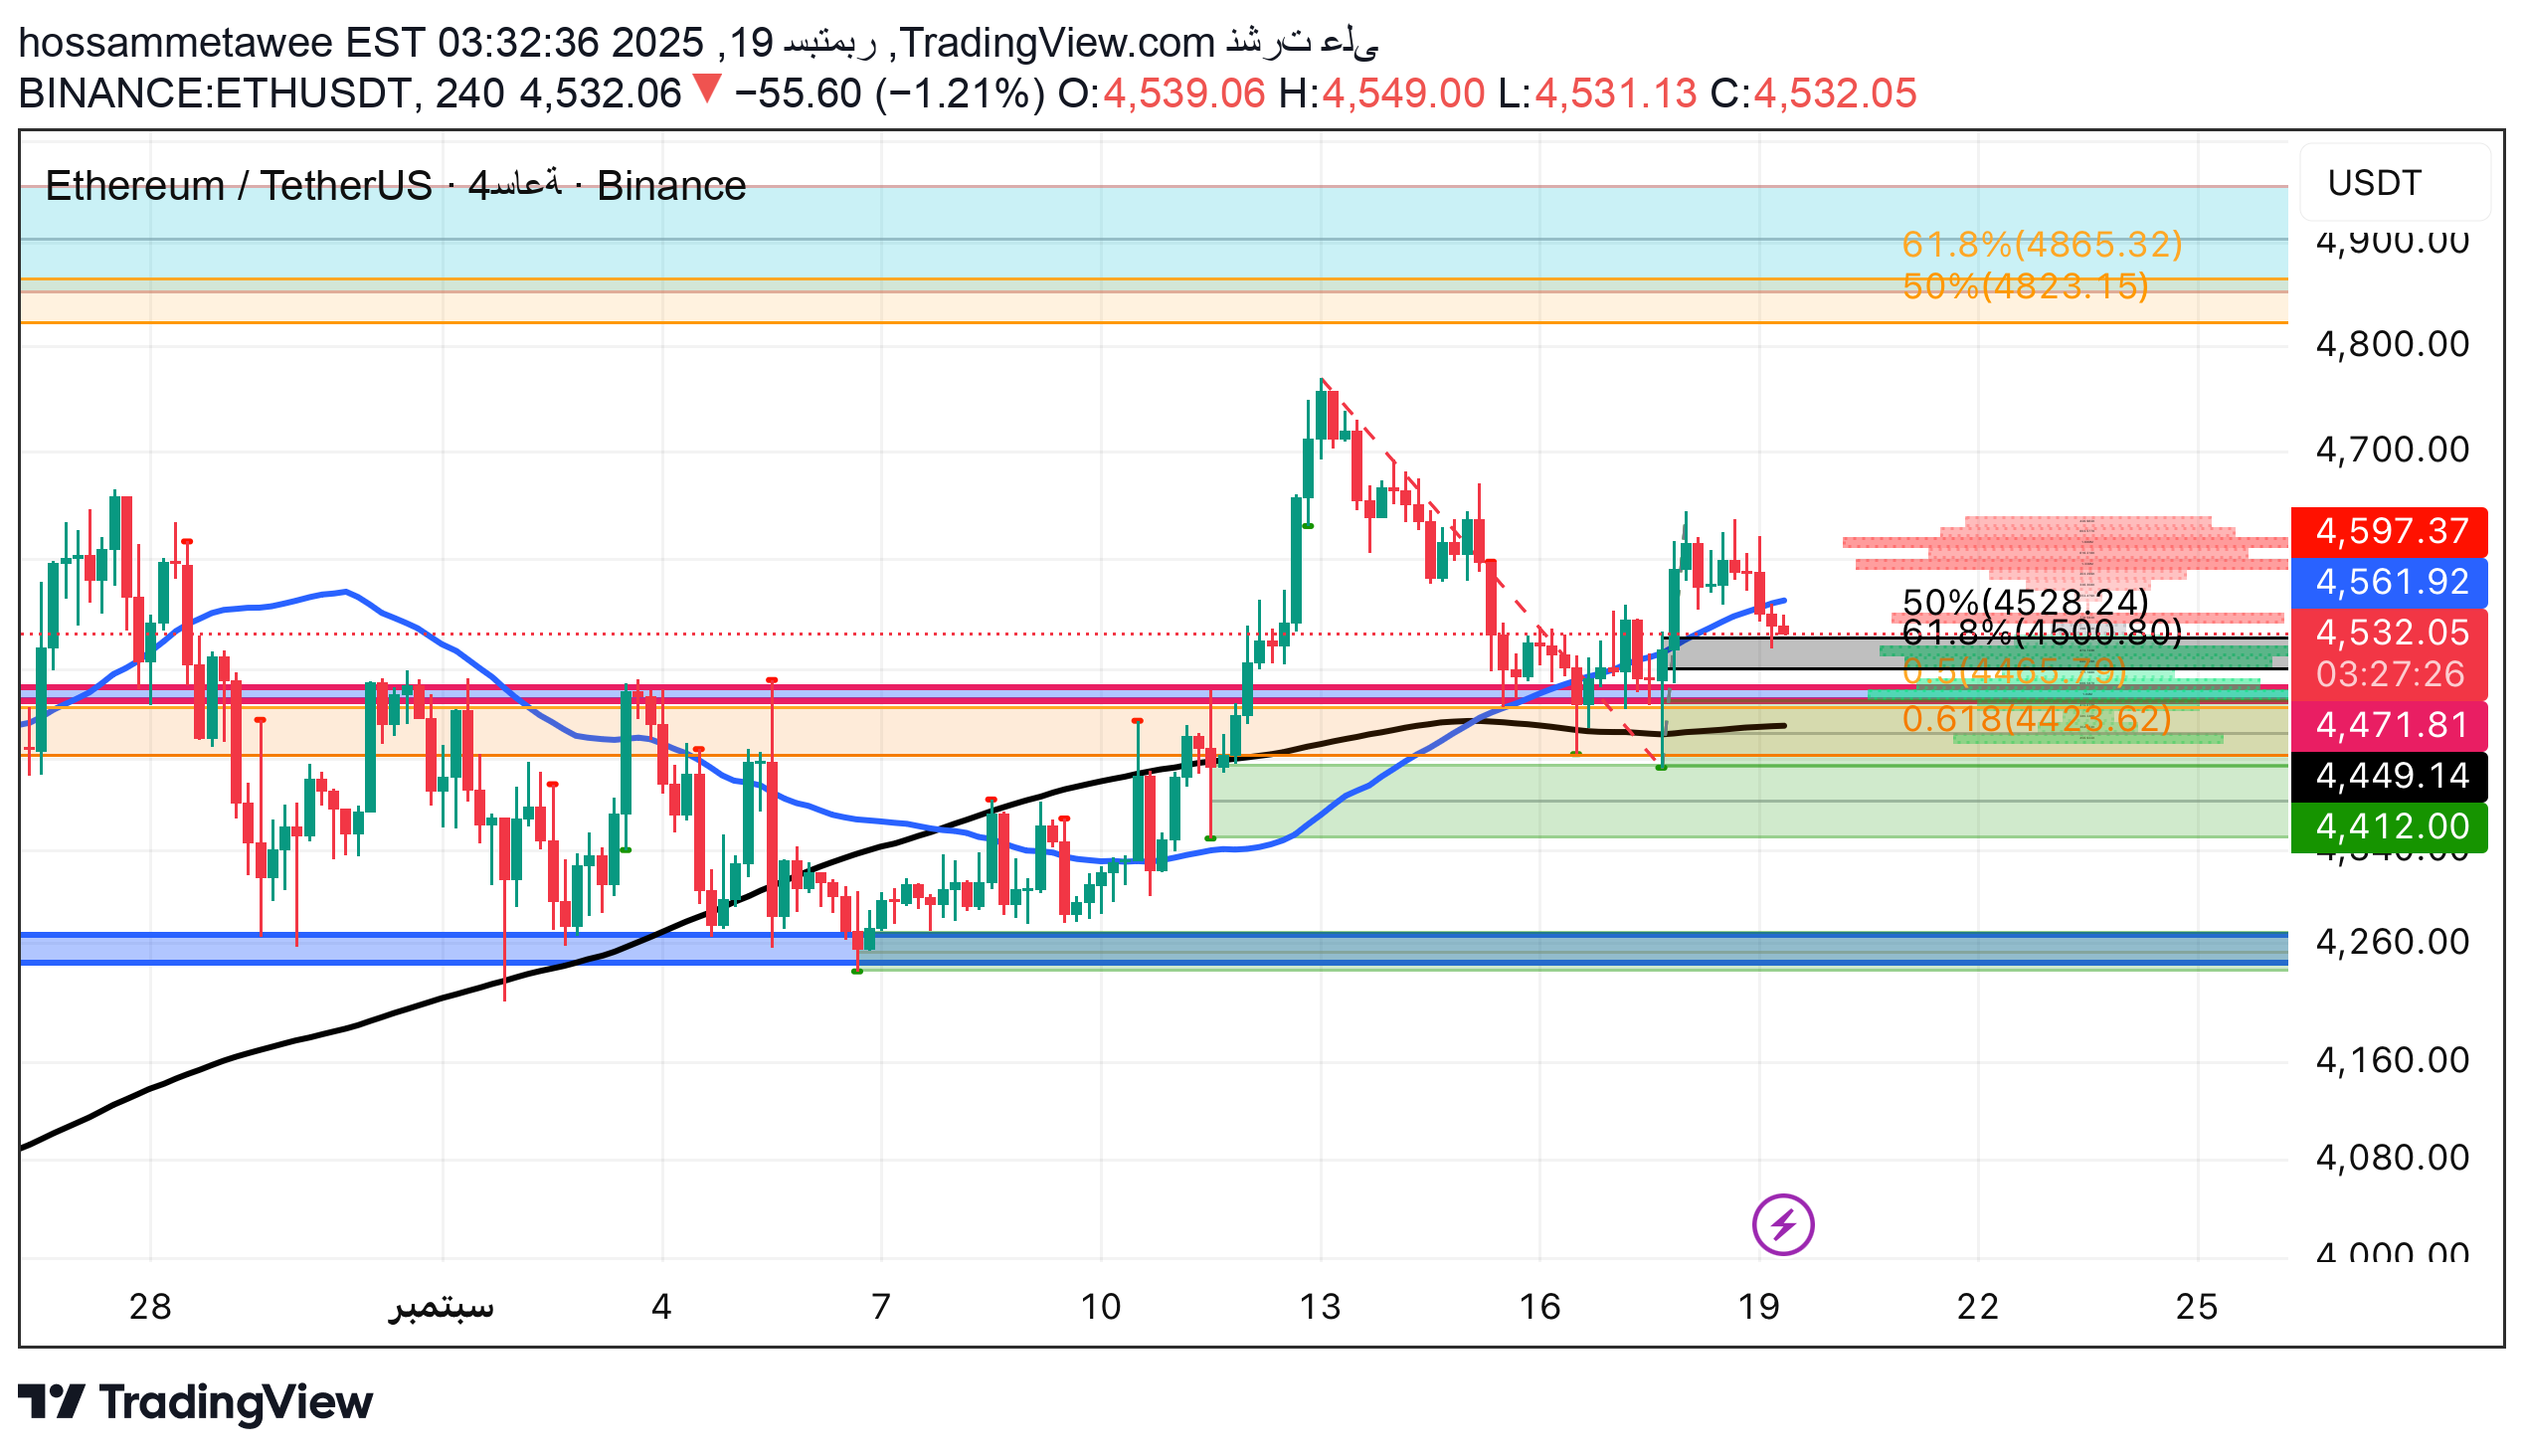
Ethusdt | Selling pressure at $ 4540 with $ 4500 -4420 regions as a decisive liquidity barrier ⸻ Etherium trades at a pivotal support level (4500 - 4528). Unless it is broken, the rising scenario remains about 4590 - 4650 is more likely, while the descending fracture will lead to a re -test 4440 and 4320 📊 According to the developed Qlts strategy ✅ Structure: • The average frame (4 hours - daily) is still in an upward direction after the formation of tops and tops. • The current movement represents a short -term descending correction after rejection of the resistance 4650 - 4700. ✅ The internal structure (Internal Structure): • The price is now trading near a 50% - 61.8% Vibonacci (4528 - 4500), which represents a pivotal support area. • Breaking this region to a decline that may open the way for a test of 4440 - 4420. Liquidity: • There is a purchasing liquidity collection below 4,500, which may push the institutions to hunt orders to stop the loss and then re -ascend. Supply at 4590 - 4650 constitutes the first resistance barrier in front of any bounce. ✅ Confluence: • Fibonacci support + previous request area. • The average 200 moves below the price at 4400 - supportive as a strong defensive area. ⸻ 📌 The main scenario (ascension from support areas): • Entry area: 4528 - 4500 • Stop loss: Close 4 hours below 4440 • Goals: • TP1 = 4590 • Tp2 = 4650 • Tp3 = 4720 📌 Alternative scenario (extended landing): • If the price is broken 4440 → The next goal will be 4320 - 4250 (daily request zone). ⸻ ⚖️ risk management: • It is preferable to divide the contracts between 4520 and 4500. • The risk rate does not exceed 1.5% of the capital
hossammetawee
الإيثريوم أمام مفترق هيكلي حاسم: صعود مؤسسي أم مصيدة تصريف

🔍 First: The general structural trend (1W - 1D - 4H) ✅ Al -Month Twice main support at 2167-2230 (OB + EQZ) • BOS is registered with a strong momentum • The price is currently interacting with the weekly Equilibrium region (± 2590) ✅ Daily (1D): • A clear rising structural fracture, with a series of Choch> BOS> FVG Fil 2660), with a test of OB targets for drainage 🧬 Second: the internal structure (4H - 1H - 15m) • ✅ Freem 4H: • Rising BOS registration + successful re -test OB • clear purchasing pressure areas from FVG at 2450 and 2430 • RSI shows the beginning of a positive breakthrough • ✅ Freim 1H: • Forms the “Double Foot” Form at 2457 • EQH at 2590 represents a sensitive resistance • ✅ 15m (for activation only): • We are witnessing a purchasing pressure on the areas of Liquidity Sweep + FVG Third: Liquidity Temple • 🔵 BBS formerly broken at 2330 • 🔴 SSL is like 2430 • 🟠 FVG open between 2468 - 2500 (currently penetrated) • 🟢 🟢 🟢 🟢 🟢 🟢 🟢 🟢 🟢 + + Vacuum OB is very close to the current price • ⚠️ Manipulation is a candlestick on Freem 4H - (False Fracture Candle) • 🔻 EQH Main: at 2660 - 2680⏳ Fourth: Frequent chronology compatibility 15m (momentum or fake fracture) 📊 Fifth: technical compatibility (Jean - Elliot - Fibonacci) • Jean: The price revolves near an angle of 180 ° on the weekly fibonacci: the price exceeded 0.618 of the descending wave (3068 - 2167) • Elliott waves: we are currently dealing with a sub -driving wave inside the correction of a compound Sixth: momentum and feelings (RSI - OBV - MFI) • RSI on 4H penetrates a decreased resistance line = bullish stimulation • MFI indicates the restoration of purchasing liquidity flow Candle of momentum on 1H • Goals: • TP1: 2660 • TP2: 2746 • TP3: 2860 • SL: Break 2470 with a candle closing 4H🔴 negative scenario (structural drain Summary and professional recommendation 🔹 Ethereum is to rebuild momentum from Discount regions and currently interacts with OB Daily sensitive. 2615 penetration with real momentum candle = a new wave launch about 2746-2860🔹 warned at 2660: the possibility of an existing institutional drainage
hossammetawee
الذهب يواجه مقاومة سيولة حرجة قرب منطقة Premium – هل نشهد انفجار

طلا با مقاومت نقدینگی حیاتی در نزدیکی منطقه Premium روبرو است – آیا شاهد انفجار قیمتی بود یا اصلاح زمانی؟ تحلیل طلا در برابر دلار (XAUUSD) با استفاده از استراتژی QLTS توسعه یافته – نسخه 4.1 تاریخ: 5 ژوئن 2025 چارچوب زمانی اصلی: 4H – 2H – 1D ✅ 1. روند ساختاری کلی (Daily – H4): •روند کلی: از زمان شکست ناحیه عرضه قبلی بالاتر از 3320، از نظر ساختاری صعودی است. •ساختار فعلی بازار BOS واضحی را در نمودار روزانه نشان می دهد (شکست قله قبلی 3360). •این جفت ارز در داخل منطقه Premium بین 0.5 و 0.618 فیبوناچی موج نزولی قبلی (3407–3320) حرکت می کند که یک منطقه حساس برای نظارت است. ✅ 2. ساختار داخلی (ساختار فراکتال – 4H – 2H): •در تایم فریم 4 ساعته، پس از صعود قوی از منطقه تقاضا 3290–3300، BOS محقق شده است. •یک پایه پشتیبانی پویا از میانگین متحرک 200 (EMA) وجود دارد. •کندل های حرکتی قوی، مومنتوم خرید و رد فروش مکرر از منطقه 3330–3340 را نشان می دهد. ✅ 3. ساختار نقدینگی (Liquidity Mapping): •BSL بالاتر از سطح 3360 شکسته شده است ← پاکسازی نقدینگی واضح است. •وجود FVG بسته نشده بین 3340 و 3355 ← احتمال تست مجدد آن وجود دارد. •منطقه OB صعودی در 3330 – آزمایش شده و به شدت با آن واکنش نشان داده شده است. •بالاترین قیمت، Weak High در 3407 قرار دارد ← ممکن است برای استخراج نقدینگی بیشتر مورد هدف قرار گیرد. •PWL در 3290 نشان دهنده آخرین نقطه ضعف ساختاری در تایم فریم های متوسط است. ✅ 4. توافق تایم فریم ها: •Daily + 4H + 2H همگی در یک روند صعودی و از نظر زمانی سازگار هستند. •تایم فریم مسلط: 4H با ساختار واضح با BOS مستقر و OB قوی فعال. ✅ 5. توافق فنی (فیبوناچی – گان): •فیبوناچی هارمونیک به PRZ بین 3400 – 3410 (0.618 از موج نزولی) اشاره دارد. •یک کانال قیمتی صعودی در 2H مرزهای انعطاف پذیری را برای حرکت در داخل آن نشان می دهد. •زاویه قیمت زمانی فعلی به منطقه 90 درجه از آخرین چرخه نزدیک می شود – منطقه نظارت بر معکوس شدن. ✅ 6. مومنتوم و احساسات: •RSI از سطح 60 فراتر می رود بدون اشباع شدن ← مومنتوم خرید فعال. •MFI در سطوح بالا با جریان های مثبت. •تاکنون هیچ الگوی Anti-Climax وجود ندارد، اما ضعف مومنتوم در نزدیکی 3400 باید به دقت مورد نظارت قرار گیرد. 🔁 سناریوی دوگانه (صعود + نزول) 🔹 سناریوی صعودی – به سمت 3410 سپس 3450: •فعالسازی: بسته شدن 4H بالای 3365 + کندل حرکتی واضح (Engulfing یا Rejection) •هدف 1: 3407 (Weak High) •هدف 2: 3450 – گسترش نقدینگی •حد ضرر: زیر 3330 (OB + FVG غیرفعال) 🔸 سناریوی نزولی – اصلاح تا 3320: •فعالسازی: شکست جعلی بالای 3365 سپس کندل معکوس (Shift Candle) •هدف 1: 3330 – منطقه حمایت / OB •هدف 2: 3290 – نقطه ضعف ساختاری (PWL) •حد ضرر: بالای 3375 📌 نوع معامله: Swing 📊 مدیریت معامله: •BE هوشمند بعد از رسیدن به TP1 •Partial TP در دو مرحله: 3407 – 3450 •Trailing SL ساختاری بعد از عبور از 3410 📣 توجه 🚨 طلا در نزدیکی یک منطقه حساس (Premium Zone) تحت مقاومت قوی بین 3360 و 3407 حرکت می کند. ⚔️ بدون فعال شدن سناریوی واضح وارد نشوید – رفتار قیمت را در نزدیکی قله های فعلی به دقت زیر نظر داشته باشید. 💡 توصیه فقط برای حرفه ای ها – سیگنال های نقدینگی و مومنتوم را نادیده نگیرید.
hossammetawee
البيتكوين بين فكي السيولة الشهرية والضغط الهيكلي – فرصة إحترافية

🔍 Professional analysis updated Bitcoin Bitcusd - Using QLTS strategy version 4.1📅 Date: Wednesday 5 June 2025⸻✅ First: The general structural trend (Monthly - Daily - 4H) 🔸 Monthly 1M: • Price in Premium after a violent rise from the Discount area. (104324-11377). 4H: • The chosch formation is a short -term Choch formation with stability under PDH. On 1H. Basic confirmation. • PWL at 103.7K is very important in the next scenario. (113.7k). QLTS MODEL 🟥 Favorite sale scenario: • Activation after failure to exceed the 105k -106K region. Alternative purchase scenario (currently weak): • Activation only with a clear penetration of the level of 108.6K with a momentum candle. • The first goal: 112k Drawing + smart management via Break Even and Partial TP📛 It is forbidden to enter before confirming the structure + a clear momentum below 103.7K
hossammetawee
تحليل احترافي للبيتكوين BTCUSD | هل نشهد انطلاقة نحو 114,000؟

فرصت طلایی برای بیت کوین؟ تحلیل QLTS رازهای حرکت بعدی را فاش میکند: 1. روند ساختاری کلی (هفتگی – روزانه – H4): •روند ساختاری کلی: صعودی •تایم فریم هفتگی: ادامه ساختار صعودی با BOS (شکست ساختار) واضح در بالای 96,000. •قیمت در حال حاضر در منطقه Premium (بالای 0.5 فیبوناچی) قرار دارد و به سطح 0.5 فیبوناچی در 104,324 نزدیک میشود. •یک Weak High (سقف ضعیف) در نزدیکی 112,000 وجود دارد که به عنوان هدف احتمالی در نظر گرفته میشود. 2. ساختار داخلی (H4 – H1 – 2H): •در تایم فریم چهار ساعته: •قیمت یک CHoCH (تغییر در شخصیت) صعودی با شکست واضح یک قله داخلی ایجاد کرده است. •یک منطقه حمایت داخلی مهم در 107,200 – 108,300 (OB + FVG) وجود دارد. •قیمت پس از صعود شدید در حال Consolidation (تثبیت) است و احتمالاً شاهد یک retracement (اصلاح) محدود به سمت منطقه حمایت هوشمند بود. 3. ساختار نقدینگی (Liquidity Mapping): •BSL (نقدینگی سمت خرید) بالای 109,900 شکسته شده است، که احتمال ورود به یک اصلاح موقت را تقویت میکند. •OB (بلاک سفارش) قوی بین 107,200 و 108,300 با Fair Value Gap (FVG) ادغام شده است. •EQH (سقفهای برابر) در 110,200 هدف قرار گرفتهاند اما به شدت شکسته نشدهاند، که نشاندهنده ضعف در مومنتوم (تکانه) لحظهای است. •Weak High (سقف ضعیف) در 112,768 یک هدف نقدینگی بالقوه را تشکیل میدهد. 4. همگرایی تایم فریم (Timeframe Confluence): •تایم فریمهای هفتگی، روزانه و چهار ساعته همگی در یک روند صعودی همسو هستند. •تایم فریم غالب، 4 ساعته است، زیرا دارای ساختار داخلی مفصل و کنترل زمانی در اصلاح و مومنتوم است. 5. همگرایی فنی (فیبوناچی + گان + امواج الیوت): •قیمت قبلاً از 61.8% فیبوناچی برگشته است و اکنون به 0.5 – 0.618 برای امتداد دوم (112,768 – 111,600) نزدیک میشود. •از نظر موجی، ما در موج سوم صعودی یک چرخه انگیزشی هستیم که از کف 88,000 شروع شده است. 6. مومنتوم و احساسات (Momentum): •RSI (شاخص قدرت نسبی) اشباع خرید جزئی را بدون تأیید معکوس نشان میدهد. •هیچ کندل Climax (اوج) شدیدی وجود ندارد، که نشاندهنده ادامه احتمالی صعود پس از اصلاح محدود است. •OBV (حجم در تعادل) و MFI (شاخص جریان پول) از مومنتوم صعودی کلی حمایت میکنند. ⸻سناریو دوگانه – بر اساس مدل سیگنال QLTS سناریو اول: ادامه صعود (سناریو محتمل): •شرایط فعالسازی: •حفظ حمایت 108,200 – 107,200. •کندل Rejection (رد) یا Engulfing (پوششی) صعودی از FVG. •همگرایی زمانی/قیمتی در OB + FVG. •اهداف: •TP1 = 110,950 •TP2 = 112,000 (Weak High) •TP3 = 114,000 •حد ضرر: شکست ساختاری زیر 106,200 با کندل مومنتوم. ⸻سناریو دوم: اصلاح نزولی موقت •شرایط فعالسازی: •شکست 107,000 با کندل قوی و مومنتوم منفی. •عدم موفقیت در بازآزمایی OB در بالا. •اهداف: •TP1 = 105,200 •TP2 = 101,700 (OB + 61.8%) •حد ضرر: بازگشت قیمت بالای 110,200 با شکست واضح. ⸻مدل معامله QLTS (در صورت فعال شدن صعودی) •Entry (ورود): از 107,800 – 108,200 •SL (حد ضرر): زیر 106,200 •TPs (اهداف سود): 110,950 – 112,000 – 114,000 •نوع معامله: Swing Trade (بر اساس تایم فریم غالب)
hossammetawee
“ETHUSD تحت المجهر | هل يخترق الإيثريوم القمة أم يبدأ التصحيح؟

تحلیل جامع و تخصصی اتریوم | بررسی دقیق ساختاری و مومنتوم برای آمادهسازی جهت شکست استراتژیک یا اصلاح بنیادی؟ ۱. گرایش ساختاری کلی (Structure Bias): • تایمفریم هفتگی (1W): • روند صعودی ساختاری پس از تایید BOS در ۲۴۶۰ و حرکت قیمت به سمت نواحی پریمیوم. • قیمت در حال حاضر بالاتر از میانگینها حرکت میکند، با شکست ناحیه مقاومت تاریخی در ۲۶۰۰–۲۶۵۰. • موقعیت قیمتی: در محدوده پریمیوم، نزدیک به مقاومت قوی در ۰.۶۱۸ (۳۴۸۷.۵۶). • تایمفریم روزانه (1D): • روند صعودی واضح، قیمت پس از شکست ۲۵۰۰، BOS قوی ایجاد کرده و CHoCH صعودی را محقق کرده است. • قیمت در حال معامله در محدوده رنج بعد از موج صعودی قوی، با بازآزمایی ناحیه FVG بین ۲۶۱۰ و ۲۶۴۴. ⸻ ۲. ساختار داخلی (Fractal Structure): • 4H: • شکست ساختاری صعودی پس از CHoCH نزولی موقت رخ داده است، که نشاندهنده احتمال ادامه صعود پس از تعادل مجدد است. • یک کندل مومنتوم Engulfing صعودی از ناحیه تقاضای قوی در ۲۵۳۰ شکل گرفته است. • 2H: • شکست واضح کانال رنج، و تمرکز قیمت بالای ناحیه OB محرک با کندل تایید. ⸻ ۳. ساختار نقدینگی (Liquidity Mapping): • BSL (نقدینگی سمت خرید): بالاتر از ۲۶۴۴ تصفیه شده است و اکنون یک ناحیه Liquidity Void است. • SSL (نقدینگی سمت فروش): هنوز زیر ۲۴۵۷ و ۲۴۰۰ وجود دارد. • OB محرک: بین ۲۵۲۰ و ۲۵۷۰ • FVG: بین ۲۶۰۷ و ۲۶۴۴ (به طور جزئی پر شده است). • EQH اخیر: ۲۶۵۰ (Weak High کاندید برای شکست). • Manipulation Candle: در تایم فریم 4H ظاهر شده و به وضوح بازآزمایی شده است. ⸻ ۴. تجمیع تایمفریمها (Timeframe Confluence): • تایمفریم مسلط: روزانه • توافق زمانی و ساختاری بین: 1W + 1D + 4H → همه از صعود حمایت میکنند به شرط ثبات بالای ۲۵۷۰. ⸻ ۵. تطابق فنی (Gann – Elliott – Fibonacci): • فیبوناچی: بازگشت دقیق از سطح ۰.۶۱۸ در ۲۴۸۸ و رد شدن در ۰.۵ = ۲۶۱۷. • موج انگیزشی: ما در آستانه تکمیل موج ۳ یا شروع ۵ هستیم (Elliott). • زاویه گان: قیمت از زاویه ۱۸۰ از کف اخیر فراتر رفته است (حمایت از صعود). ⸻ ۶. مومنتوم و احساسات (Momentum & Sentiment): • RSI: مثبت در 4H و 1D با شکست سطح ۵۰. • MFI: نشاندهنده جریان نقدی خرید قوی از ناحیه تقاضای اخیر است. • OBV: در روند صعودی حمایتی. • الگوی Anti-Climax زیر ۲۴۵۰ با کندلهای مومنتوم بعدی مشاهده شده است. ⸻ سناریوها: سناریو صعودی (مطلوب): • شرایط فعالسازی: • ثبات بالای ۲۶۱۰ • کندل تایید صعودی (Engulfing / Shift Candle) • هدف اول: ۲۷۴۵ (PWH) • هدف دوم: ۳۰۶۸ (۰.۶۱۸ هفتگی) • هدف سوم: ۳۳۳۳–۳۴۸۷ • نقطه ابطال: بسته شدن روزانه زیر ۲۵۰۰ سناریو نزولی (جایگزین): • شرایط فعالسازی: • شکست کاذب بالای ۲۶۵۰ + CHoCH نزولی در 4H • شکست ناحیه حمایت ۲۵۲۰ با مومنتوم منفی • هدف اول: ۲۴۵۷ • هدف دوم: ۲۳۲۰ (Equilibrium) • هدف سوم: ۲۰۶۰ (OB اصلی) • نقطه ابطال: بازگشت به بالای ۲۶۲۰ با ثبات ⸻ توصیه: نوع معامله: Swing معامله پیشنهادی (صعود): • Entry: ۲۶۱۲ • SL: ۲۴۸۰ • TP1: ۲۷۴۵ • TP2: ۳۰۶۰ • TP3: ۳۳۳۳
Disclaimer
Any content and materials included in Sahmeto's website and official communication channels are a compilation of personal opinions and analyses and are not binding. They do not constitute any recommendation for buying, selling, entering or exiting the stock market and cryptocurrency market. Also, all news and analyses included in the website and channels are merely republished information from official and unofficial domestic and foreign sources, and it is obvious that users of the said content are responsible for following up and ensuring the authenticity and accuracy of the materials. Therefore, while disclaiming responsibility, it is declared that the responsibility for any decision-making, action, and potential profit and loss in the capital market and cryptocurrency market lies with the trader.