Technical analysis by hossammetawee about Symbol BTC: Buy recommendation (9/19/2025)

hossammetawee
التحليل الفني لعملة البيتكوين تصحيح قصير المدى وفرصة للشراء
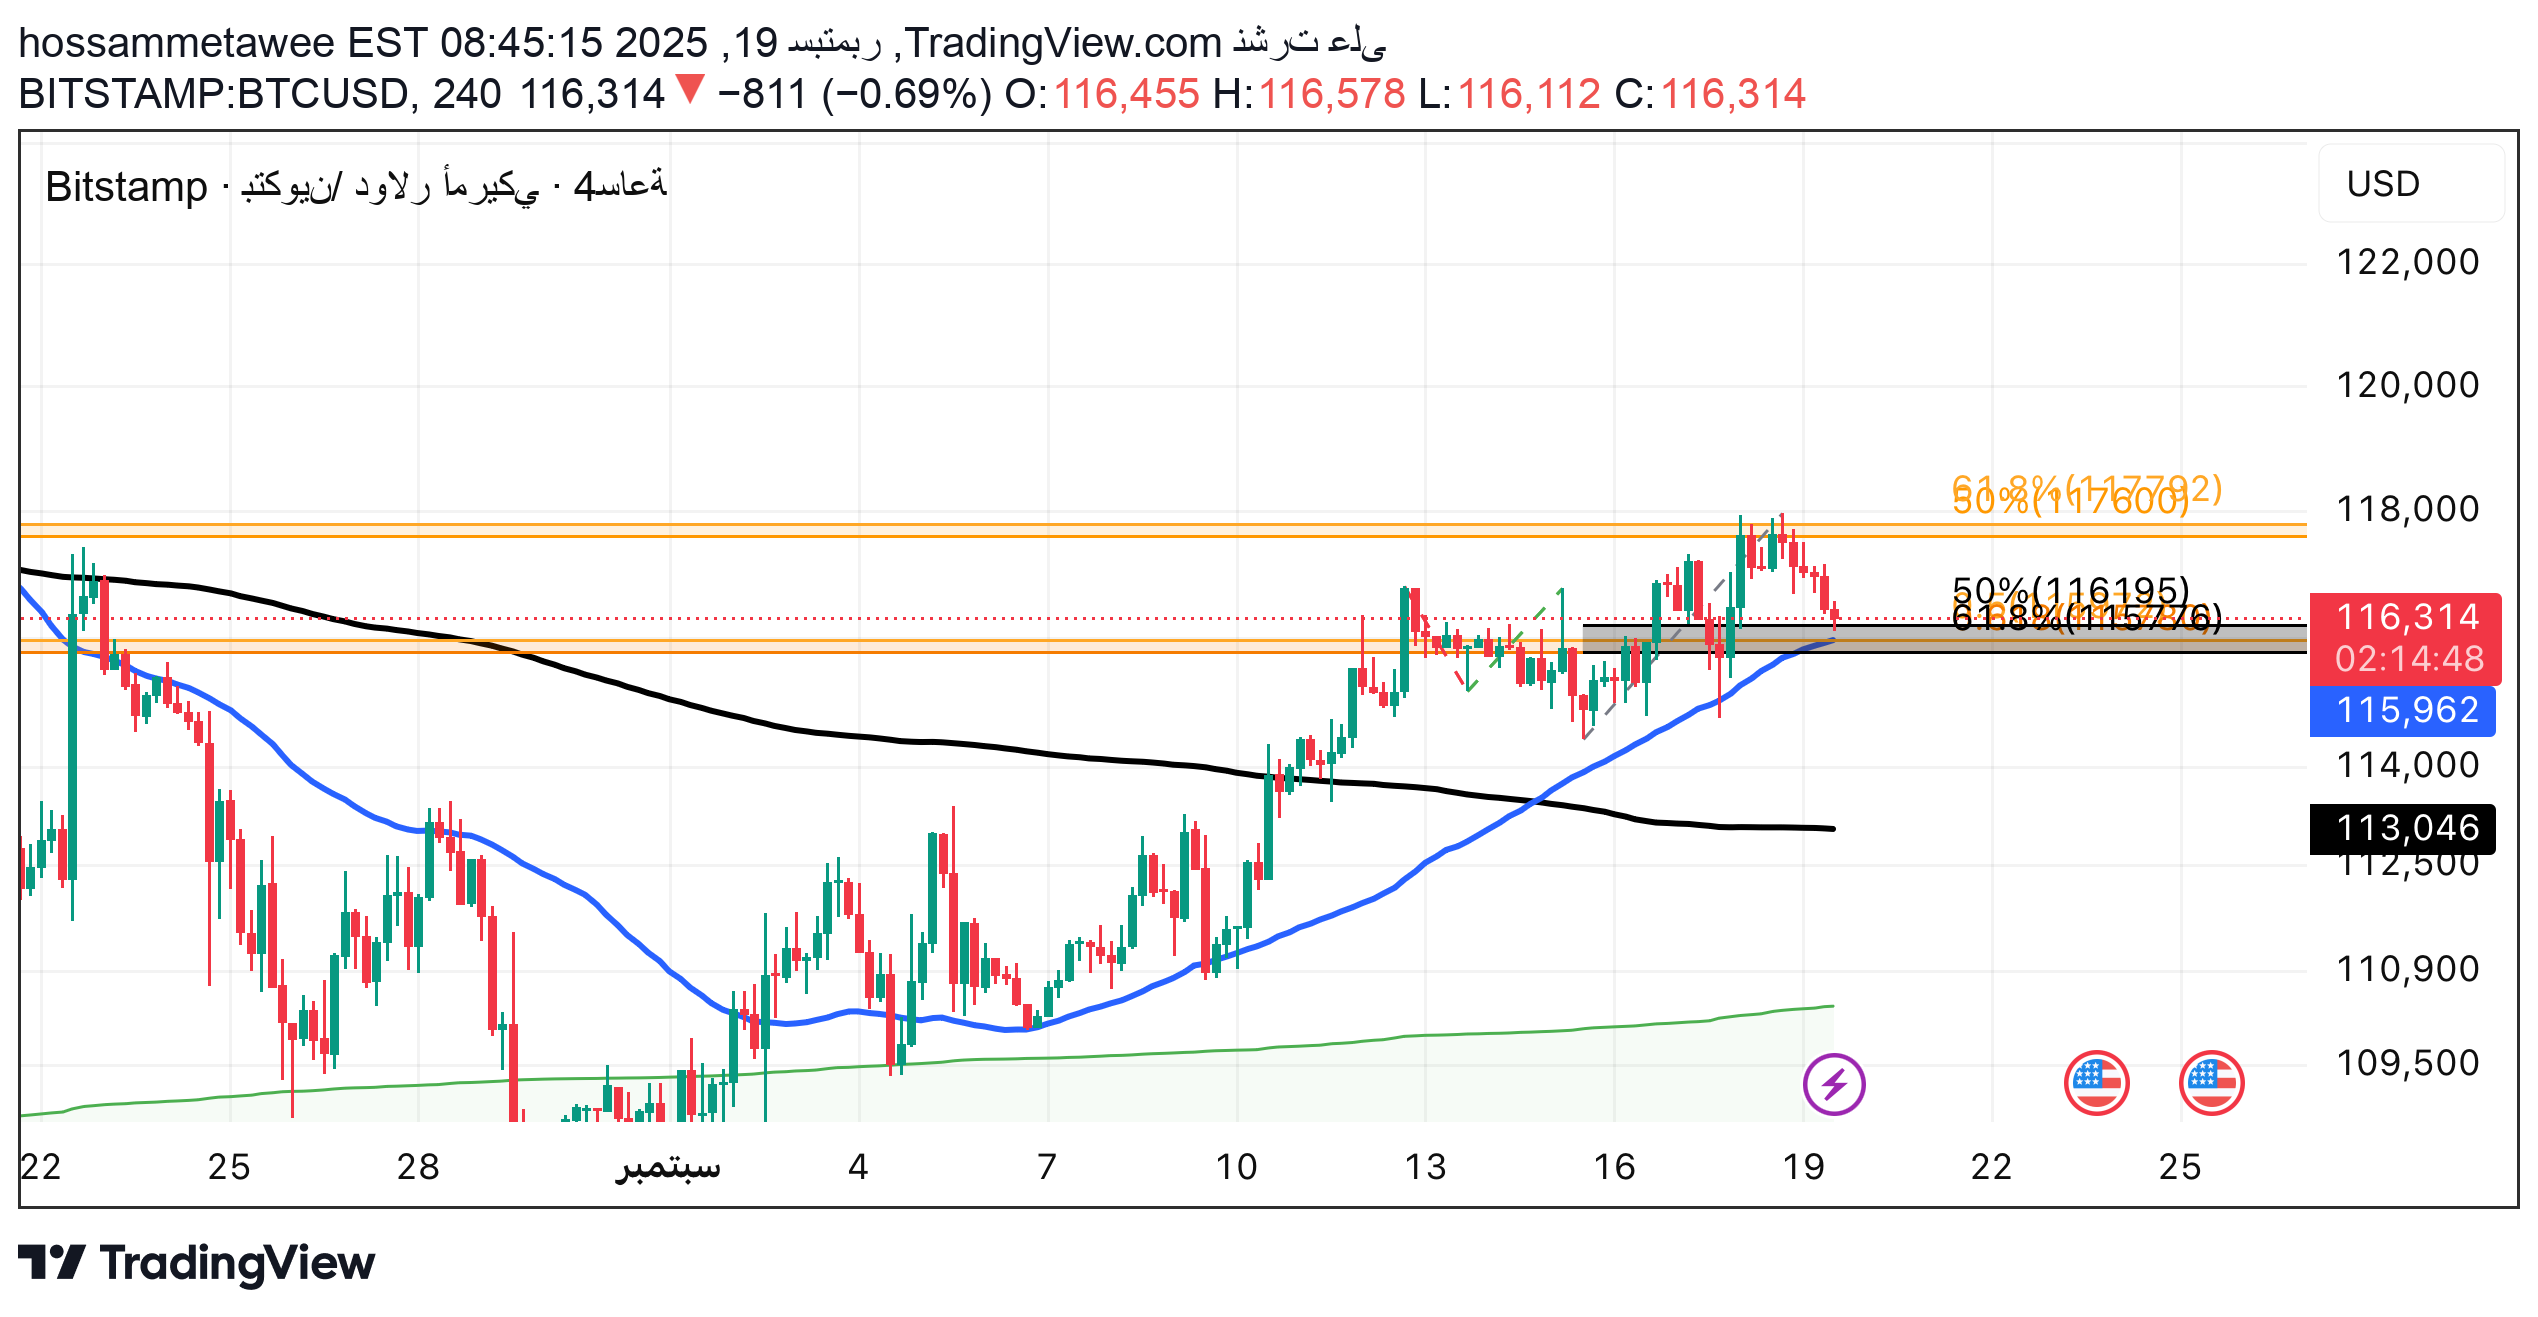
BTCUSD in a short -term correction phase of $ 115,800 - $ 114,700, which is an ideal purchase area to target $ 118,000 - $ 122,000 in the near term. Selling only if $ 114,500 is broken clear 1- Structural Trend • The weekly and daily Al -Farim is still in a medium -term ascending direction after penetrating the levels of $ 100,000, with the stability of the highest long -term averages. • On the small viruses (4H and 2 H) there is a short -term correction towards the liquidity areas of $ 115,800 - $ 114,700. 2- Internal Structure • A clear fracture of an upward sub -structure (BOS) on Freem 2H and 4 H. • The price is currently moving between 50% levels and 61.8% Vibonacci ($ 116,540 - $ 115,977). • Equilibrium is about $ 116,600. 3- Liquidity Structure • Strong liquidity areas below $ 115,900 - $ 114,700 (places to stop losses for buyers). • Clear purchasing liquidity above $ 117,600 - $ 118,000, which represents current resistance. • On the weekly Al -Farim: There is assembly liquidity near $ 122,000 - $ 124,500. 4- Multi-Timeframe Alignment (Multi-Timeframe Alignment) • BILISH BIAS. • 4H and 2 H: Corrective Bearish. 👉 Compatibility indicates a short -term drop to test liquidity, then resume the upward trend. 5- Technical Confluence • Strong resistance at $ 117,600 - $ 118,200 (Weak High + Volume Profile). • Main support at $ 115,800 - $ 114,700 (FVG + PDL + 61.8%). • The moving average 200 days supports buyers at $ 114,500. 6- Momentum & Sentiment • A negative short -term momentum (RSI on 4H retreats from the purchasing saturation areas). • The market feelings tend to be seized due to a clear breaking of $ 118,000 or a drop to test $ 114,500. 7- Dual Scenario 🔹 Al -Swario Al -Swami (favorite after the correction): • First drop to test $ 115,800 - $ 114,700. • Then an emerging bounce targets $ 118,000 - $ 122,000. 🔹 Detal scenario (if $ 114,500 is broken clearly): • The landing continues about $ 112,950 - $ 113,500. • If $ 112,000 is broken, the correction may extend to $ 106,000. 8- Trigger Conditions • Purchase only after confirming a strong reflexive reflex reversion from $ 115,800 - $ 114,700. • Selling short -term only if the price is closed under $ 114,500 with confirmation of trading volume. 9- Trend model • Buying (Main Wishing): • Entry: $ 115,800 - $ 114,700. • Stop loss: $ 113,900. • Goals: $ 118,000 - $ 122,000 - $ 124,500. • Selling (secondary scenario): • Entry: Close under $ 114,500. • Stopping loss: $ 116,000. • Goals: $ 113,000 - $ 111,000. 10- Risk Management The maximum risk: 1.5% of the capital. Divide contracts by 3 goals (TP1/TP2/TP3). • Using a trilling stop after achieving 50% of the first goal. 11- Last Candle Analysis • On Freem 4H: a lower luxurious candle with a long upper shade → confirmation of sale pressure at $ 117,200. • On Freem 2H: The current candles are moving within the support range of $ 116,600, which is more likely to drop $ 115,800