
hilmiyus
@t_hilmiyus
What symbols does the trader recommend buying?
Purchase History
پیام های تریدر
Filter
تحلیل انفجاری: ریسک بالا، سود چند برابری – سیگنال خرید طلایی در این سطح!
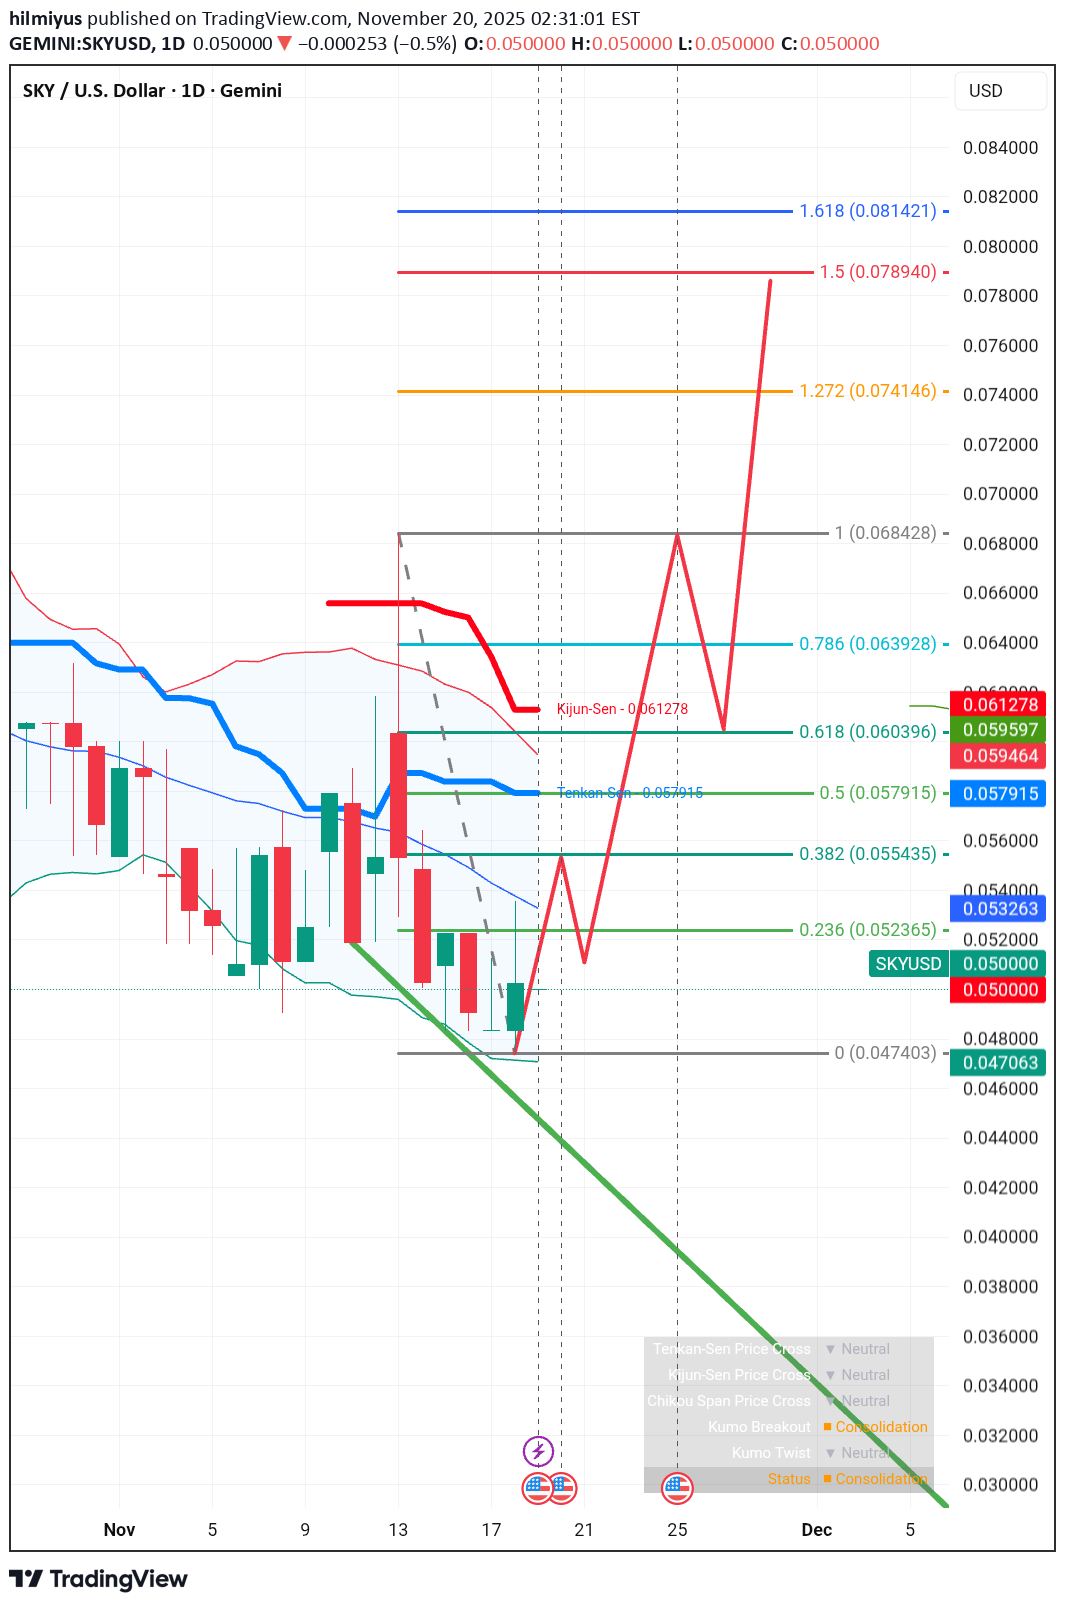
1. Current Market Structure Trend: The asset has been in a downtrend, evidenced by the lower highs and lower lows over the past few weeks. The price is currently trading around $0.0500. Support Zone: The price recently found a floor at the 0.0474 level (marked as the 0 Fibonacci level). The current price action suggests a period of consolidation or a potential bottoming formation. Indicators: Ichimoku Elements: The price is currently below the Tenkan-Sen ($0.0579) and Kijun-Sen ($0.0612) lines. In Ichimoku theory, price below these lines typically indicates bearish momentum, meaning the price needs to cross above them to confirm a reversal. Bollinger Bands: The bands appear to be narrowing slightly, which often precedes a period of high volatility (a breakout or breakdown). 2. The "Red Line" Projection The red hand-drawn line on your chart represents a classic Reversal Scenario, specifically resembling a Double Bottom or a complex Inverse Head and Shoulders pattern. Here is the breakdown of that prediction: Phase 1: The Retest (Current to Short Term) The projection anticipates the price might dip slightly one more time to retest the recent low near $0.0474. This would create the second "leg" of a "W" pattern (Double Bottom), confirming strong support at that level. Phase 2: The Breakout After the retest, the projection predicts a sharp rally upward, breaking past the initial resistance at the 0.236 Fib ($0.0523) and the 0.382 Fib ($0.0554). Phase 3: The Golden Ratio Challenge The rally is expected to pause or face resistance at the 0.618 Fib level ($0.0603). In technical analysis, this is often called the "Golden Pocket." A rejection here is common, hence the small dip drawn in the red line before the continuation. Phase 4: The Extension (Target) The final leg of the drawing predicts a massive breakout to the 1.618 Fibonacci Extension at $0.0814. 3. Key Technical Levels to Watch Critical Support0.0474The recent low. If the price breaks below this, the bullish projection is invalidated, and the price could seek lower lows. Resistance 10.0579Tenkan-Sen / 0.5 Fib. A crucial mid-point resistance. Resistance 20.0612Kijun-Sen / 0.618 Fib. This is the "trend flipper." Breaking this confirms a bullish trend reversal. Target0.08141.618 Extension. The ultimate profit target based on this specific Fib setup. 4. Summary The market is currently bearish, but the drawing is betting on a bottom formation. Bullish Signal: Watch for a daily candle close above $0.053 (the blue Moving Average line). This would start to validate the upward move. Bearish Signal: A daily close below $0.0470 would invalidate the support and likely lead to a further drop.
تحلیل قیمت: بازار در مرحله تثبیت؛ کجا کف میکند و سقف مقاومت کجاست؟
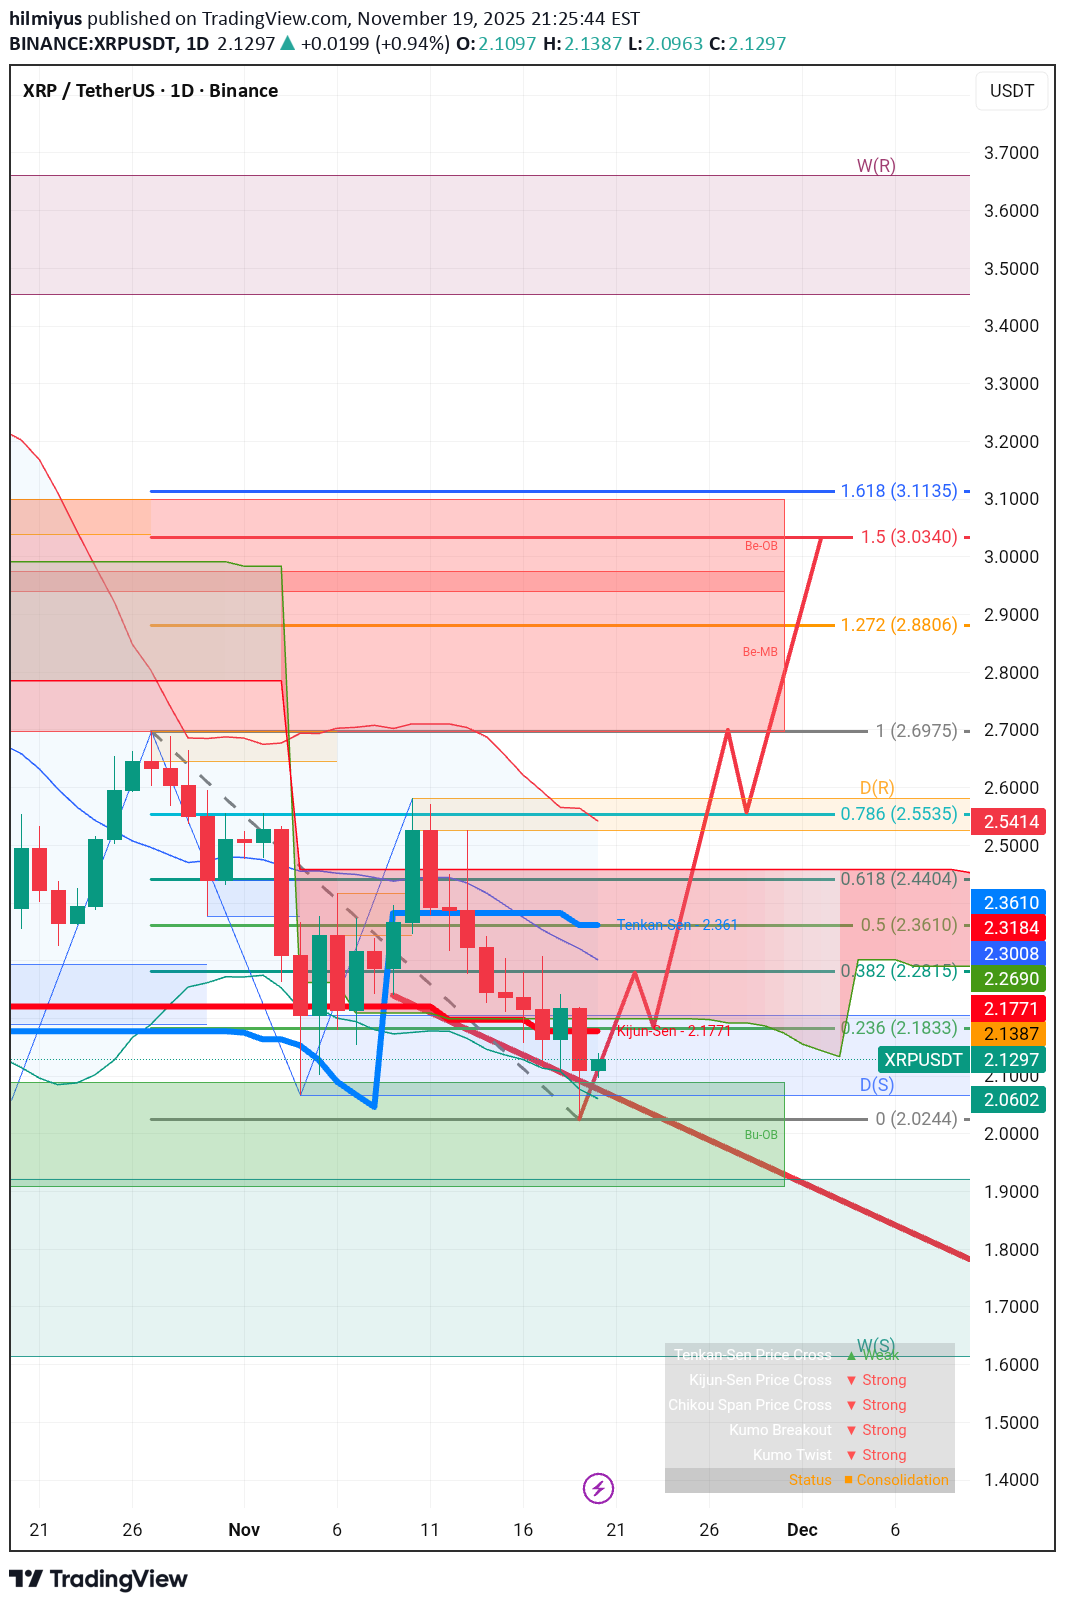
1. Market Overview Current Price: $2.1307 Trend Status: The market is currently in a consolidation phase (confirmed by the status panel in the bottom right) following a correction from the local high (LH). Immediate Sentiment: Short-term bearish to neutral, attempting to find a floor at the support zone. 2. Key Support and Resistance Levels Support (The Floor): Primary Support ($2.02 - $2.06): The price recently wicked down to $2.0244 (marked as the 0 Fib level) and bounced. This area is reinforced by the top of the Green Order Block (Bu-OB) and the Daily Support line D(S). Deep Support ($1.90): Below the current structure, there is a Weekly Support W(S) level at $1.9083. If the current low fails, this is the next major magnet for price. Resistance (The Ceiling): Immediate Resistance ($2.17 - $2.18): The price is currently struggling against the Kijun-Sen (Red Line) at $2.1771 and the 0.236 Fibonacci level at $2.1833. Trendline Resistance: There is a steep red descending trendline connecting the recent lower highs. A breakout above this diagonal line is required to shift momentum. Major Resistance ($2.36): The 0.5 Fibonacci level at $2.3610 coincides with the Tenkan-Sen (Blue Line). This is a "confluence zone" where multiple resistance factors meet. 3. Indicator Analysis Fibonacci Retracement: The chart uses a retracement drawn from the recent low ($2.02) to the previous high ($2.69). The price is currently trading below the 0.236 level, indicating that buyers are still weak. To validate a reversal, bulls need to reclaim the 0.382 level ($2.28). Ichimoku Cloud: Tenkan vs. Kijun: The Tenkan-Sen (Blue) is above the price, and the Kijun-Sen (Red) is flat. The price is below both, which is generally a bearish signal for the short term. Cloud (Kumo): The price appears to be interacting with the top of the green cloud. If the price stays above the green cloud, the long-term trend remains bullish. 4. The Projected Path (Red Zigzag Line) The forecast path (the thick red line) anticipates a breakout above the descending trendline. Target: It projects a rally towards the 1.5 Fib Extension ($3.03) and potentially the 1.618 Extension ($3.11). Validity: For this path to play out, XRP must close a daily candle above $2.18 (breaking the immediate resistance) and subsequently $2.36 (breaking market structure). Summary & Strategy Bullish Scenario: Watch for a daily close above $2.1833. If this happens, the next target is the $2.36 region. The "Golden Pocket" (0.618 Fib) at $2.44 would be the confirmation zone for a return to the highs. Bearish Scenario: If the price gets rejected at the Kijun-Sen ($2.1771) and fails to hold the recent low of $2.02, expect a drop into the deep green support zone around $1.90.
بیت کوین در آستانه انفجار: سطح حیاتی ۹۰ هزار دلار چقدر مهم است؟
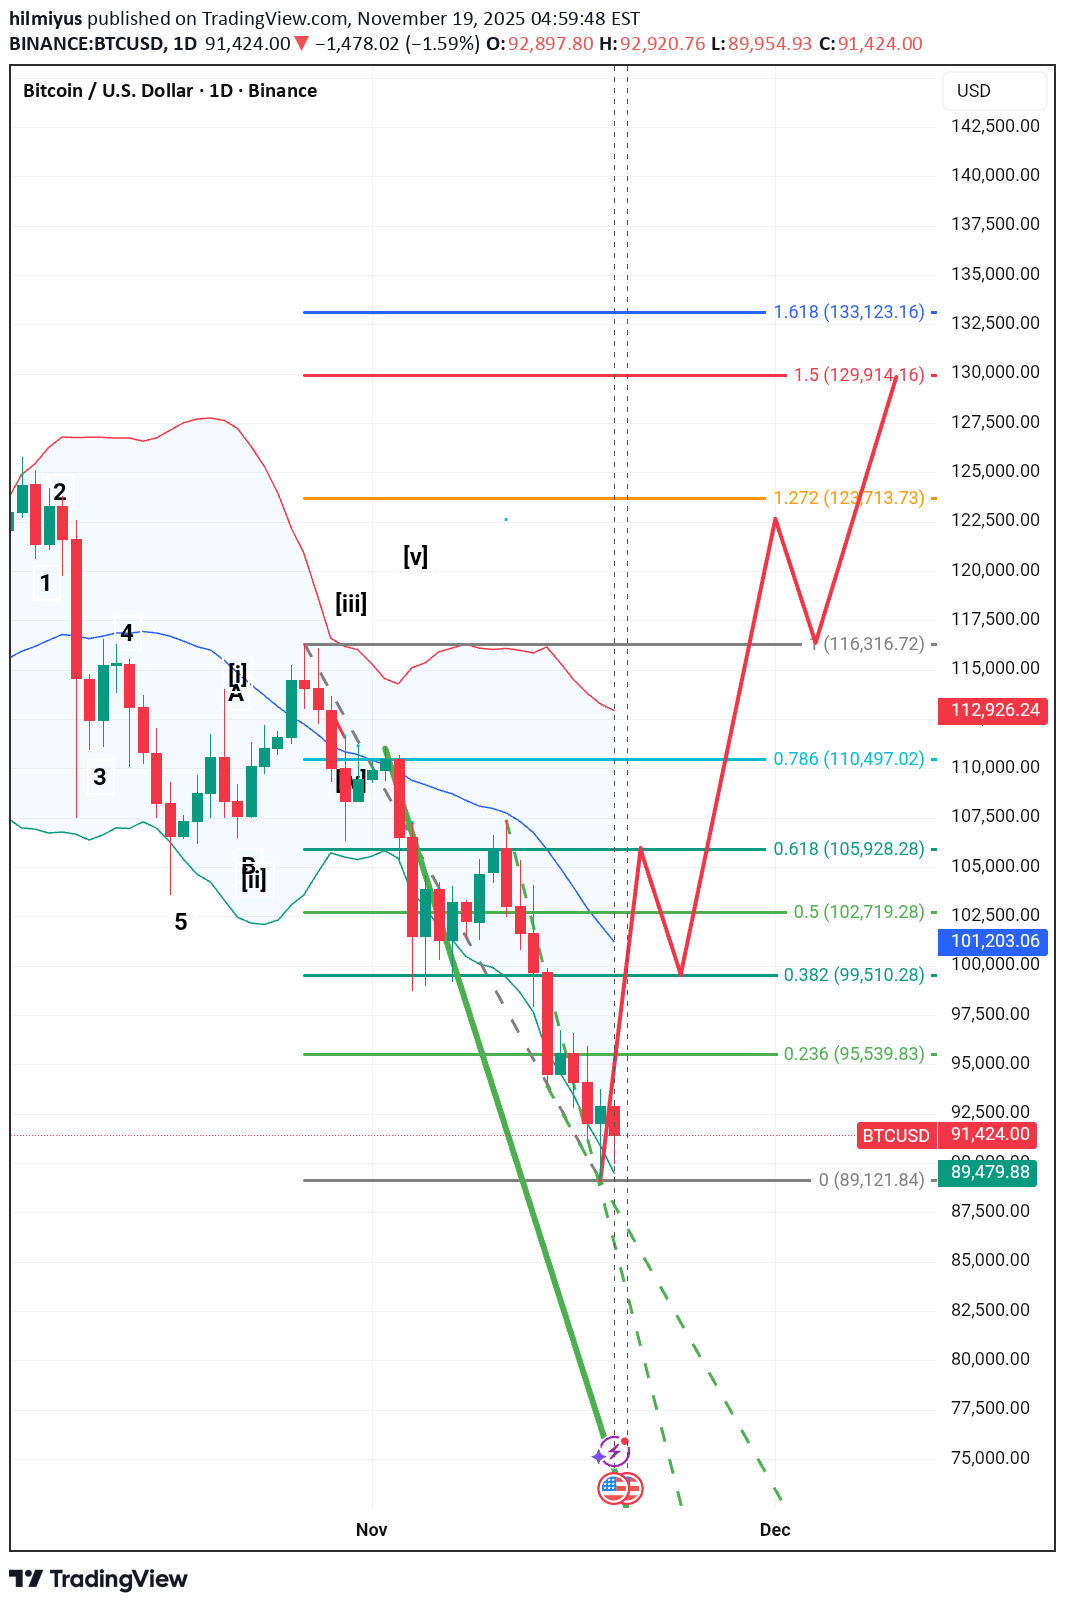
1. Market Structure & Trend Current Status: The market is in a short-term downtrend (correction) following a peak at roughly $116,316 (labeled as Wave 1). Immediate Price Action: Bitcoin is trading around $91,381, hovering just above the "0" Fibonacci anchor point of $89,121. Elliott Wave Context: The labels , [ii], [iii], [v] suggest a completed higher-degree impulse wave. The current drop is likely the corrective phase (A-B-C) attempting to find a bottom before the next major leg up. 2. Key Support & Resistance Levels Support ( The Floor) $89,121 (Fib 0 Level): This is the line in the sand. The price has retraced fully to this pivot low. If this level holds, it confirms a "Double Bottom" structure, which is a bullish reversal signal. Demand Zone ($90k - $92k): The price is currently consolidating in this zone (the lowest red/green candle cluster), showing a potential exhaustion of selling pressure. Resistance (The Ceiling) $102,719 (Fib 0.5): The first major test for bulls. Regaining this level indicates the trend is shifting. $105,928 (Fib 0.618 - "Golden Pocket"): This is the most critical resistance. In technical analysis, a rejection here often leads to lower lows, while a clean break above usually targets the previous highs. $110,497 - $112,931 (Bearish Order Block / Weekly Support): The red box labeled W(S) (which acted as support previously) and Be-OB (Bearish Order Block) will likely act as strong resistance on the way back up. 3. The Projected Path (Red Line) The analyst has drawn a specific roadmap for recovery: The Bounce: A sharp rally from the current $89k support. The Retest: A move up to the 0.618 level ($105k), followed by a pullback (making a "Higher Low"). The Breakout: A surge through the $116k high. The Target: A final extension reaching the 1.618 Fibonacci level at roughly $133,123. 4. Indicators & Fibonacci Levels Fibonacci Retracement: The tool is drawn from the swing low ($89k) to the swing high ($116k). The current price returning to the 0 level indicates a 100% retracement of that specific swing. Moving Averages/Bands: The wavy lines (blue/red bands) appear to be compressing. The price is currently below the center line, indicating bearish momentum, but the "squeeze" often precedes a volatile move (breakout or breakdown). 5. Bearish Risks (The Alternative) Dashed Green Lines: Notice the dashed green lines pointing steeply downward below the current price. Breakdown Scenario: If the $89,121 support fails to hold, the structure breaks. The next logical supports would be psychological levels (e.g., $85k, $80k) or previous accumulation zones not fully visible on this zoom level. A break below $89k invalidates the specific bullish "W" projection drawn on the chart. Summary of Trade Setup (Based on Chart) ComponentLevel / ZoneSignificance Entry Idea$89,500 - $91,500Buying near the "0" support with tight risk management. Stop LossBelow $89,000A close below the recent wick low invalidates the thesis. Target 1$105,928The Golden Pocket (0.618 Fib). Target 2$116,316Previous Swing High. Target 3$133,1231.618 Fibonacci Extension (New ATH).
تحلیل حساس قیمت اتریوم: آیا روند نزولی ادامه مییابد یا شاهد بازگشت صعودی هستیم؟
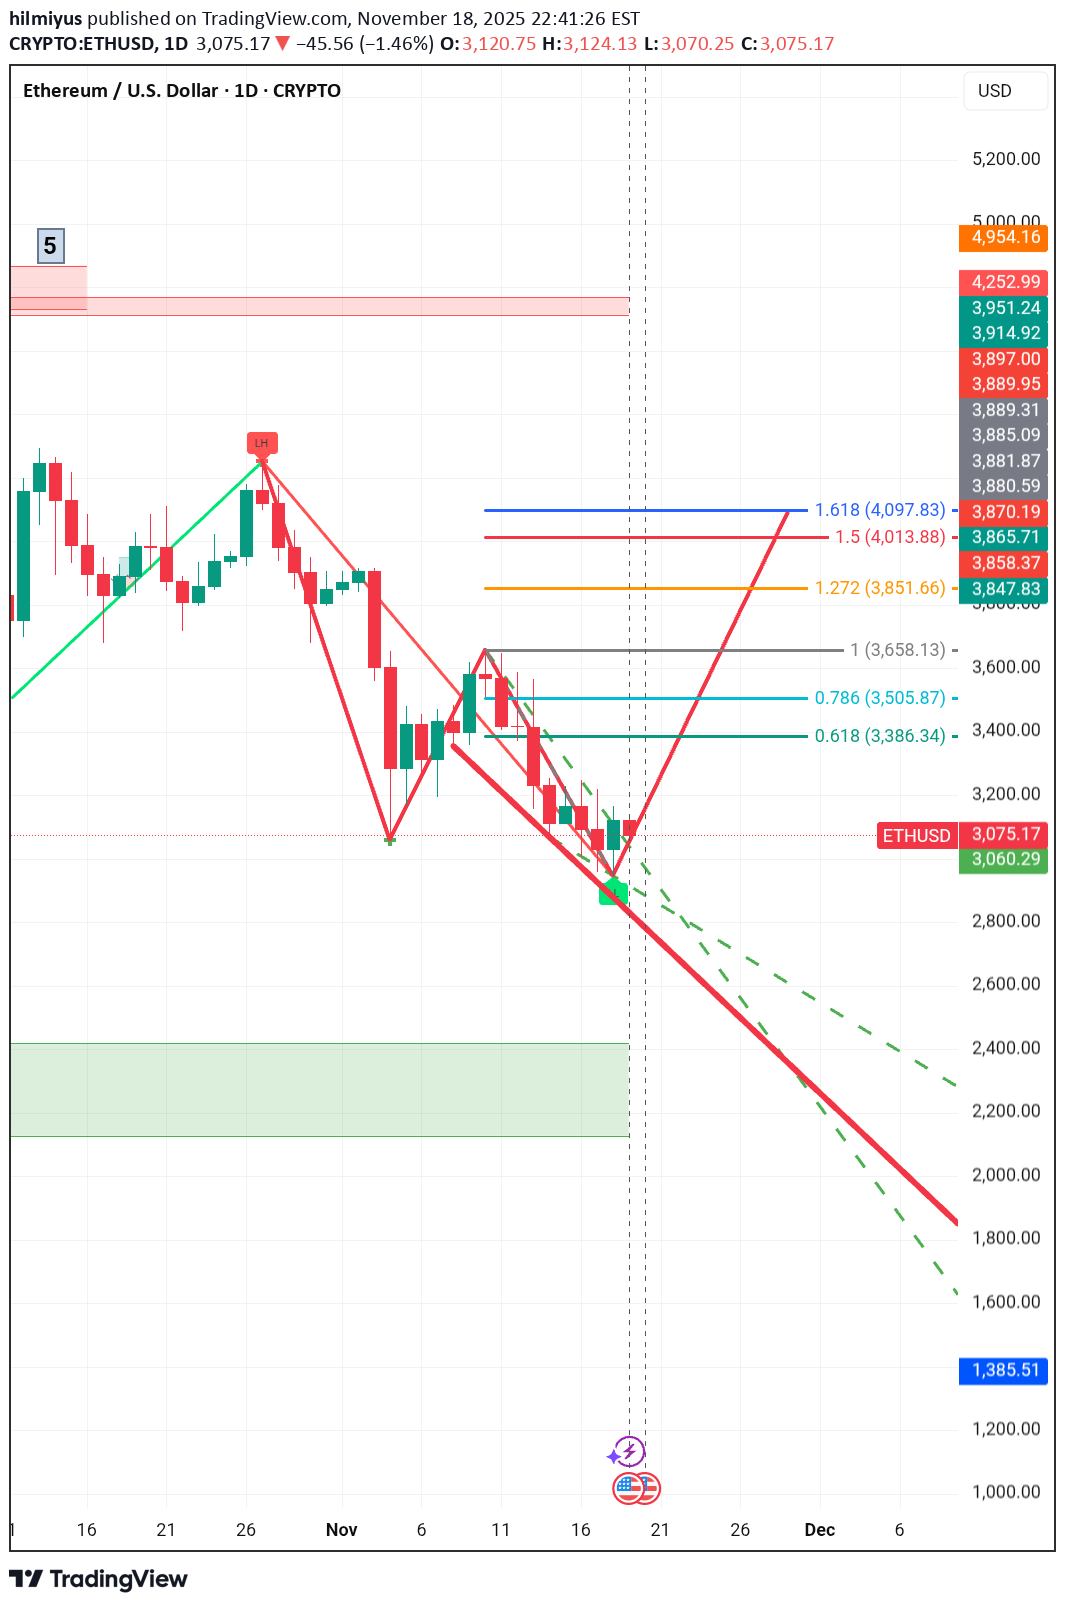
The chart shows that ETH/USD has been in a recent downtrend following a previous high near $4,250. Bearish Formation: A "Wedge" or "Falling Channel" pattern has been drawn, typically indicating a potential continuation of the existing trend (downtrend) or a possible reversal if broken to the upside. The price is currently trading within this descending structure. Current Price: The price is shown as $3,091.70. Potential Support: The price is resting near what appears to be a key horizontal support level around $3,060 - $3,200. Bearish Scenario (Continuation) The strong red dashed line and the large green box below suggest a significant bearish outlook if the current support fails. Breakdown Target: If the price breaks the current support and the lower boundary of the drawn wedge/channel, the next significant support or target area is a green box (likely a high-volume node or demand zone) between approximately $2,200 and $2,500. Extreme Bearish Target: The ultimate bearish target, following the long red dashed line, points towards the $1,385.51 level. This suggests a long-term continuation of the downtrend. 🐂 Bullish Scenario (Reversal) A Fibonacci Extension tool has been used on a recent swing, suggesting potential upside targets if a reversal occurs. Immediate Resistance: The upper boundary of the descending channel (dashed green line) and the immediate Fibonacci retracement levels will act as resistance. Fibonacci Targets: The extension levels provide specific price targets for a potential upward movement: 1.272 Extension (Orange): $3,851.66 1.5 Extension (Red): $4,013.88 1.618 Extension (Blue): $4,097.83 Reversal Trigger: A strong close above the descending dashed trendline and potentially the $3,658.13 level (the 1 extension, or a recent swing high) would confirm a bullish trend change toward these targets. Conclusion The chart presents a critical juncture for ETH/USD: Bearish Confirmation: A break below $3,060 would likely validate the downtrend towards $2,500. Bullish Confirmation: A break above the dashed channel line and the $3,658 level would suggest a bullish reversal targeting the $3,850 to $4,100 range.
تکلیف سولانا: آیا صعود میکنیم یا سقوط ادامه دارد؟ (تحلیل کلیدی قیمت)
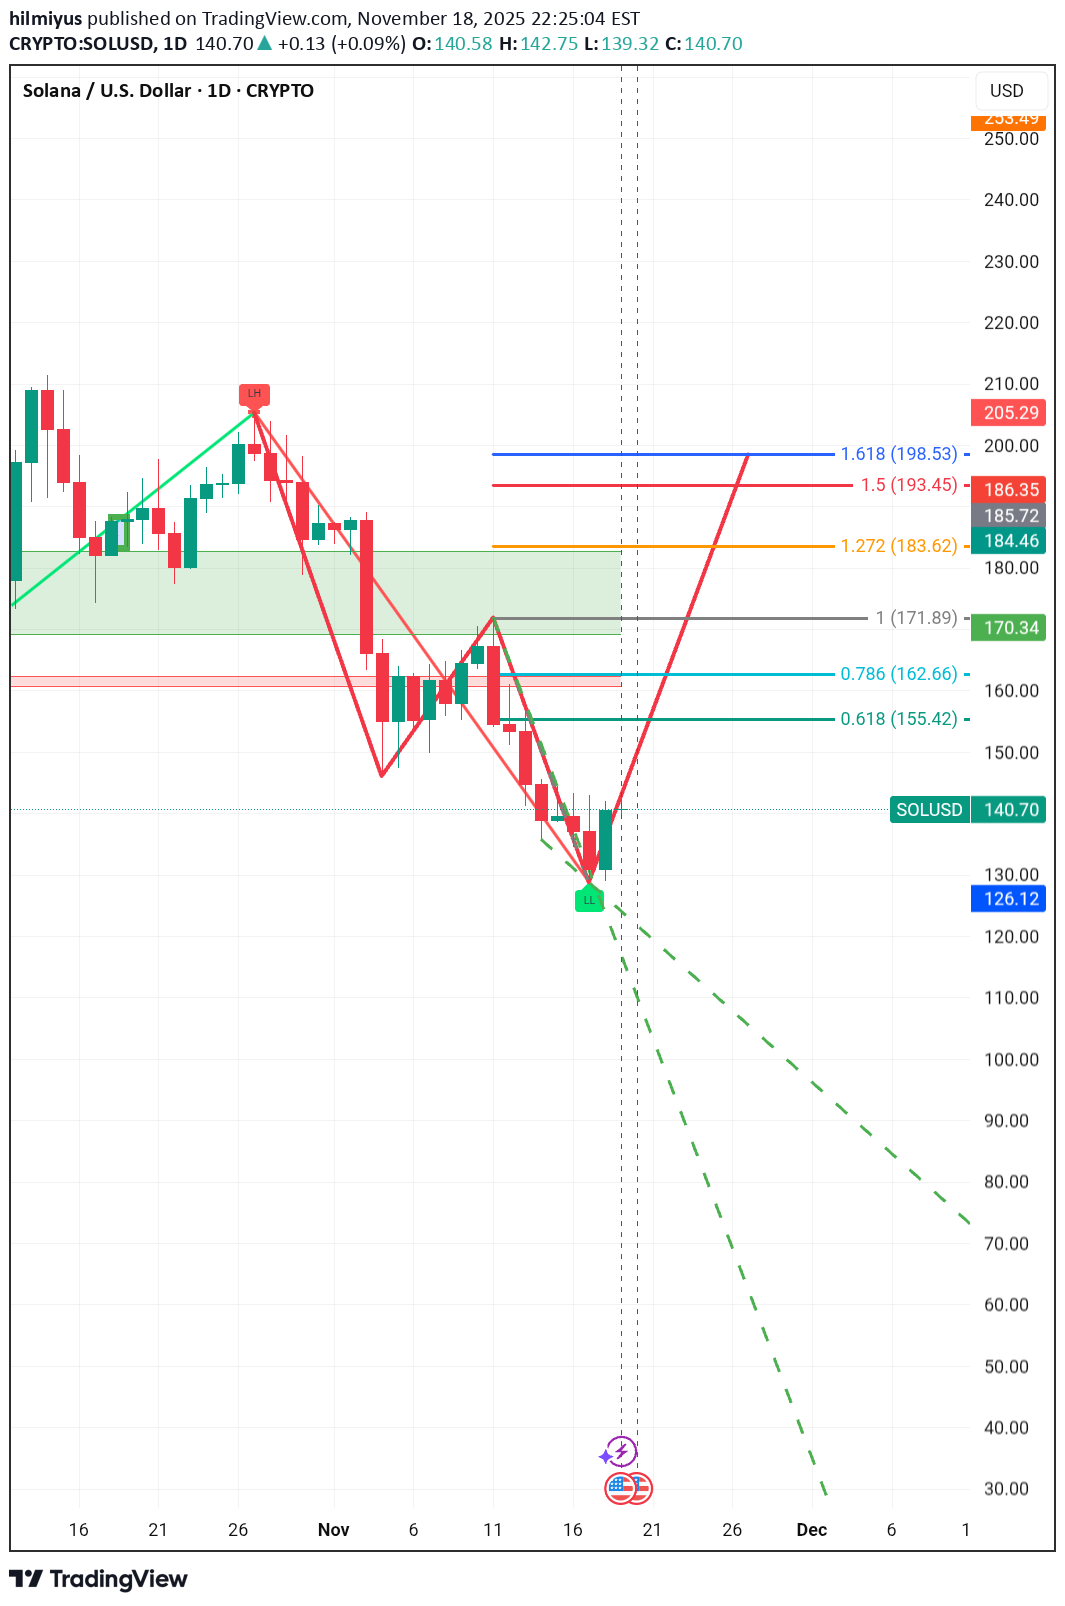
Scenario 1: Short-Term Bullish Rebound (Price moves higher) If the reversal pattern holds, SOL could attempt to reclaim some key resistance levels: First Target (Resistance): The area between the 0.618 Fib extension ($155.42) and the $170.34 pivot point. Major Resistance Zone: The green shaded area, which acted as previous support and now is a critical resistance zone, spanning from roughly $184.46 to $170.34. This area includes the crucial 1.272 Fib extension ($183.62). A break above this zone would signal a stronger bullish reversal. Upper Targets: 1.5 Fib extension ($193.45) and 1.618 Fib extension ($198.53), aiming back toward the previous high of $205.29. Scenario 2: Continuation of Downtrend (Price moves lower) If the price fails to hold above the current level and breaks the recent low: Critical Support: A break below the $130.00 level would confirm the continuation of the downtrend. Downside Targets: The dashed green lines suggest a continuation channel, potentially targeting prices in the $120.00 - $80.00 range and lower, but these projections are quite far out. So Solana is currently testing a potential short-term bottom near $130.00. The next few days are crucial. A move back above $155.42 would increase the probability of a relief rally toward the $170 - $185 resistance area. Conversely, a break below $130.00 would open the door for a deeper correction.
تحلیل تکنیکال: آیا روند صعودی قدرتمند ادامه دارد یا اصلاح عمیق در راه است؟
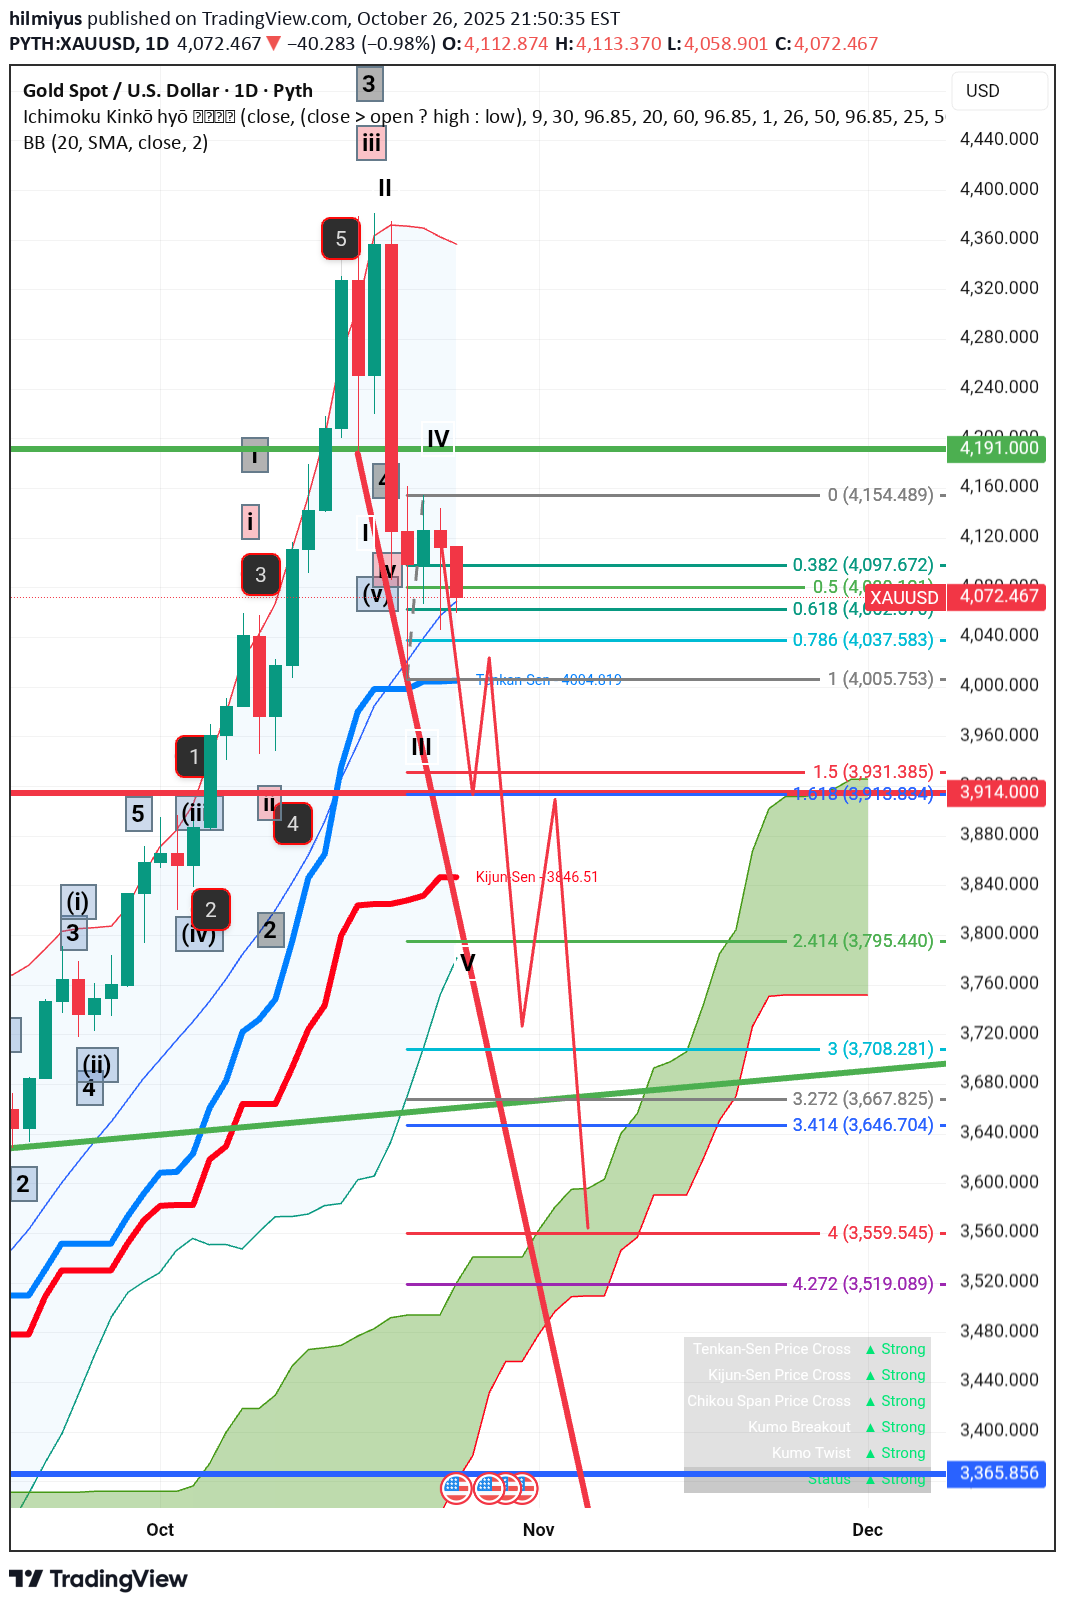
Current Price: The last closing price is 4,073.630, which is down $39.120 (-0.95%) from the previous close. Bollinger Bands (BB): BB (20, SMA, close, 2): Middle band is 4,069.017. The price is currently near the middle Bollinger Band. Ichimoku Kinko Hyo: Tenkan-Sen (Red/Blue line): Not explicitly labeled with a value, but the line represents a short-term average (typically 9 periods). Kijun-Sen (Red line): The value is 3,846.51. This is a longer-term average (typically 26 periods) and acts as a strong support/resistance line. The price is currently well above it, suggesting a bullish bias on the longer term. Kumo (Cloud - Green/Red shaded area): The cloud is currently green (leading span A above leading span B) and thickening, which typically indicates a strong bullish trend. The price is far above the cloud. Status Indicators (Bottom Right): The Ichimoku components are all signaling "Strong" bullish signals: Tenkan-Sen Price Cross: Strong Kijun-Sen Price Cross: Strong Chikou Span Price Cross: Strong Kumo Breakout: Strong Kumo Twist: Strong Status: Strong Price Action and Patterns Elliott Wave Labeling: The chart uses Roman numerals (i, ii, iii, iv, v) and Arabic numerals (1, 2, 3, 4, 5) to suggest a completed or nearly completed impulsive wave pattern: A five-wave impulse appears to have completed (or peaked) at the price high of around 4,375. This high is labeled with a circled 5 and a Roman numeral III (likely the end of the larger degree wave 3). The subsequent price drop (the large red candle) suggests the start of a correction, possibly a wave IV (Roman numeral) or a new corrective pattern. Fibonacci Retracement: A Fibonacci retracement tool is drawn from the recent high (4,154.489 or slightly higher) down to a recent low (implied for the current correction). The current price (4,073.630) is near the 0.618 retracement level at 4,079.530 and the 0.5 level at 4,047.889. The 0.618 level is a significant retracement target for corrective waves. Holding above it suggests the correction might be shallow, while breaking below it could lead to a deeper drop toward the 0.786 level (4,005.753). Support/Resistance Levels: Immediate Resistance: The top of the recent consolidation/high, labeled 'IV' around 4,154.000. Strong Support: The Kijun-Sen at 3,846.51. Major Support: The bottom of the cloud (Kumo) and a previous swing low around 3,365.856. However, the recent price action indicates a short-term correction is underway, likely after a significant upward impulse move. The price is currently testing a critical level near the middle Bollinger Band and the 0.618 Fibonacci retracement. If the price holds above the 0.618 level (~4,079) and reverses, it suggests the correction is minor, and the uptrend (Wave V in Elliott Wave terms) could resume quickly. If the price breaks significantly below the 0.5 level (~4,047) and the 0.786 level (~4,005), it indicates a deeper corrective wave is in play, potentially targeting lower Fibonacci levels or the Kijun-Sen.
تحلیل میانمدت تا بلندمدت: سطوح کلیدی مقاومت و حمایت (با تمرکز بر روند صعودی قوی)
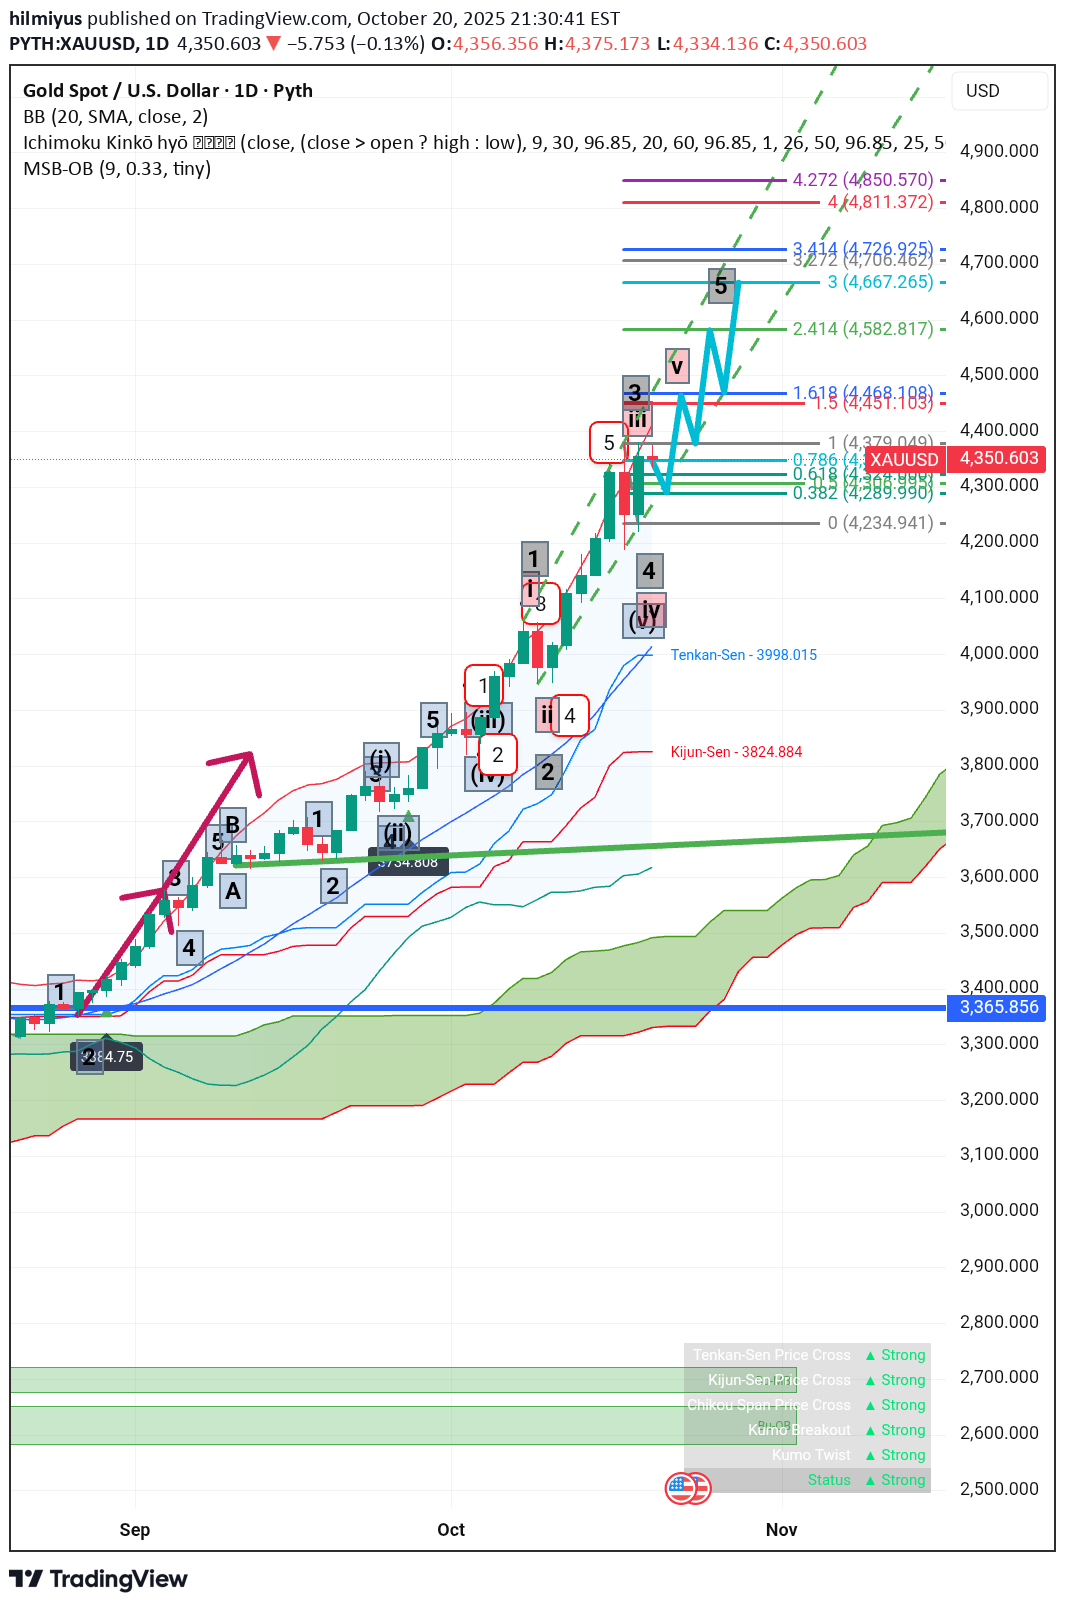
The chart shows a daily (1D) timeframe, suggesting a focus on medium-to-long-term trends. The current price is around $4,350.855. Resistance and Support The immediate and significant resistance is identified at the $4,451.10 level, corresponding to a labeled point 1.618 (likely a Fibonacci extension level). Other labeled resistance levels above the current price include: 4,582.817 (labeled 2.414) 4,667.265 (labeled 3) 4,720.242 (labeled 3.414) The highest labeled resistance is 4,850.570 (labeled 4.272). Support levels from the Fibonacci tool are near the current price: 4,343.435 (labeled 0.786) 4,328.885 (labeled 0.618) 4,285.885 (labeled 0.382) The price is currently well above the Ichimoku Cloud (Kumo), which is green and trending upward, indicating a strong bullish trend. Tenkan-Sen (Conversion Line): 3,998.015 (Blue line) Kijun-Sen (Base Line): 3,824.884 (Red line) The price is significantly above both the Tenkan-Sen and Kijun-Sen, reinforcing the strong momentum and bullish signal. A Tenkan-Sen/Kijun-Sen Price Cross is flagged as 'Strong' in the status table, confirming this. The price is trading near the upper band of the Bollinger Bands (BB (20, SMA, close, 2)), which typically suggests the price is becoming overbought or is at the peak of a strong directional move. The 20-period Simple Moving Average (SMA) is currently at 4,013.739. Since the price is far above the SMA, it further supports the strong upward trend.
پایان رالی صعودی؟ نمودار شگفتانگیز بازار که زنگ خطر ریزش را به صدا درآورده است!
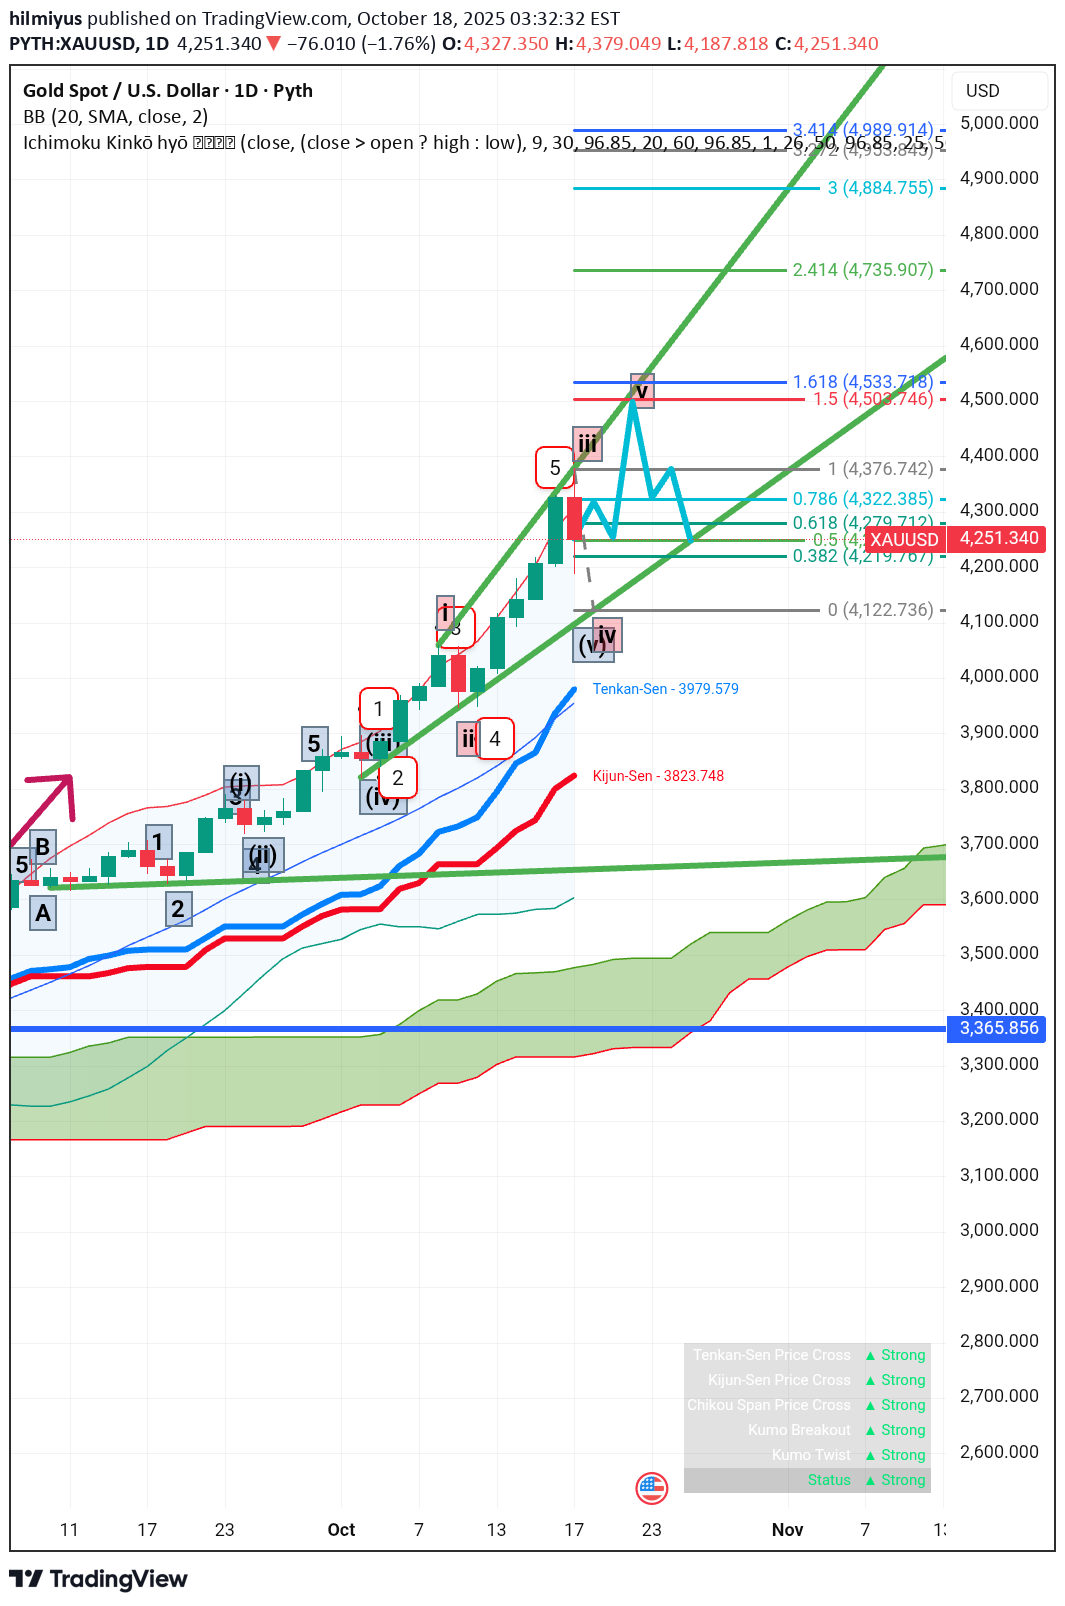
Two diverging trendlines that both slope upwards, creating a widening or megaphone shape on the chart. The price makes a sequence of higher highs (connected by the upper trendline) and higher lows (connected by the lower trendline). The distance between the highs and lows gets progressively wider. This signifies increasing price volatility and growing uncertainty in the market, as the fight between buyers and sellers becomes more aggressive and less controlled. It often appears at the end of a strong uptrend and signals that, despite the price making new highs, the buying power is becoming exhausted and sellers are starting to gain control. Look for a clear breakout below the lower trendline to confirm the pattern and signal a strong potential move to the downside (a bearish reversal).
Disclaimer
Any content and materials included in Sahmeto's website and official communication channels are a compilation of personal opinions and analyses and are not binding. They do not constitute any recommendation for buying, selling, entering or exiting the stock market and cryptocurrency market. Also, all news and analyses included in the website and channels are merely republished information from official and unofficial domestic and foreign sources, and it is obvious that users of the said content are responsible for following up and ensuring the authenticity and accuracy of the materials. Therefore, while disclaiming responsibility, it is declared that the responsibility for any decision-making, action, and potential profit and loss in the capital market and cryptocurrency market lies with the trader.