Technical analysis by hilmiyus about Symbol BTC on 11/19/2025

بیت کوین در آستانه انفجار: سطح حیاتی ۹۰ هزار دلار چقدر مهم است؟
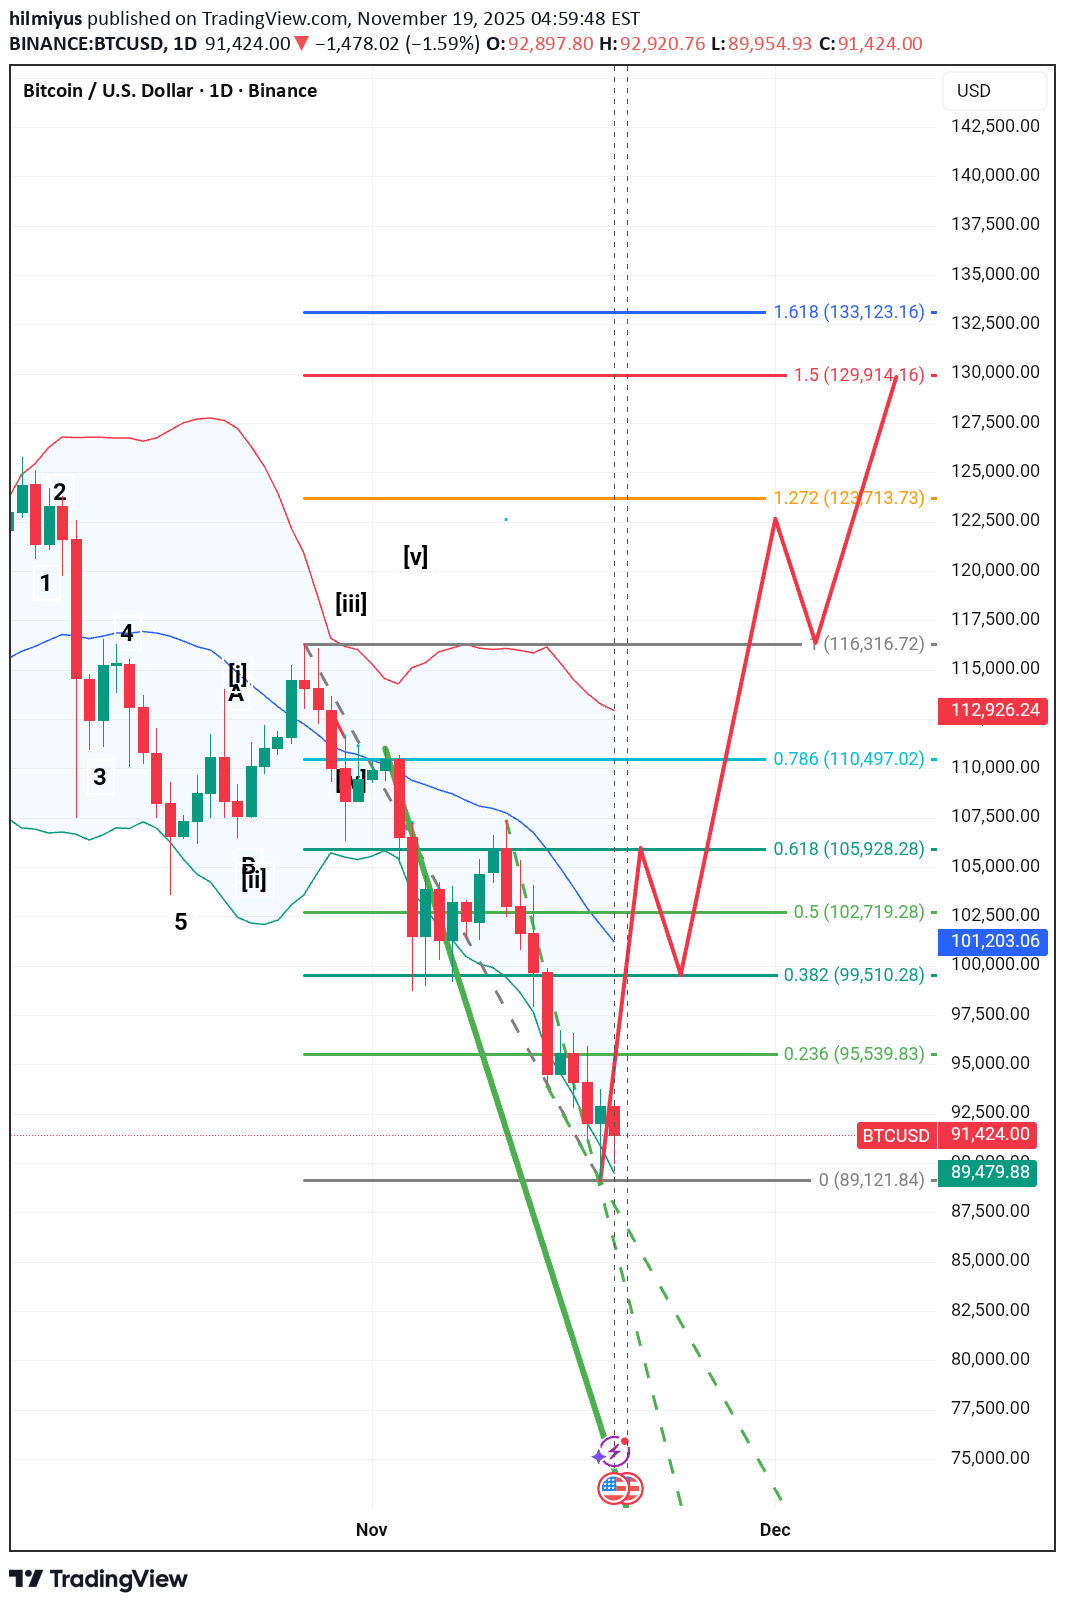
1. Market Structure & Trend Current Status: The market is in a short-term downtrend (correction) following a peak at roughly $116,316 (labeled as Wave 1). Immediate Price Action: Bitcoin is trading around $91,381, hovering just above the "0" Fibonacci anchor point of $89,121. Elliott Wave Context: The labels , [ii], [iii], [v] suggest a completed higher-degree impulse wave. The current drop is likely the corrective phase (A-B-C) attempting to find a bottom before the next major leg up. 2. Key Support & Resistance Levels Support ( The Floor) $89,121 (Fib 0 Level): This is the line in the sand. The price has retraced fully to this pivot low. If this level holds, it confirms a "Double Bottom" structure, which is a bullish reversal signal. Demand Zone ($90k - $92k): The price is currently consolidating in this zone (the lowest red/green candle cluster), showing a potential exhaustion of selling pressure. Resistance (The Ceiling) $102,719 (Fib 0.5): The first major test for bulls. Regaining this level indicates the trend is shifting. $105,928 (Fib 0.618 - "Golden Pocket"): This is the most critical resistance. In technical analysis, a rejection here often leads to lower lows, while a clean break above usually targets the previous highs. $110,497 - $112,931 (Bearish Order Block / Weekly Support): The red box labeled W(S) (which acted as support previously) and Be-OB (Bearish Order Block) will likely act as strong resistance on the way back up. 3. The Projected Path (Red Line) The analyst has drawn a specific roadmap for recovery: The Bounce: A sharp rally from the current $89k support. The Retest: A move up to the 0.618 level ($105k), followed by a pullback (making a "Higher Low"). The Breakout: A surge through the $116k high. The Target: A final extension reaching the 1.618 Fibonacci level at roughly $133,123. 4. Indicators & Fibonacci Levels Fibonacci Retracement: The tool is drawn from the swing low ($89k) to the swing high ($116k). The current price returning to the 0 level indicates a 100% retracement of that specific swing. Moving Averages/Bands: The wavy lines (blue/red bands) appear to be compressing. The price is currently below the center line, indicating bearish momentum, but the "squeeze" often precedes a volatile move (breakout or breakdown). 5. Bearish Risks (The Alternative) Dashed Green Lines: Notice the dashed green lines pointing steeply downward below the current price. Breakdown Scenario: If the $89,121 support fails to hold, the structure breaks. The next logical supports would be psychological levels (e.g., $85k, $80k) or previous accumulation zones not fully visible on this zoom level. A break below $89k invalidates the specific bullish "W" projection drawn on the chart. Summary of Trade Setup (Based on Chart) ComponentLevel / ZoneSignificance Entry Idea$89,500 - $91,500Buying near the "0" support with tight risk management. Stop LossBelow $89,000A close below the recent wick low invalidates the thesis. Target 1$105,928The Golden Pocket (0.618 Fib). Target 2$116,316Previous Swing High. Target 3$133,1231.618 Fibonacci Extension (New ATH).