Technical analysis by hilmiyus about Symbol PAXG on 10/18/2025

پایان رالی صعودی؟ نمودار شگفتانگیز بازار که زنگ خطر ریزش را به صدا درآورده است!
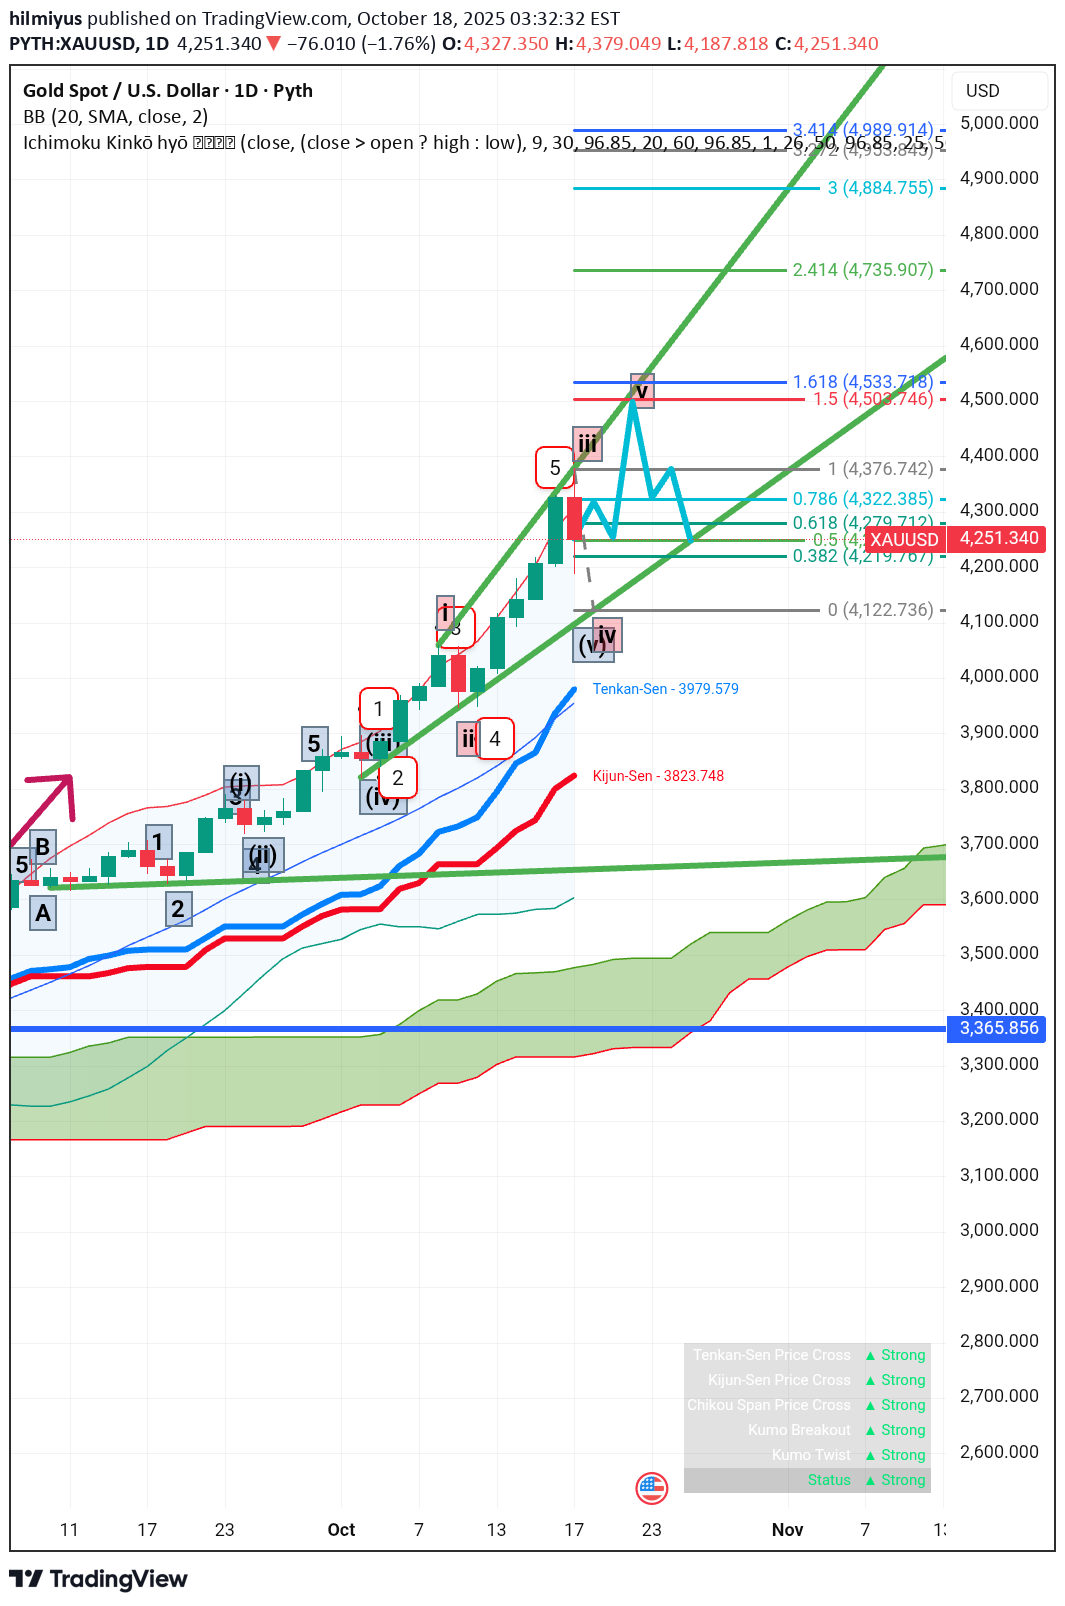
Two diverging trendlines that both slope upwards, creating a widening or megaphone shape on the chart. The price makes a sequence of higher highs (connected by the upper trendline) and higher lows (connected by the lower trendline). The distance between the highs and lows gets progressively wider. This signifies increasing price volatility and growing uncertainty in the market, as the fight between buyers and sellers becomes more aggressive and less controlled. It often appears at the end of a strong uptrend and signals that, despite the price making new highs, the buying power is becoming exhausted and sellers are starting to gain control. Look for a clear breakout below the lower trendline to confirm the pattern and signal a strong potential move to the downside (a bearish reversal).