Technical analysis by hilmiyus about Symbol ETH on 11/19/2025

تحلیل حساس قیمت اتریوم: آیا روند نزولی ادامه مییابد یا شاهد بازگشت صعودی هستیم؟
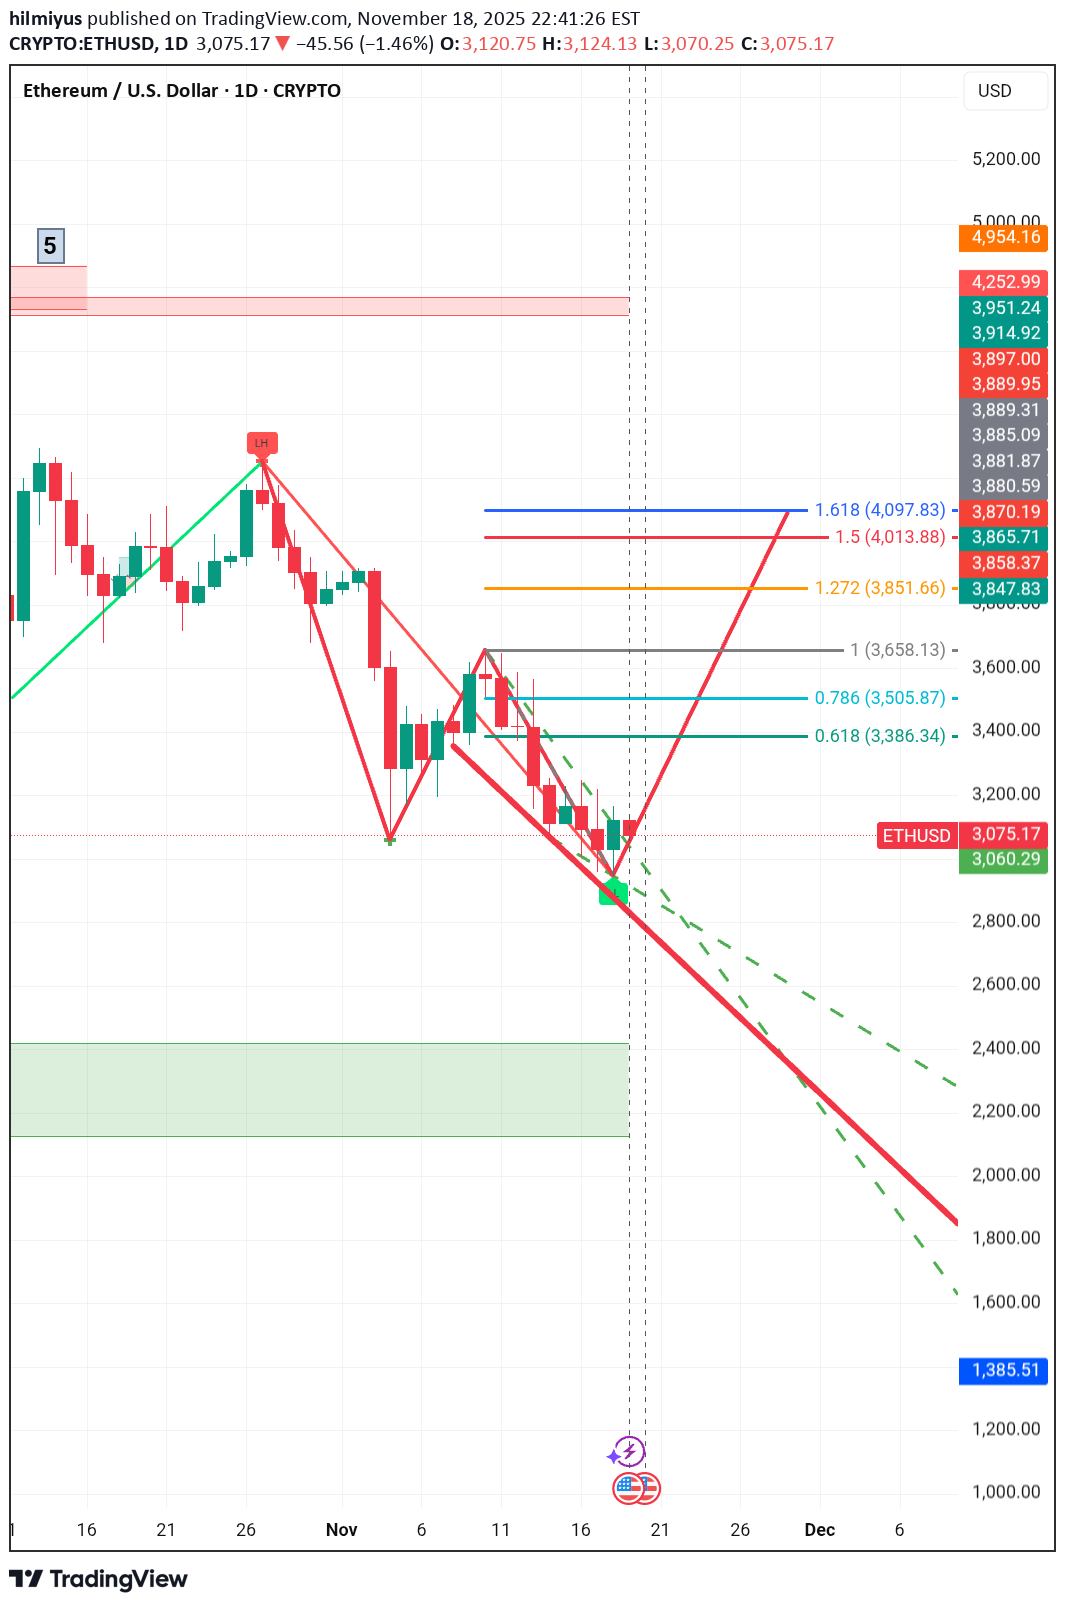
The chart shows that ETH/USD has been in a recent downtrend following a previous high near $4,250. Bearish Formation: A "Wedge" or "Falling Channel" pattern has been drawn, typically indicating a potential continuation of the existing trend (downtrend) or a possible reversal if broken to the upside. The price is currently trading within this descending structure. Current Price: The price is shown as $3,091.70. Potential Support: The price is resting near what appears to be a key horizontal support level around $3,060 - $3,200. Bearish Scenario (Continuation) The strong red dashed line and the large green box below suggest a significant bearish outlook if the current support fails. Breakdown Target: If the price breaks the current support and the lower boundary of the drawn wedge/channel, the next significant support or target area is a green box (likely a high-volume node or demand zone) between approximately $2,200 and $2,500. Extreme Bearish Target: The ultimate bearish target, following the long red dashed line, points towards the $1,385.51 level. This suggests a long-term continuation of the downtrend. 🐂 Bullish Scenario (Reversal) A Fibonacci Extension tool has been used on a recent swing, suggesting potential upside targets if a reversal occurs. Immediate Resistance: The upper boundary of the descending channel (dashed green line) and the immediate Fibonacci retracement levels will act as resistance. Fibonacci Targets: The extension levels provide specific price targets for a potential upward movement: 1.272 Extension (Orange): $3,851.66 1.5 Extension (Red): $4,013.88 1.618 Extension (Blue): $4,097.83 Reversal Trigger: A strong close above the descending dashed trendline and potentially the $3,658.13 level (the 1 extension, or a recent swing high) would confirm a bullish trend change toward these targets. Conclusion The chart presents a critical juncture for ETH/USD: Bearish Confirmation: A break below $3,060 would likely validate the downtrend towards $2,500. Bullish Confirmation: A break above the dashed channel line and the $3,658 level would suggest a bullish reversal targeting the $3,850 to $4,100 range.