Technical analysis by hilmiyus about Symbol PAXG on 10/27/2025

تحلیل تکنیکال: آیا روند صعودی قدرتمند ادامه دارد یا اصلاح عمیق در راه است؟
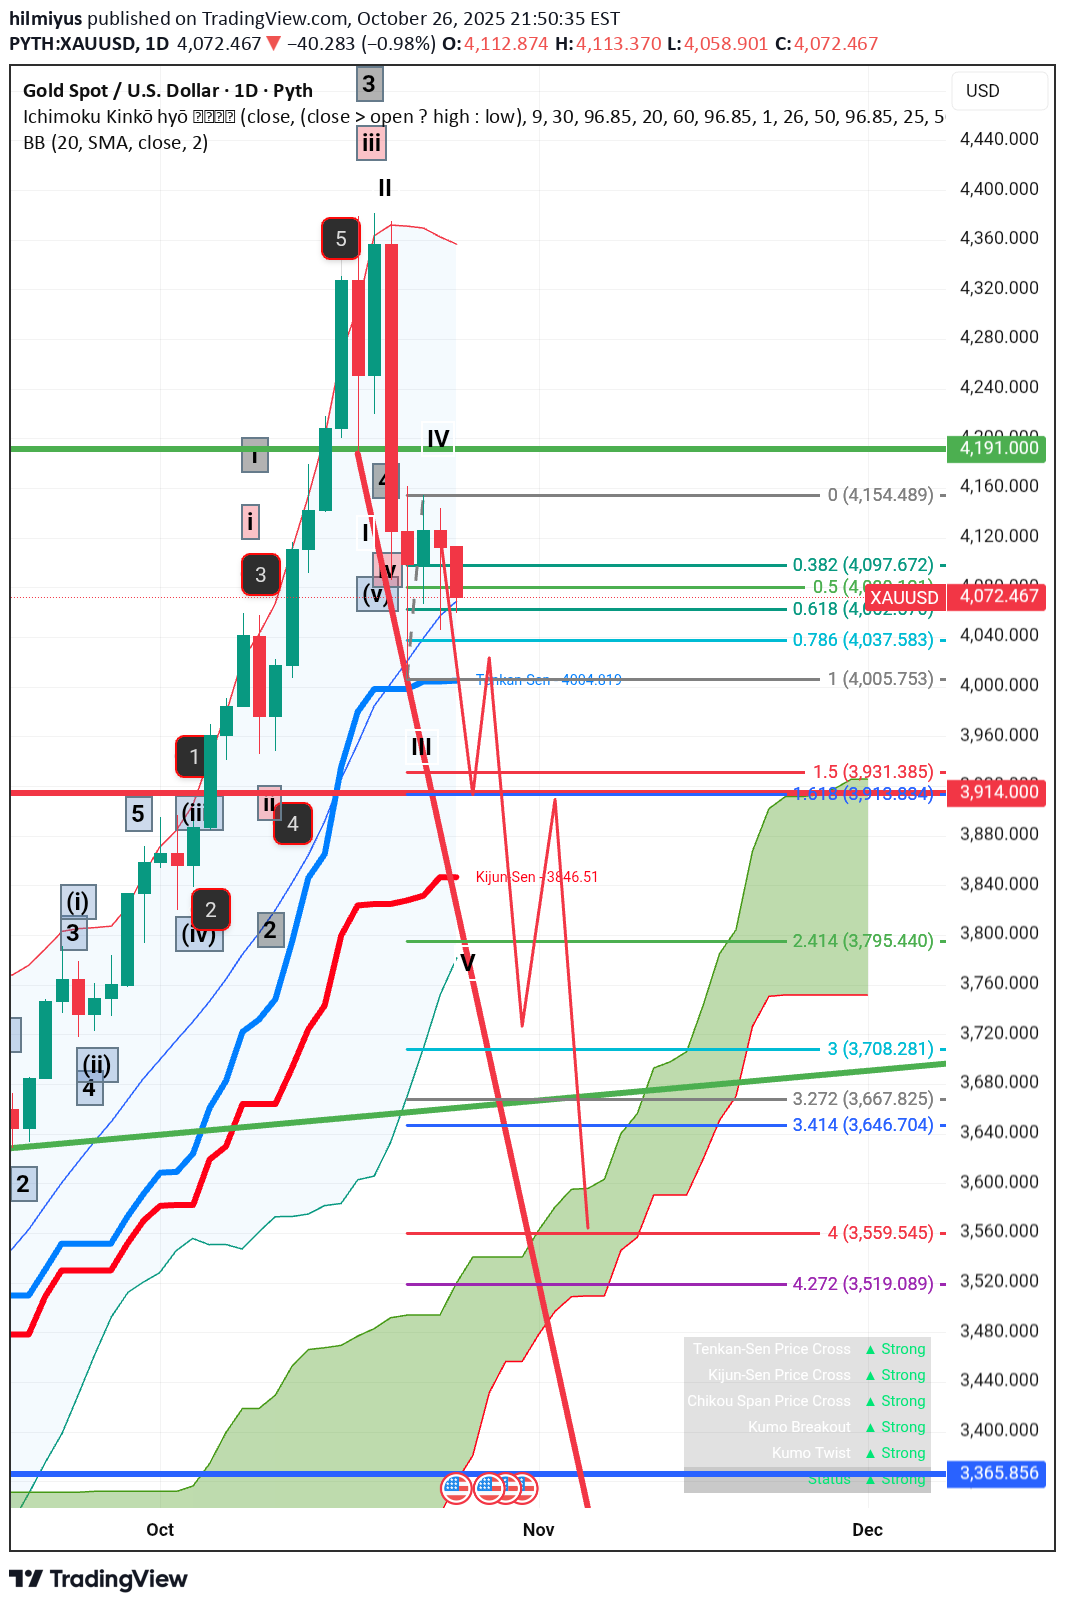
Current Price: The last closing price is 4,073.630, which is down $39.120 (-0.95%) from the previous close. Bollinger Bands (BB): BB (20, SMA, close, 2): Middle band is 4,069.017. The price is currently near the middle Bollinger Band. Ichimoku Kinko Hyo: Tenkan-Sen (Red/Blue line): Not explicitly labeled with a value, but the line represents a short-term average (typically 9 periods). Kijun-Sen (Red line): The value is 3,846.51. This is a longer-term average (typically 26 periods) and acts as a strong support/resistance line. The price is currently well above it, suggesting a bullish bias on the longer term. Kumo (Cloud - Green/Red shaded area): The cloud is currently green (leading span A above leading span B) and thickening, which typically indicates a strong bullish trend. The price is far above the cloud. Status Indicators (Bottom Right): The Ichimoku components are all signaling "Strong" bullish signals: Tenkan-Sen Price Cross: Strong Kijun-Sen Price Cross: Strong Chikou Span Price Cross: Strong Kumo Breakout: Strong Kumo Twist: Strong Status: Strong Price Action and Patterns Elliott Wave Labeling: The chart uses Roman numerals (i, ii, iii, iv, v) and Arabic numerals (1, 2, 3, 4, 5) to suggest a completed or nearly completed impulsive wave pattern: A five-wave impulse appears to have completed (or peaked) at the price high of around 4,375. This high is labeled with a circled 5 and a Roman numeral III (likely the end of the larger degree wave 3). The subsequent price drop (the large red candle) suggests the start of a correction, possibly a wave IV (Roman numeral) or a new corrective pattern. Fibonacci Retracement: A Fibonacci retracement tool is drawn from the recent high (4,154.489 or slightly higher) down to a recent low (implied for the current correction). The current price (4,073.630) is near the 0.618 retracement level at 4,079.530 and the 0.5 level at 4,047.889. The 0.618 level is a significant retracement target for corrective waves. Holding above it suggests the correction might be shallow, while breaking below it could lead to a deeper drop toward the 0.786 level (4,005.753). Support/Resistance Levels: Immediate Resistance: The top of the recent consolidation/high, labeled 'IV' around 4,154.000. Strong Support: The Kijun-Sen at 3,846.51. Major Support: The bottom of the cloud (Kumo) and a previous swing low around 3,365.856. However, the recent price action indicates a short-term correction is underway, likely after a significant upward impulse move. The price is currently testing a critical level near the middle Bollinger Band and the 0.618 Fibonacci retracement. If the price holds above the 0.618 level (~4,079) and reverses, it suggests the correction is minor, and the uptrend (Wave V in Elliott Wave terms) could resume quickly. If the price breaks significantly below the 0.5 level (~4,047) and the 0.786 level (~4,005), it indicates a deeper corrective wave is in play, potentially targeting lower Fibonacci levels or the Kijun-Sen.