Technical analysis by hilmiyus about Symbol PAXG on 10/21/2025

تحلیل میانمدت تا بلندمدت: سطوح کلیدی مقاومت و حمایت (با تمرکز بر روند صعودی قوی)
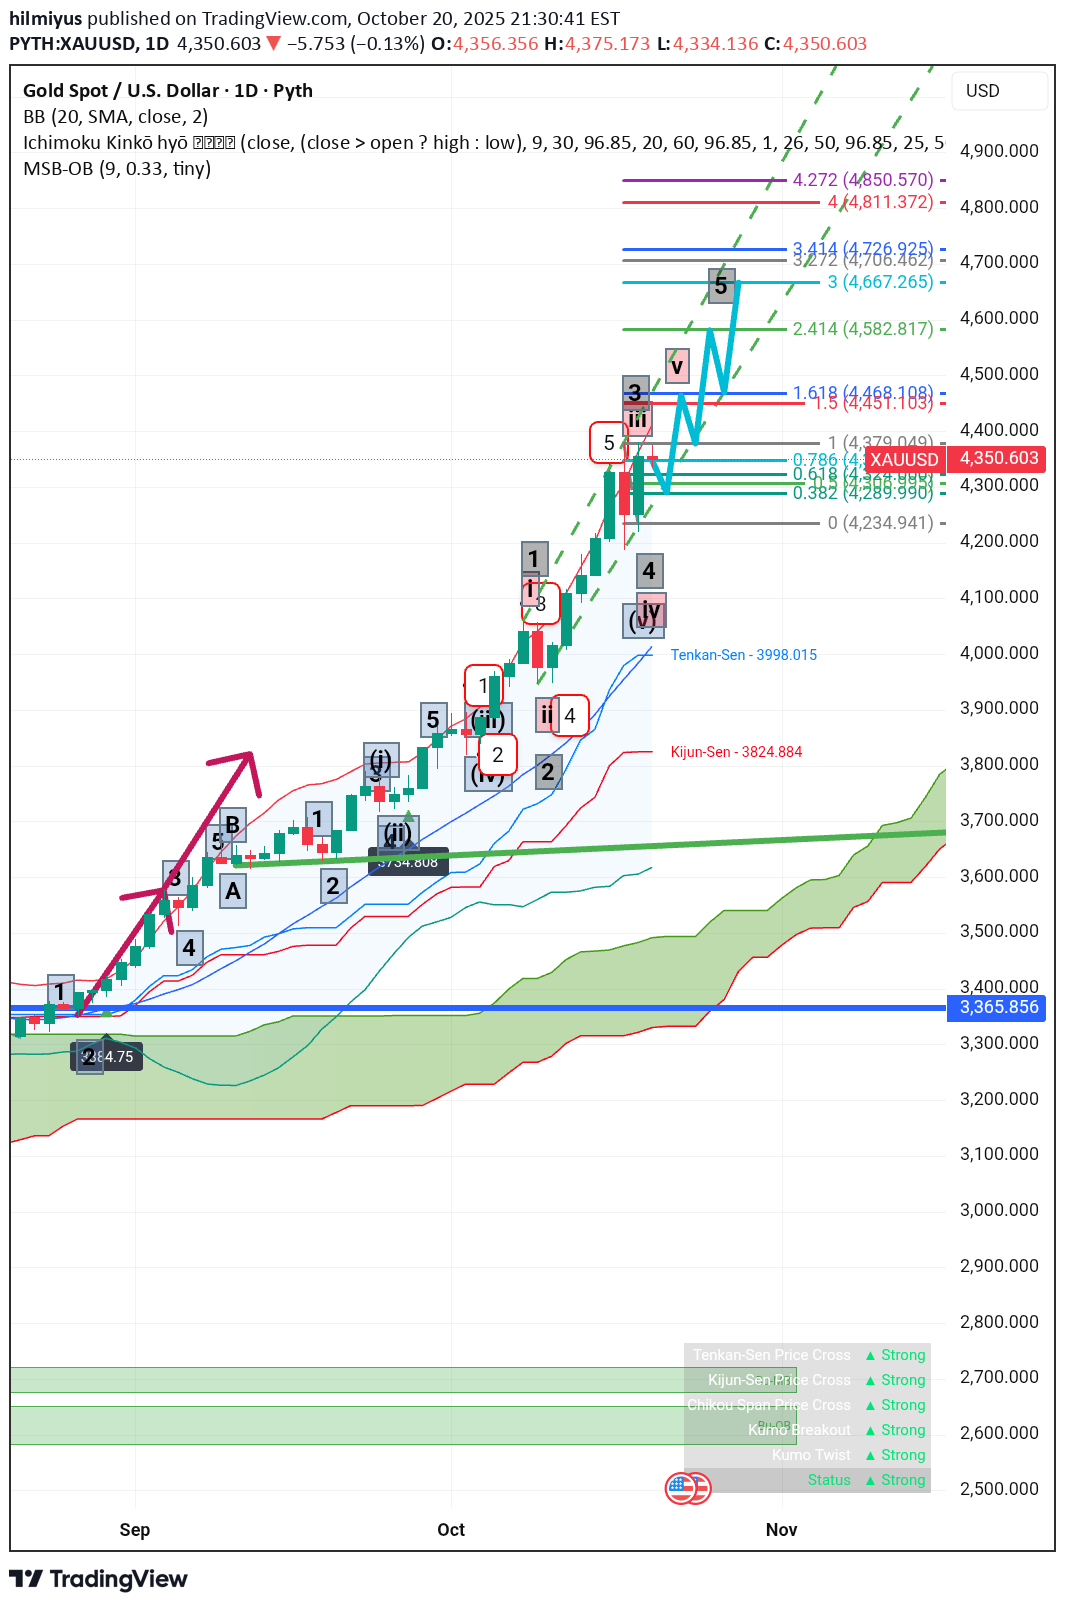
The chart shows a daily (1D) timeframe, suggesting a focus on medium-to-long-term trends. The current price is around $4,350.855. Resistance and Support The immediate and significant resistance is identified at the $4,451.10 level, corresponding to a labeled point 1.618 (likely a Fibonacci extension level). Other labeled resistance levels above the current price include: 4,582.817 (labeled 2.414) 4,667.265 (labeled 3) 4,720.242 (labeled 3.414) The highest labeled resistance is 4,850.570 (labeled 4.272). Support levels from the Fibonacci tool are near the current price: 4,343.435 (labeled 0.786) 4,328.885 (labeled 0.618) 4,285.885 (labeled 0.382) The price is currently well above the Ichimoku Cloud (Kumo), which is green and trending upward, indicating a strong bullish trend. Tenkan-Sen (Conversion Line): 3,998.015 (Blue line) Kijun-Sen (Base Line): 3,824.884 (Red line) The price is significantly above both the Tenkan-Sen and Kijun-Sen, reinforcing the strong momentum and bullish signal. A Tenkan-Sen/Kijun-Sen Price Cross is flagged as 'Strong' in the status table, confirming this. The price is trading near the upper band of the Bollinger Bands (BB (20, SMA, close, 2)), which typically suggests the price is becoming overbought or is at the peak of a strong directional move. The 20-period Simple Moving Average (SMA) is currently at 4,013.739. Since the price is far above the SMA, it further supports the strong upward trend.