
Risk_Adj_Return
@t_Risk_Adj_Return

What symbols does the trader recommend buying?
Purchase History
پیام های تریدر
Filter
Risk_Adj_Return
Bitcoin and Gold Analysis + Macro economy
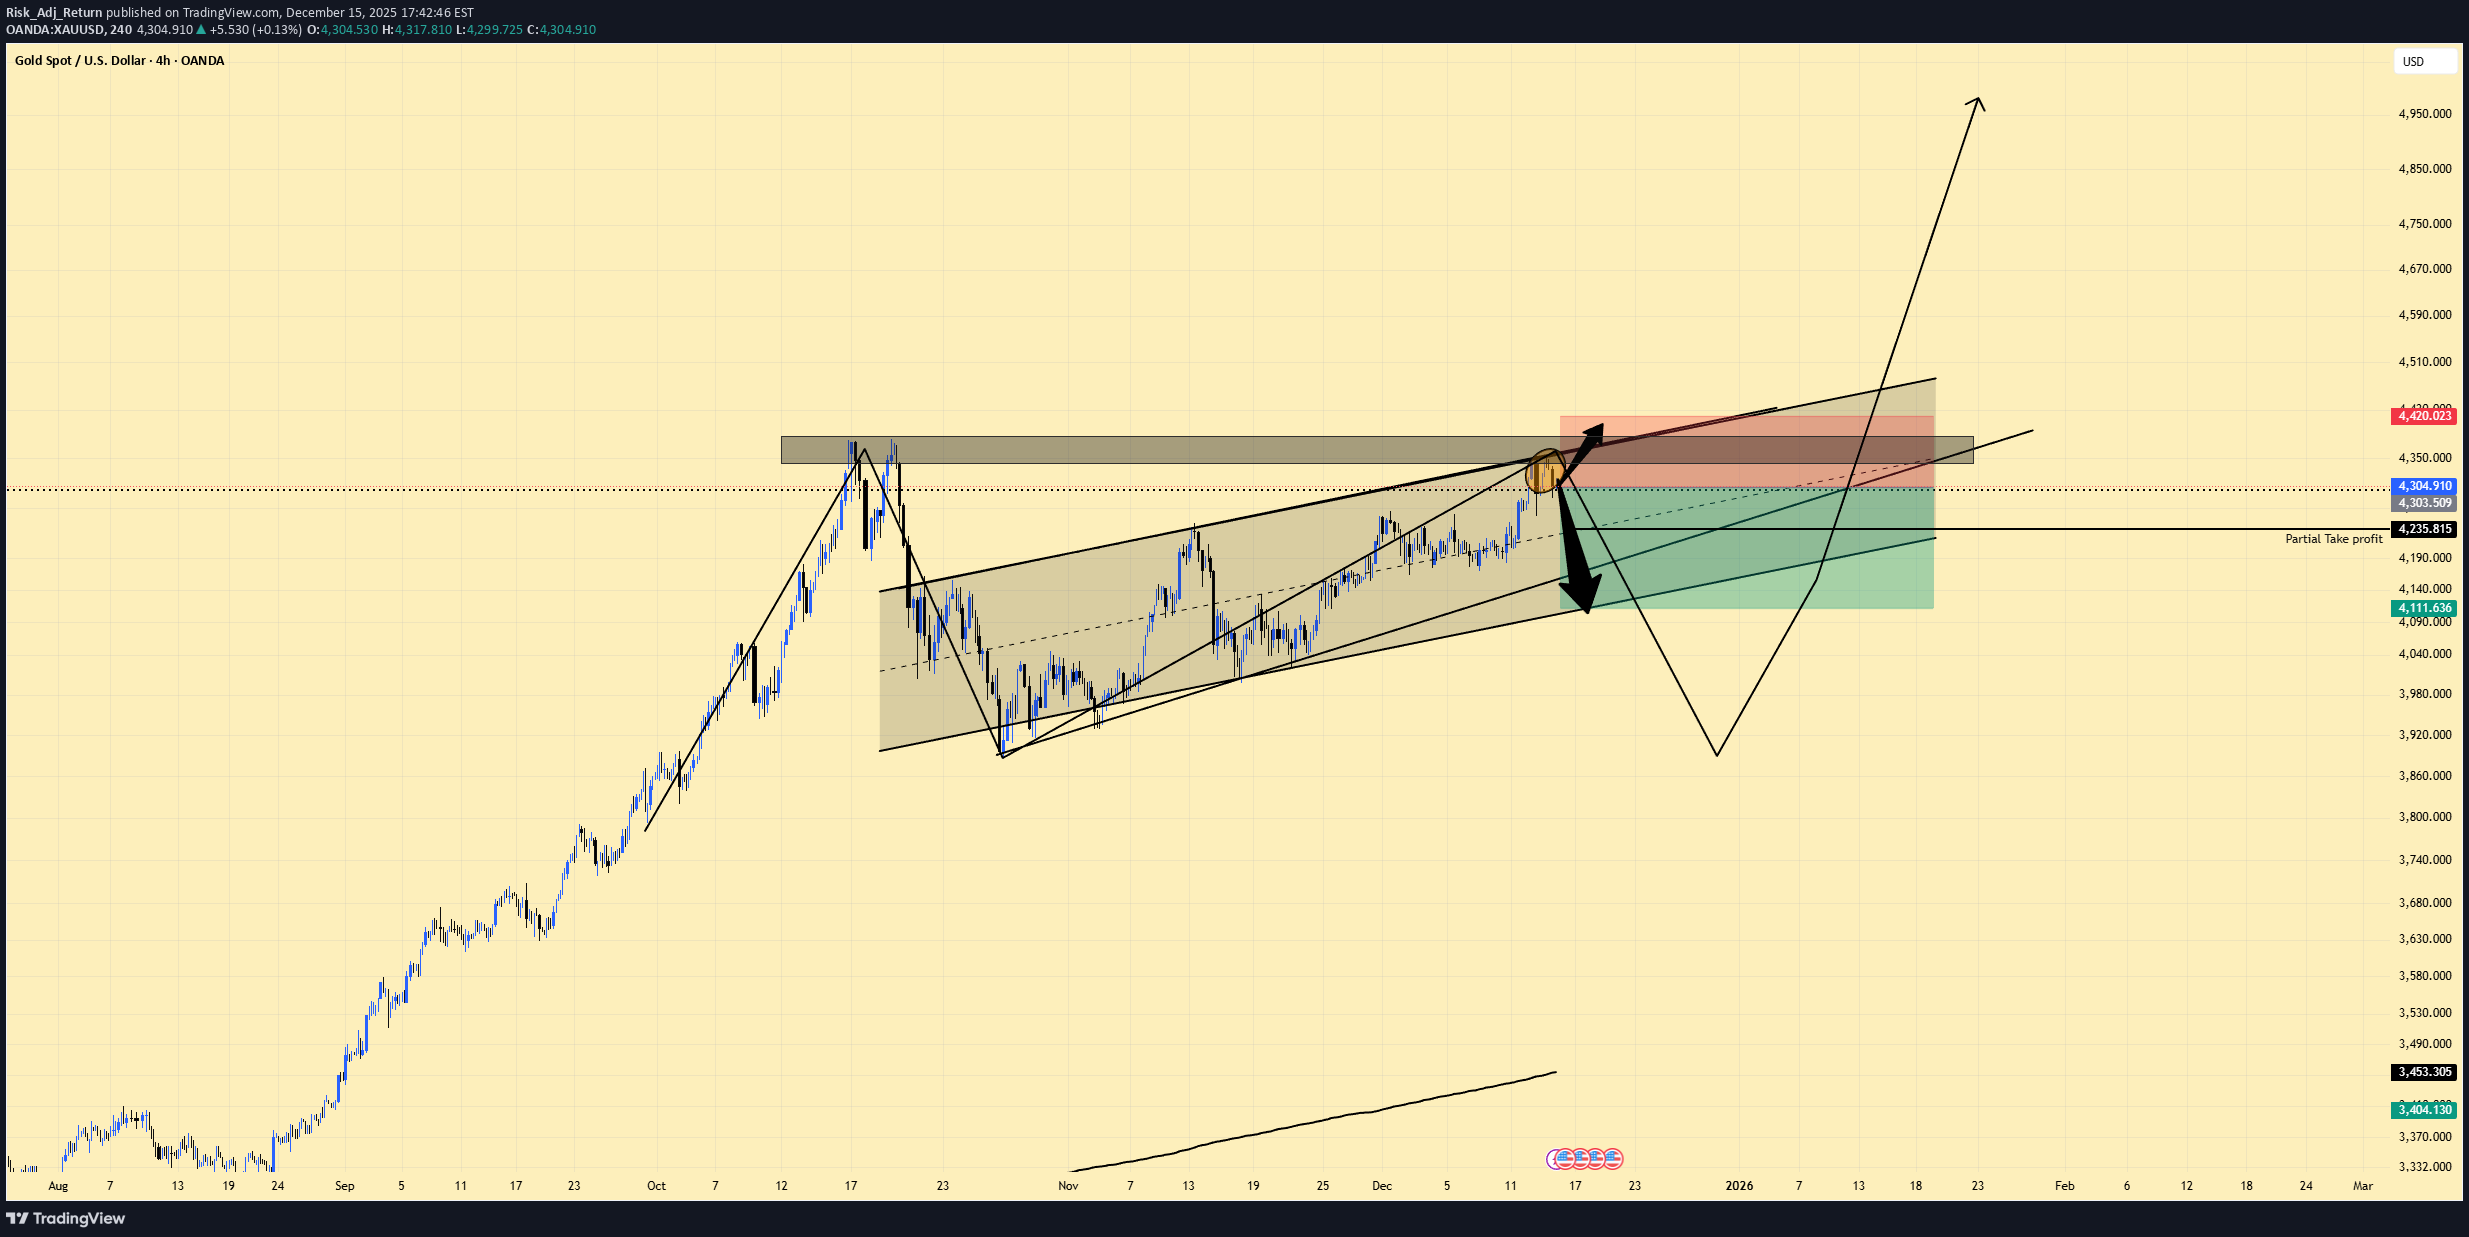
So we’re watching what the S&P 500 is doing, what Bitcoin looks like, and how gold is behaving, to understand where the market is heading. The most important thing is to watch confluence and stack signals on top of each other. We’ve gone through several indicators, different market views, and perspectives from multiple traders. On top of that, we looked at a few macro charts to understand what’s happening in the bigger picture and what it actually means for us. If you like this video, give it a like. If we reach 10+ likes, I’ll make another video on this topic. And let me know in the comments what you’d like me to cover next.
Risk_Adj_Return
Ethereum Analysis + Correlation of Bitcoin + Advanced TA
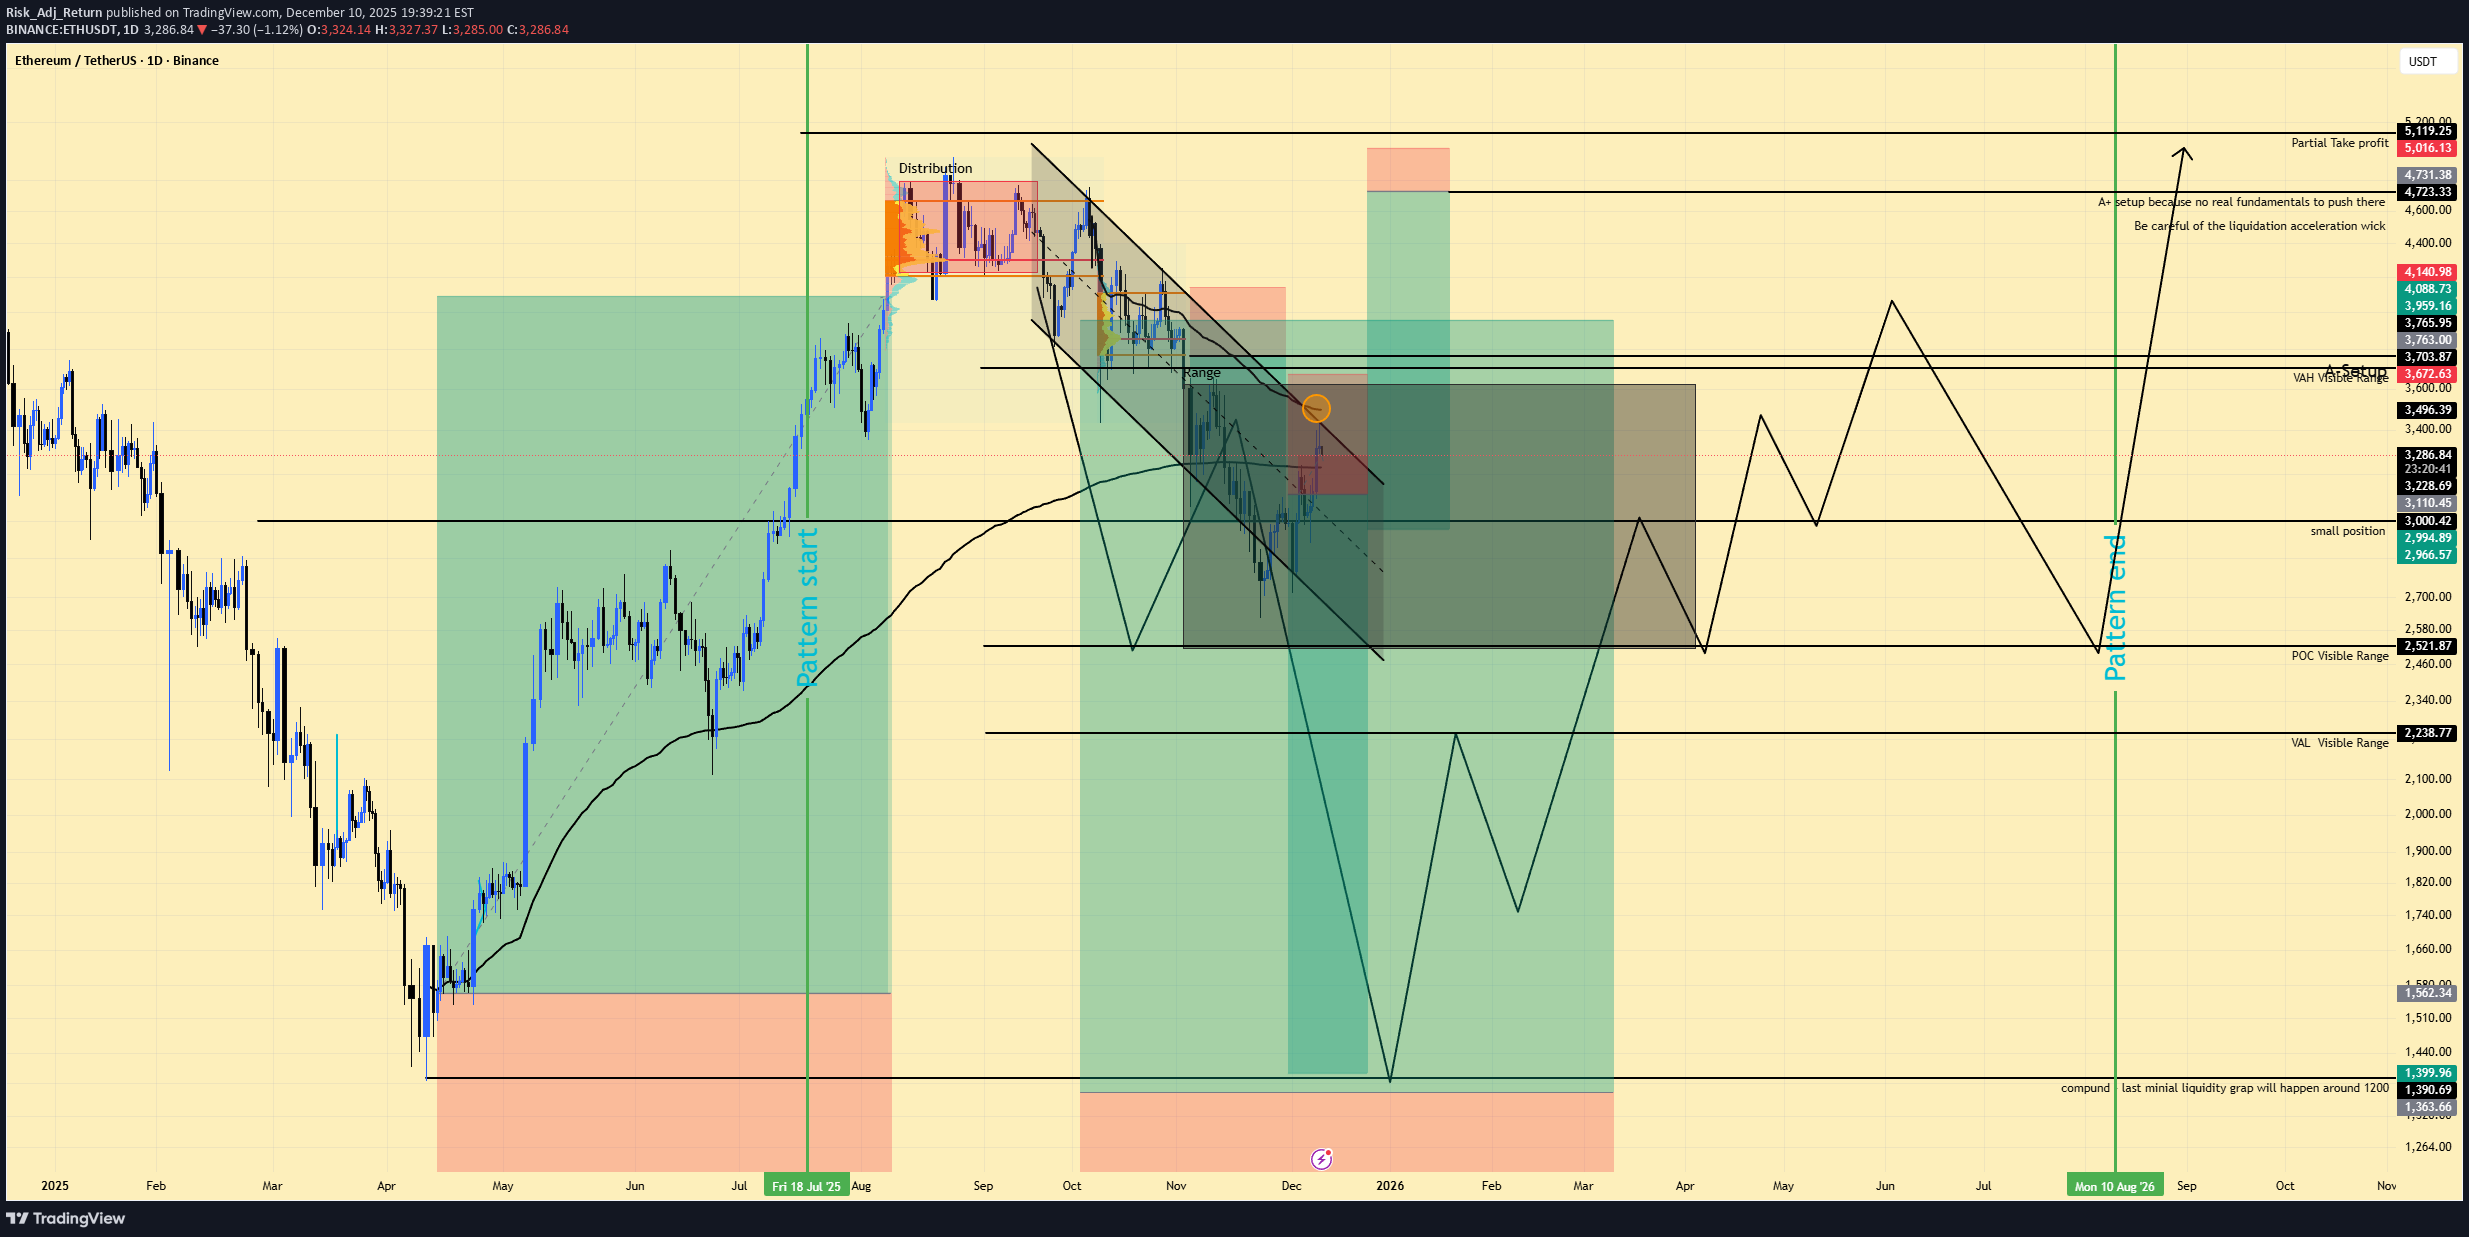
How can you analyze Ethereum deeply using volume, visible range, and RSI, together with technical and correlation analysis in the crypto space? How does correlation work between Bitcoin and Ethereum? And additionally, how do I personally approach technical analysis, where to look right now on Ethereum itself, and which direction the market and the crypto space are moving? If this video reaches 10 likes or more, I will do an update on that. Until then, I wish you the best. And if you like the video, don’t forget to comment, like, and share. Also, leave me a comment below on which asset I should talk about next, or which strategies or problems you are currently facing in trading. Happy to help, just share it in the comments. And let me know as well if you like this type of video, Face sharing.
Risk_Adj_Return
Warren Buffet View on Market + TSLA Position
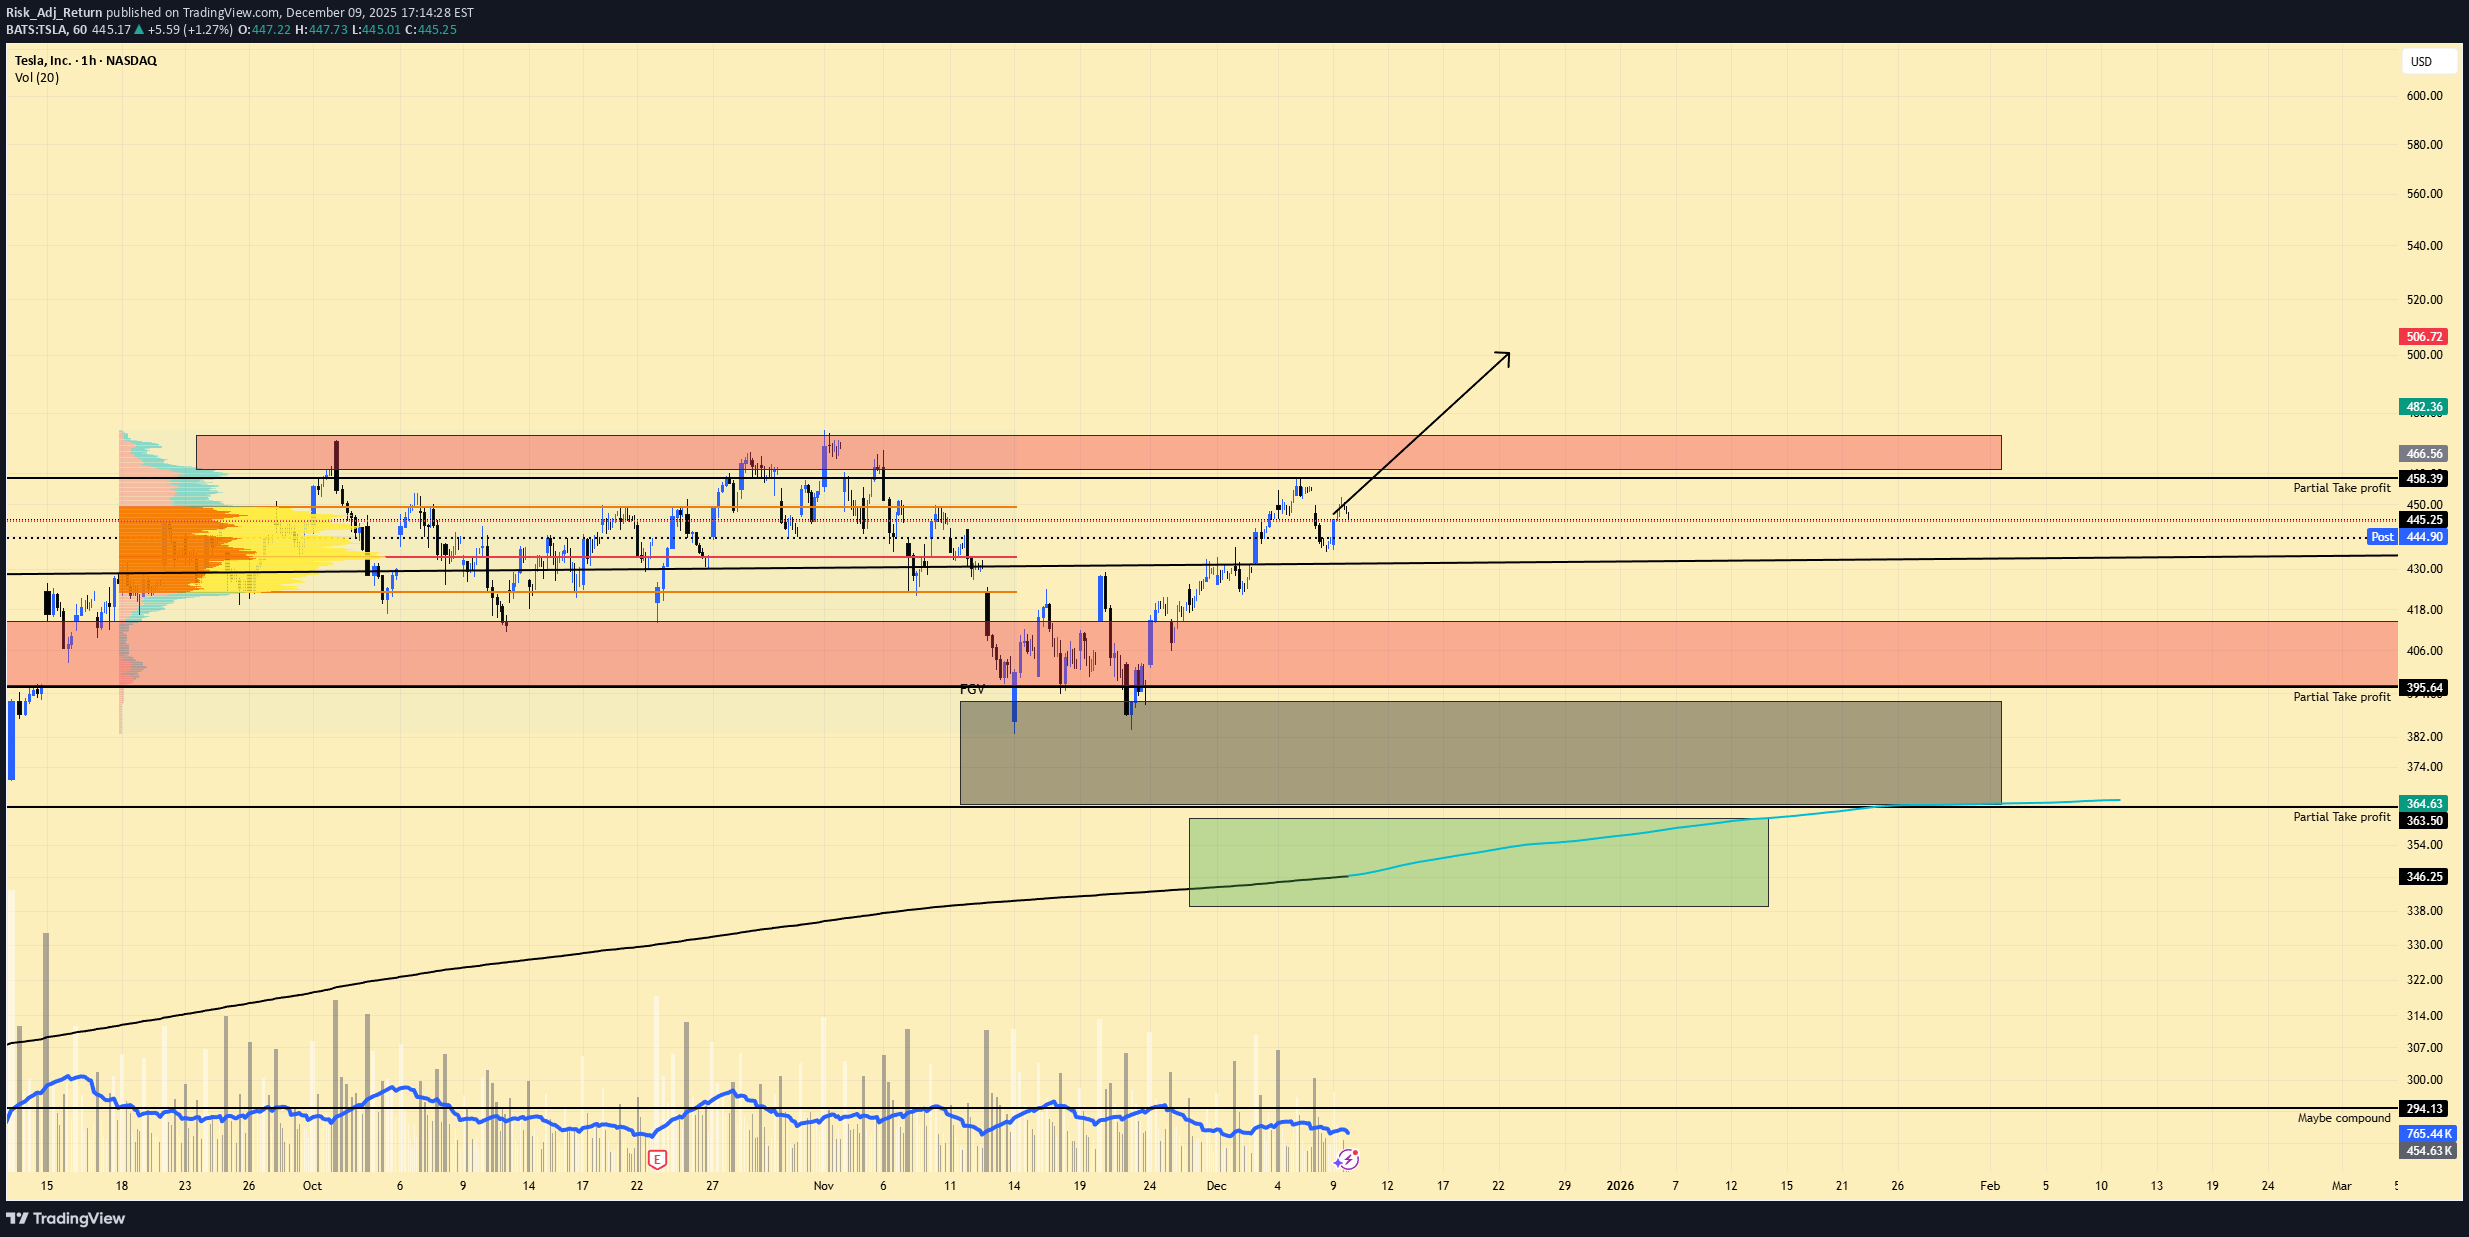
So over here, we have done quite a Tesla analysis. Our view on the markets, where the fear and greed index is and what it is telling us, what the Federal Reserve is doing, and where the market is going based on that. Also what history has told us when the Fed cuts rates very fast. If you like this video, give it a like. And if we reach more than 10 likes, I will give an update on that section. And share your views in the comments on which next talk or analysis you would like me to do next time.
Risk_Adj_Return
Where is the market going in Dezember 2025
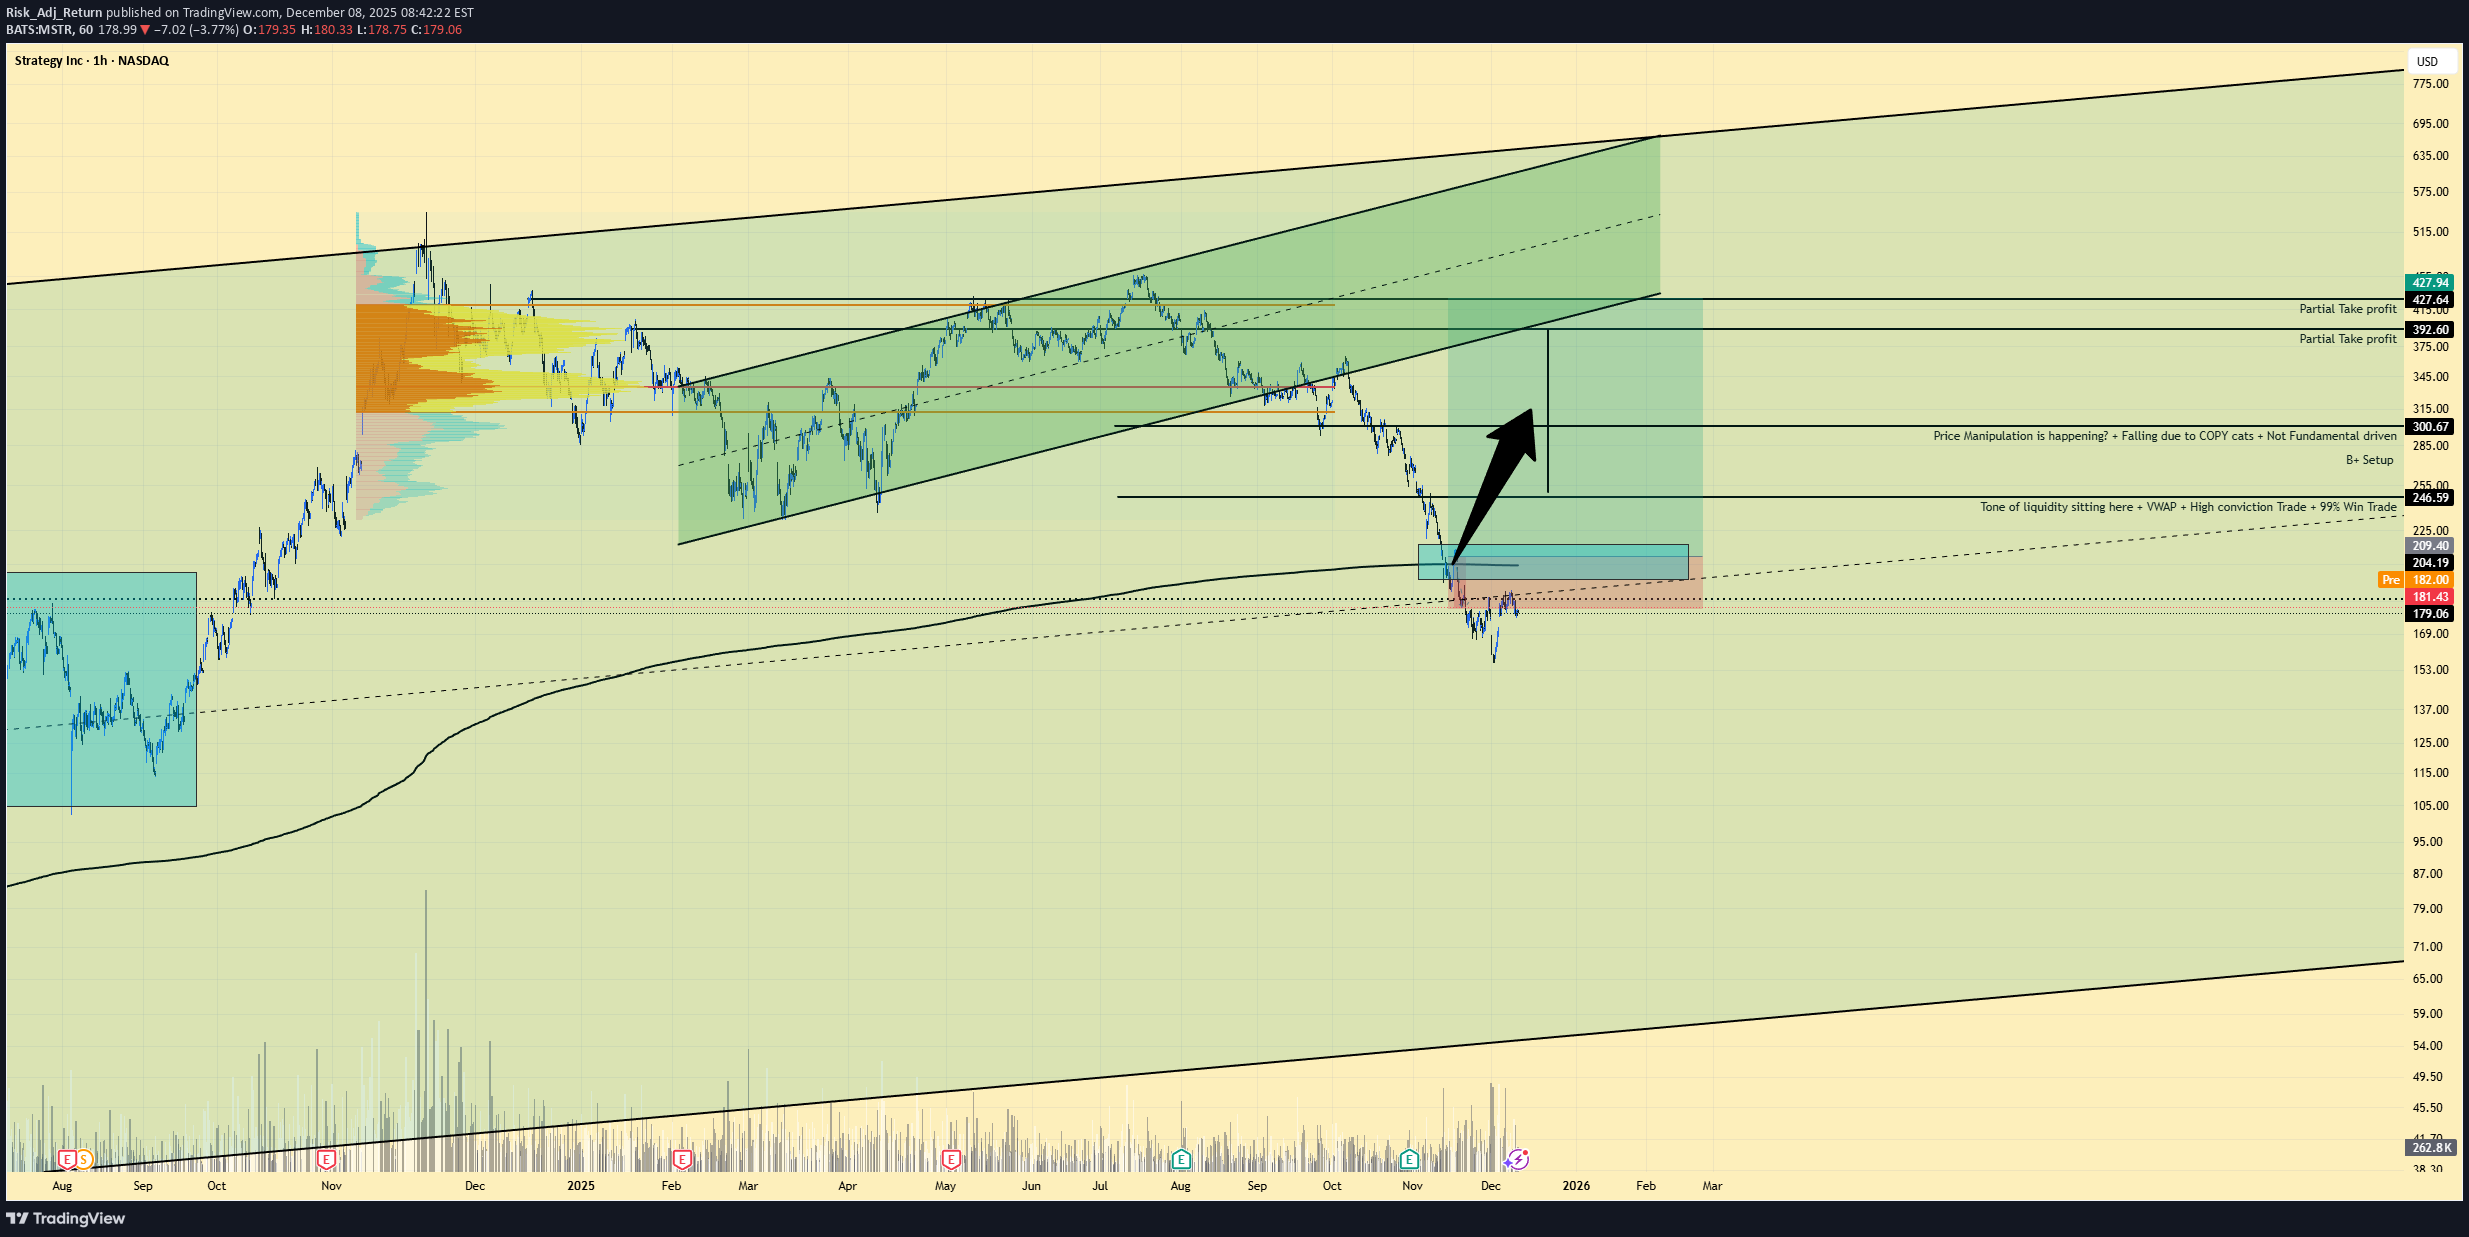
If we reach 10 likes over here, I will do another update on what we are looking for. Up, down, sideways, everything in between. In this video, you will know that.
Risk_Adj_Return
شانس فروش سولانا (SOL) از کجا آغاز میشود؟ تحلیل تکنیکال دقیق با اهداف قیمتی جدید
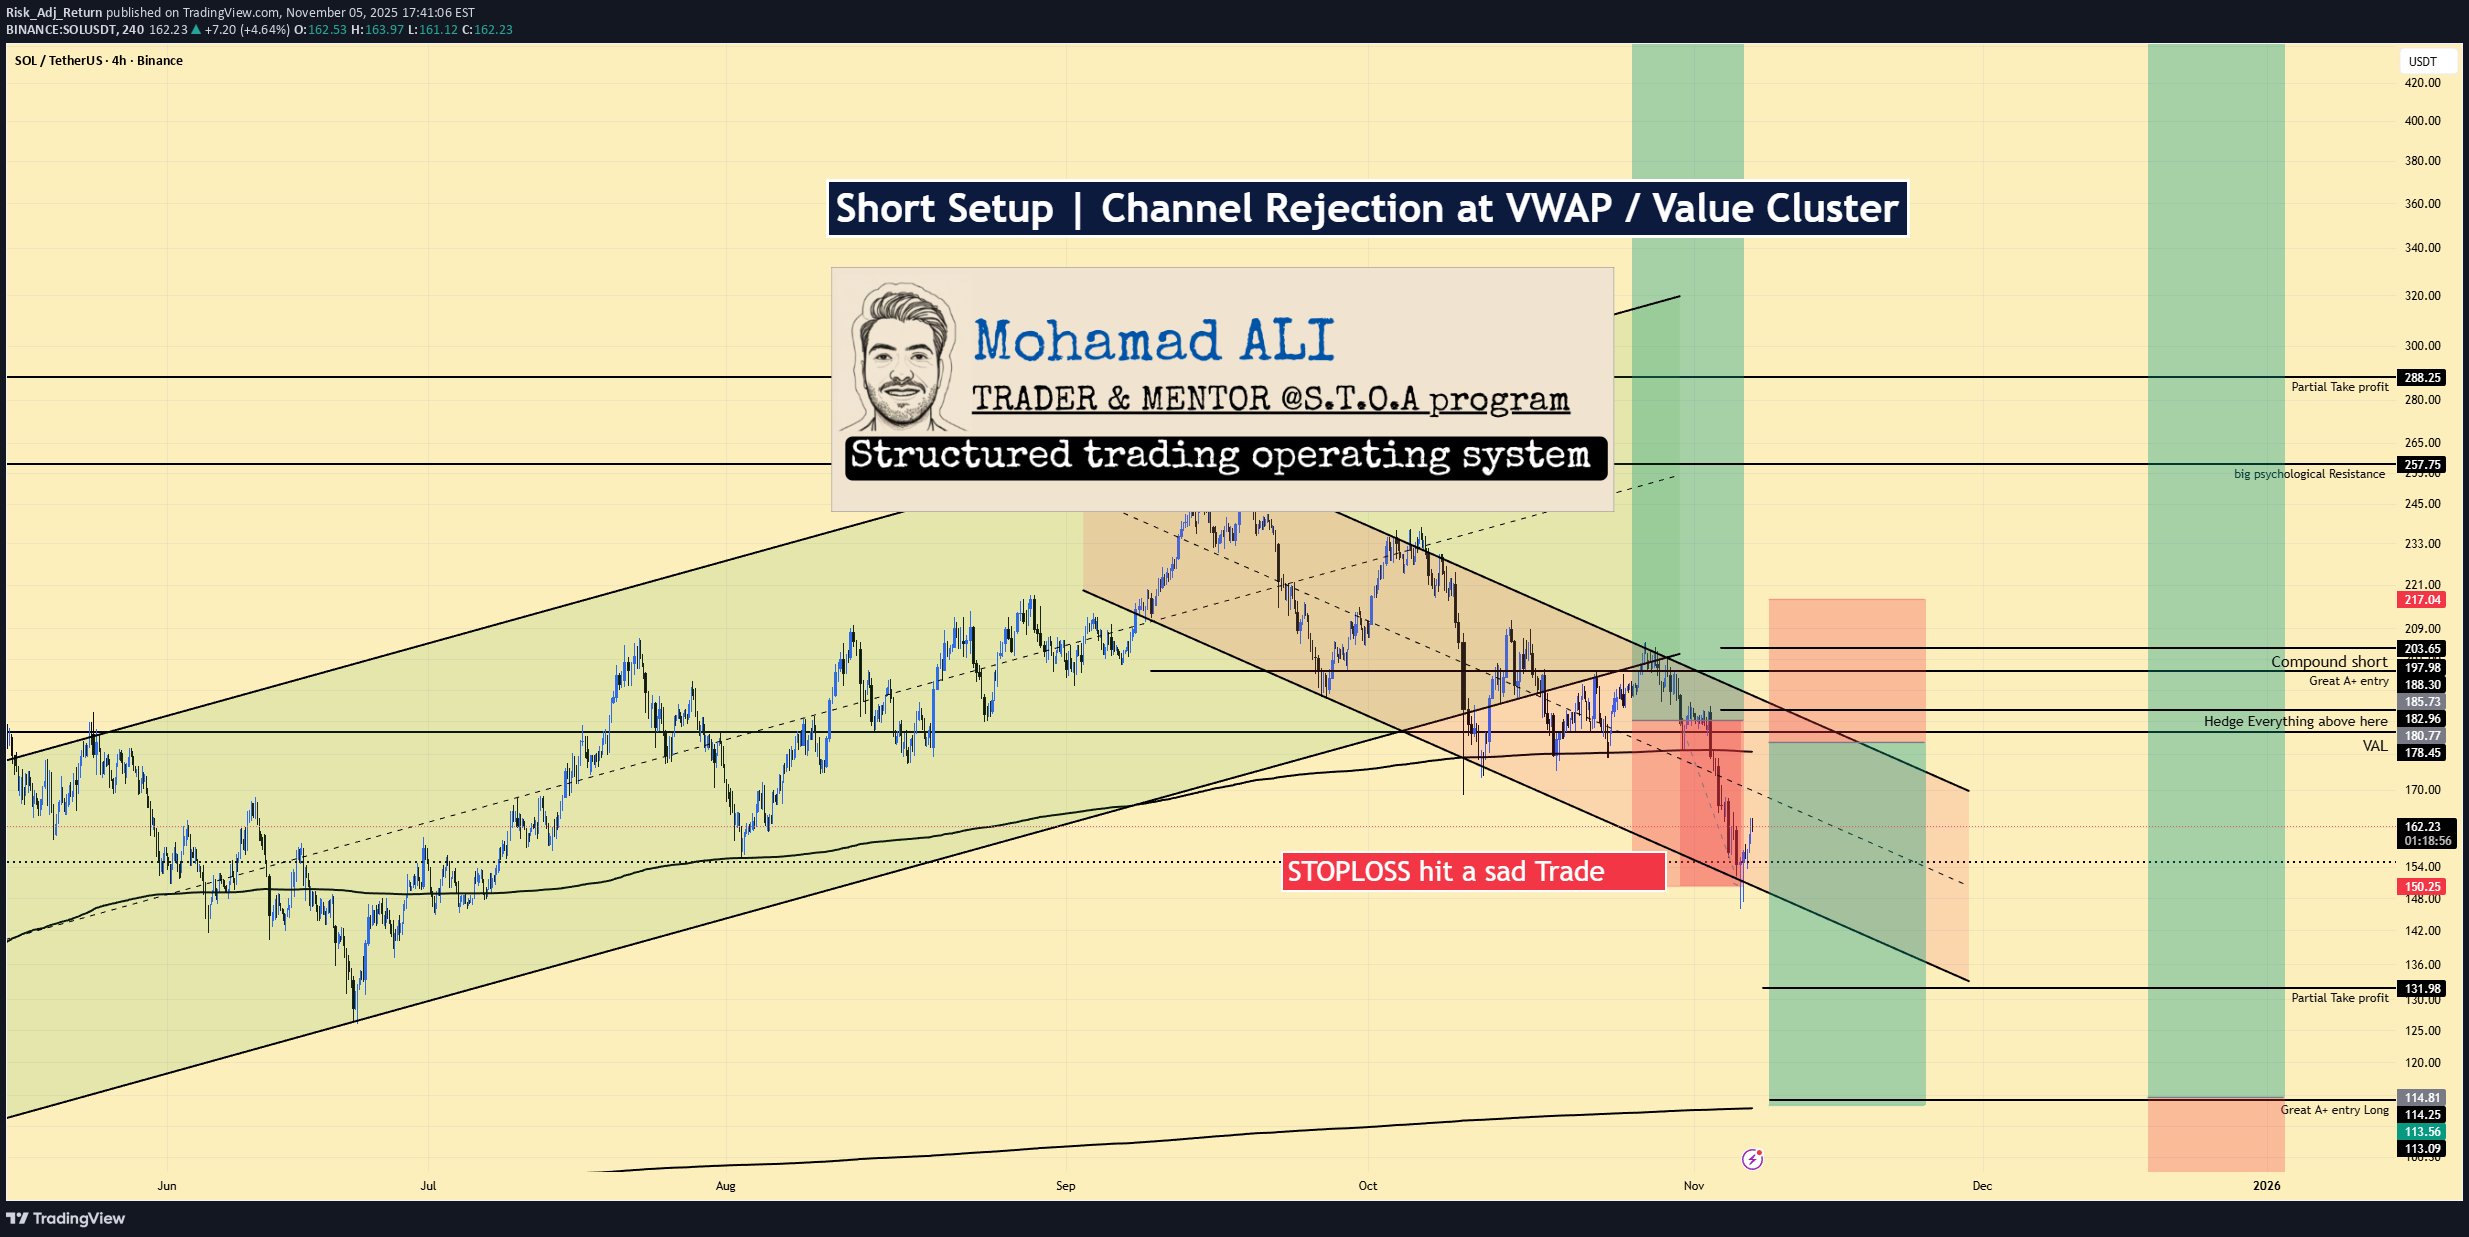
SOLUSDT | Short Setup | Channel Rejection at VWAP / Value Cluster | Nov 5, 2025 🔹 Thesis Summary SOL is bouncing inside a descending parallel channel. A push into the 188–203 supply band (VWAP/value cluster) offers a defined-risk short back toward 150/132 as broad crypto remains correlation-heavy and fragile. 🔹 Trade Setup Bias: Short Entry Zone: 188–203 (prior supply; confluence with anchored VWAP/upper channel) Stop Loss: 217 (acceptance above supply → invalidate short idea) Take-Profits: TP1: 150 (mid-channel / liquidity shelf) TP2: 132 (prior reaction / partial-TP on chart) TP3 (stretch): 114 (channel lower bound / “A+ long” area) Indicative R:R (mid-fill 195 vs 217): If filled closer to 1.88, R:R compresses; closer to 203, it expands. Laddering helps execution. 🔹 Narrative & Context Structure: Clear lower highs/lows within a well-defined downward channel. The 188–203 zone aligns with prior distribution, multiple failed breakouts, and a visible liquidity pocket just under 200. VWAP & Value: Price frequently mean-reverts to the anchored VWAP from the prior breakdown; 188–195 is the first area where sellers historically regain control. Correlation: Crypto remains tightly co-moving; beta shocks propagate across majors. Breadth is weakening on alts first—typical of the distribution → correction phase. Execution: Look for a bounce into 188–203 with positive funding and rising OI (late longs) and fading spot CVD—then fade the move with tight invalidation. A clean break/hold above 217 flips bias. 🔹 Valuation & Context (Pro Metrics, Framed Simply) Perp Funding → Peer/Historical: Positive/expanding into resistance vs neutral on BTC → crowded long into supply → increases squeeze-then-fade odds → supports short timing. Open Interest → Regime Check: OI rising with price into 188–203 vs flat spot flows → leverage leading → greater liquidation risk on pullback → aligns with targets 150/132. SOL/BTC Cross → Relative Strength: Underperformance on bounces vs BTC/ETH → weaker risk appetite for SOL beta → rallies likely sold at value → fits channel-fade plan. Basis (Perp Premium) → Thresholds: Premium > ~10–15% annualized vs spot → stretched leverage → signals to scale shorts; flat/discount basis → stand aside. 🔹 Contrarian Angle (Your Edge) Consensus leans “SOL leadership continues.” Our read: supply sits heavy at 188–203, VWAP caps, and leverage rebuilds into resistance. That combination often precedes a second leg lower toward 150 → 132, with an extension to 114 before any durable base. Long-term bull case remains intact after a proper reset (W-base risk). 🔹 Risks Impulsive risk-on (index squeeze, dovish macro) forcing acceptance above 217. SOL-specific catalysts (ecosystem launches/flows) that negate supply. Liquidity gaps/wick risk: thin books can overshoot levels; size and ladder accordingly. 🔹 Macro Considerations DXY firm + VIX bid support a broader correction; a vol crush or dollar fade weakens the short. Semis/NQ drive cross-asset beta; strength there argues patience. BTC dominance up → alt underperformance risk; BTC breakdown, however, accelerates the path to 150/132. 🔹 Bottom Line Tactical short the rip into 188–203 with hard invalidation at 217. Manage into 150/132, stretch to 114 if macro stays risk-off. Keep sizing conservative, respect correlation, and hedge. 🔹 Forward Path If this gains traction (10+ likes), I’ll post: A weekly-frame update of the channel/VWAP map Playbook if 217 breaks (what flips the bias) Execution notes (laddering, hedge overlays, basis/funding triggers) Like & Follow for structured ideas, not signals. I post high-conviction setups here before broader narratives play out. ⚠️ Disclaimer: This is not financial advice. Do your own research. Charts may include AI-assisted enhancements. 🔹 Footnote Forward P/E: Price divided by expected earnings over the next 12 months. Lower = cheaper relative to profits. P/FCF (Price-to-Free-Cash-Flow): Price vs. the cash left after investments. A measure of efficiency. FCF Yield: Free cash flow per share ÷ price per share. Higher = more cash returned for each dollar invested. ROE (Return on Equity): Net income ÷ shareholder equity. Shows management efficiency with investor capital. ROIC (Return on Invested Capital): Net income ÷ all invested capital (equity + debt). A purer profitability gauge. Debt/Equity: Debt divided by equity. <1 usually means balance sheet is conservative. R:R (Risk-to-Reward): Ratio of expected upside vs. downside. 3:1 = you risk $1 to make $3.
Risk_Adj_Return
پیشبینی ریزشی اتریوم (ETH): فرصت شورتگیری با استراتژی VWAP تا ۳۰۰۰ دلار!
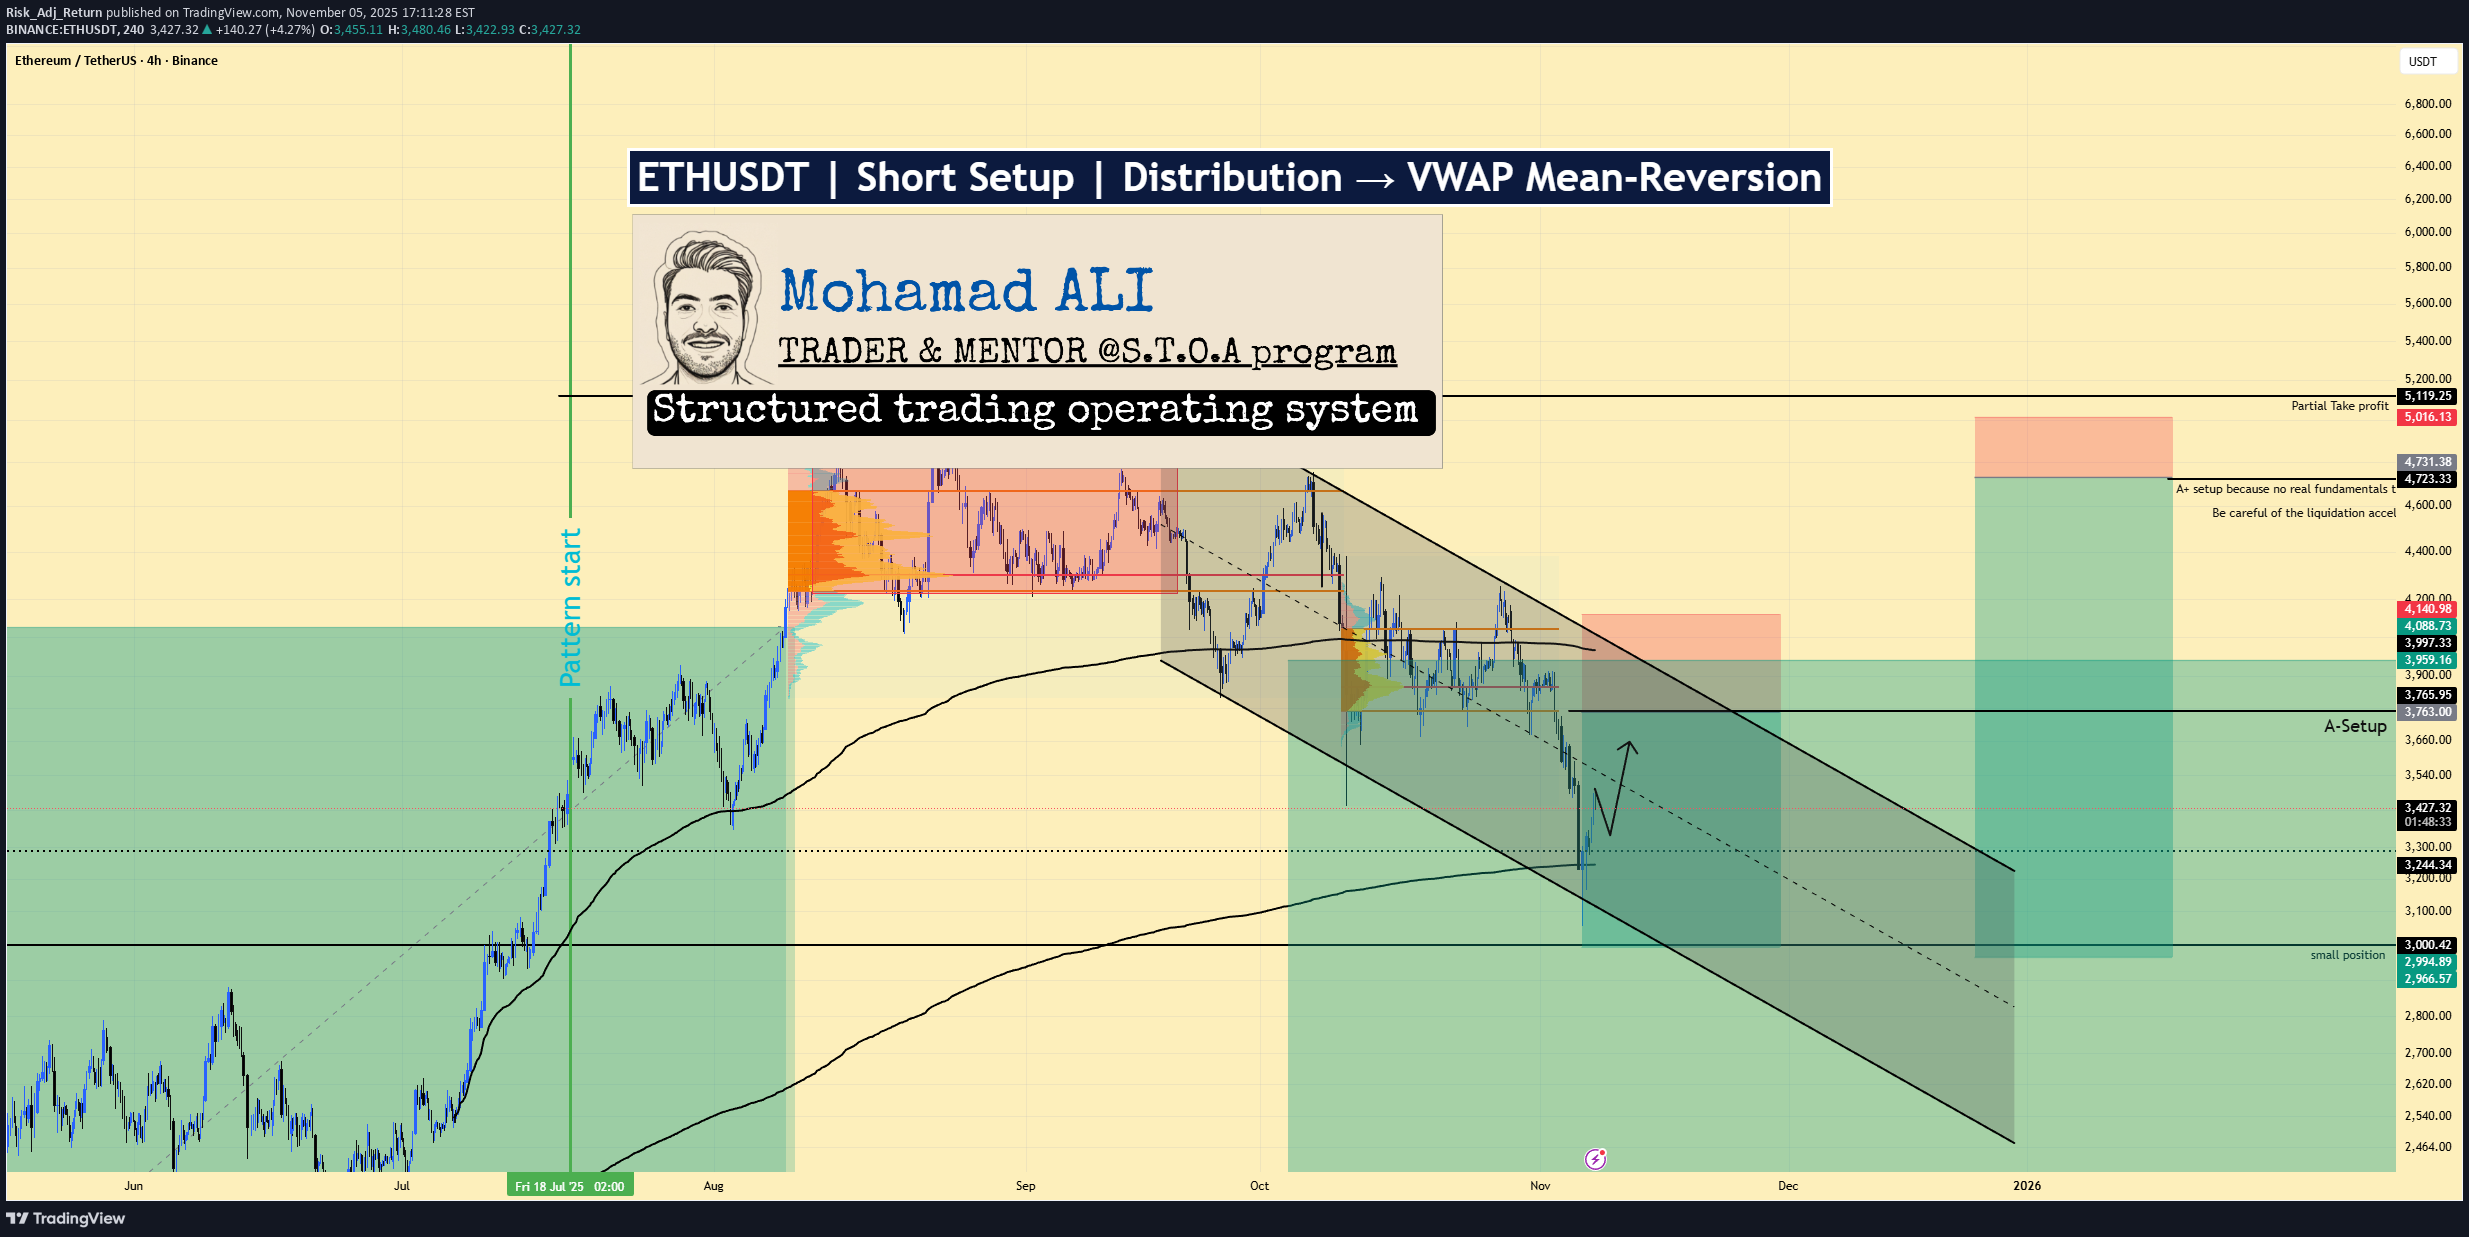
ETHUSDT | Short Setup | Distribution → VWAP Mean-Reversion | Nov 5, 2025 🔹 Thesis Summary ETH is bouncing inside a corrective leg after clear distribution. A retest of ~3,756 into prior value and VWAP resistance offers asymmetric short exposure toward 3.3k → 3.0k, with deeper paths to 2.5k–2.0k if risk-off accelerates. 🔹 Trade Setup Bias: Short Entry Zone: 3,720–3,780 (primary), optional add on overshoot into 3,860–3,900 Stop Loss (hard invalidation): 4,150 (daily close back above prior distribution high) Take-Profits: TP1: 3,300 (first VWAP/mid-range reaction) TP2: 3,000 (range low / liquidity shelf) TP3: 2,500 (capitulation pocket) Max Target: 2,000 (cycle mean-reversion) Indicative R:R (from 3,750 vs 4,150): TP1 ≈ 1.1R, TP2 ≈ 1.9R, TP3 ≈ 3.1R, Max ≈ 4.4R 🔹 Narrative & Context Structure: Left-side distribution is clear; subsequent liquidation aligned with the classic cycle (distribution → correction → accumulation). Current rally is corrective into a prior value area/high-volume node around 3,750–3,900, where supply previously dominated. VWAP & Means: Price is orbiting multi-week VWAP bands; first touch/retest of the upper band into that A-setup line near 3,765 is where sellers have edge with defined risk. Sector & Rotations: SPX remains semiconductor-heavy; the Aug 25–Sep 20 window showed distribution/exit flows, consistent with a broad risk-off tone spilling into crypto. Alt breadth is weakening first (early panic tells). Leverage & Flow (pro watch-items): Into the short zone, watch for positive perp funding + rising OI (late longs), ETH/BTC underperformance, and basis cooling—all consistent with a re-short after a squeeze. 🔹 Valuation & Context (Pro Metrics, Framed Simply) Perp Funding Rate: Positive/expanding into resistance → indicates long-side crowding → increases squeeze-then-fade probability at 3.75–3.90k → supports short timing. Open Interest vs. Price: OI rising on up-ticks → leverage adding into supply → raises liquidation risk on pullback → improves short R:R. ETH/BTC Ratio: Weak/flat vs BTC → capital prefers base-layer beta over ETH beta → less support on bounces → aligns with lower targets on rejection. 🔹 Contrarian Angle (Your Edge) Consensus is leaning toward “buy-the-dip into year-end flows.” Our read: acceptance back into prior value is failing, VWAP is capping, and leverage is rebuilding into supply. That combination often precedes a second-leg lower toward 3.0k with room to 2.5k if macro tightens. 🔹 Risks Sudden risk-on impulse (index squeeze, dovish macro headline) pushing ETH through 4,150. Catalyst risk (unexpected ETH-specific positive news/flows) that invalidates distribution. Liquidity pockets: thin books amplify wicks; poor fills if size isn’t laddered. 🔹 Macro Considerations DXY firming and VIX pressing higher favor risk-off follow-through; a DXY fade or vol crush would reduce downside velocity. Gold stretched and due to cool → typically aligns with a broader cross-asset balance; a hard gold bid with rising VIX would strengthen risk-off. Track NQ/semis: continued weakness supports the ETH short; a decisive semiconductor rebound would argue for patience or reduced size. 🔹 Bottom Line Defined-risk short into 3,720–3,780 with invalidation 4,150. First objective 3,300, core target 3,000; extended bear paths 2,500–2,000 if macro stays risk-off. Trade the structure, hedge, and keep sizing disciplined. 🔹 Forward Path If this post gains traction (10+ likes), I’ll publish: A weekly-frame update on the distribution range and VWAP bands Breakout/invalidations above 3.90k–4.15k and how that flips bias Comments thread Q&A on execution (laddering, partials, hedge overlays) Like & Follow for structured ideas, not signals. I post high-conviction setups here before broader narratives play out. ⚠️ Disclaimer: This is not financial advice. Do your own research. Charts may include AI-assisted enhancements. 🔹 Footnote Forward P/E: Price divided by expected earnings over the next 12 months. Lower = cheaper relative to profits. P/FCF (Price-to-Free-Cash-Flow): Price vs. the cash left after investments. A measure of efficiency. FCF Yield: Free cash flow per share ÷ price per share. Higher = more cash returned for each dollar invested. ROE (Return on Equity): Net income ÷ shareholder equity. Shows management efficiency with investor capital. ROIC (Return on Invested Capital): Net income ÷ all invested capital (equity + debt). A purer profitability gauge. Debt/Equity: Debt divided by equity. <1 usually means balance sheet is conservative. R:R (Risk-to-Reward): Ratio of expected upside vs. downside. 3:1 = you risk $1 to make $3.
Risk_Adj_Return
سهم آمازون (AMZN): چرا اکنون زمان خرید است؟ (فصل اوج + قدرت حاشیه سود)
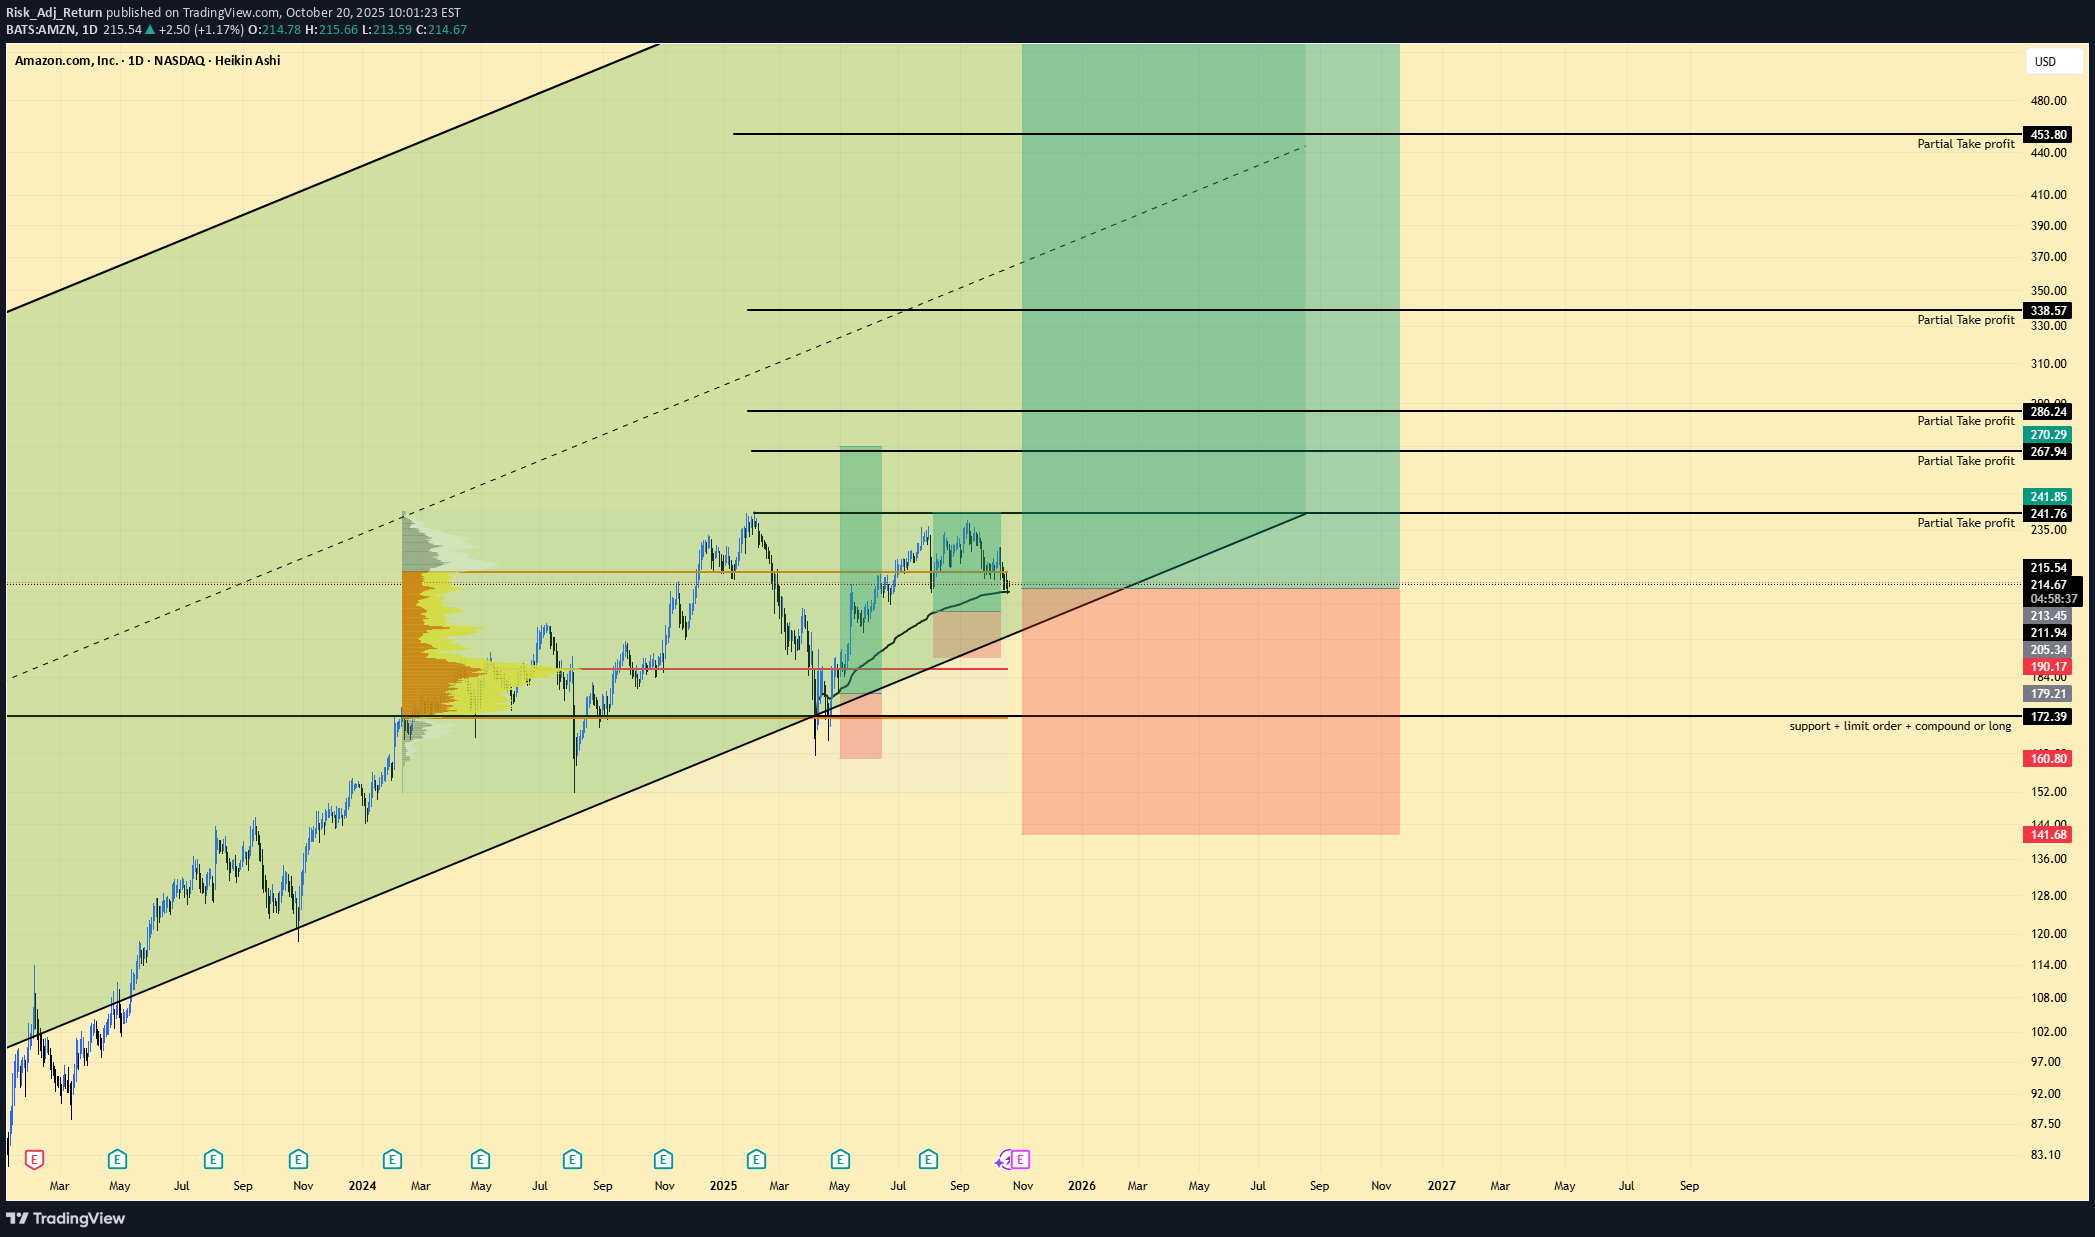
AMZN | Long Setup | Q4 Seasonality + AWS/Ads Margin Mix | Oct 20, 2025 🔹 Thesis Summary Amazon underperformed YTD but enters its strongest seasonal window into Q4 with margin mix improving (AWS + Ads). With earnings on Oct 30 and analyst targets clustered above spot, a defined-risk long seeks a channel continuation toward 292–317, stretching to 417 on multi-quarter follow-through. 🔹 Trade Setup Bias: Long Entry Zone: 209–216 (prior breakout retest + HVN) Stop Loss: 142 (below summer higher-low and volume shelf) Take-Profits: • TP1: ~241 • TP2: ~267 • TP3: ~290 • Max Target: 317.1 (extension 417.3 on multi-quarter trend) R:R (from 213 mid-entry): to TP1 ≈1.4:1, TP2 ≈2.2:1, TP3 ≈3.8:1, Max ≈5.0:1 (417 ≈9.7:1) 🔹 Narrative & Context Price respects a 2023–2025 rising channel; recent pullback held the channel midline and a dense volume node near 210–212. Multi-tap resistance at 241–246 is the first decision area; clearing it opens 260–292 (measured move from the summer base). Seasonality favors strength into Nov–Dec, and earnings (Oct 30; EPS est 1.57 on $177.8B rev) can catalyze a range expansion. Street positioning remains constructive: 1-yr price-target avg ~265, range 230–306, with a dominant Strong Buy skew and a visible EPS beat cadence on recent quarters. Operational quality remains intact (Gross margin ~49.6%, Op margin ~11.5%, Profit margin ~10.5%). Balance sheet leverage is restrained (LT Debt/Equity ~0.40). Valuation & Context (Pro Metrics, Framed Simply) Forward P/E ≈ 28.3x vs large-cap megatech peers mid-20s → modest premium → market pricing AWS/Ads mix resilience → premium is acceptable if EPS growth tracks mid-teens. P/FCF (screen) elevated vs Alphabet/Microsoft → investors paying up for reinvestment runway → acceptable if AI capex converts to durable cash yields; watch 2026 FCF inflection. ROIC ≈ 15% vs peers: GOOGL ~29%, MSFT ~23% → solid but not best-in-class → upside if Ads/AWS mix lifts returns. EPS growth next 5y ~19% → above retail/consumer staples → supports multiple stability through the cycle. Debt/Equity ~0.46 → conservative leverage → reduces drawdown risk around macro or regulatory shocks. 🔹 Contrarian Angle (Your Edge) Consensus clusters $230–$306 with focus on AWS deceleration. Price structure shows accumulation above 209–212 and an intact up-channel. With Q4 seasonality, improving operating leverage, and continuing Ads share gains, we see a path to 292–317 in 1–3 quarters and 417 on a multi-quarter trend extension if margins expand 100–150 bps from mix. 🔹 Risks (Balanced) AWS growth undershoots or margin compression from AI capex. Regulatory/antitrust actions affecting retail or Ads. Consumer softness or post-earnings gap below 200 invalidating the base. 🔹 Macro Considerations Track NDX breadth and real yields; higher real rates could cap the multiple. USD strength pressures international; weakness helps. Event risk: Oct 30 earnings, CPI/PCE prints, and large-cap tech earnings read-through; watch cloud commentary from MSFT/GOOGL for competitive signals. 🔹 Bottom Line AMZN screens slightly expensive on headline multiples, but the mix (AWS/Ads) and Q4 seasonality justify a defined-risk long. Above 246, momentum opens 260–292; sustained strength targets 317, with 417 as an extended objective if margins and FCF inflect through 2026. 🔹 Forward Path If this post gets 10+ likes, I’ll publish a follow-up on the weekly structure, update earnings levels (gap/hold/fail), and adjust targets based on post-print volume profile. Like & Follow for structured ideas, not signals. I post high-conviction setups here before broader narratives play out. ⚠️ Disclaimer: This is not financial advice. Always do your own research. Charts and visuals may include AI enhancements. 🔹 Footnote Forward P/E: Price divided by expected earnings over the next 12 months. Lower = cheaper relative to profits. P/FCF (Price-to-Free-Cash-Flow): Price vs. the cash left after investments. A measure of efficiency. FCF Yield: Free cash flow per share ÷ price per share. Higher = more cash returned for each dollar invested. ROE (Return on Equity): Net income ÷ shareholder equity. Shows management efficiency with investor capital. ROIC (Return on Invested Capital): Net income ÷ all invested capital (equity + debt). A purer profitability gauge. Debt/Equity: Debt divided by equity. <1 usually means balance sheet is conservative. R:R (Risk-to-Reward): Ratio of expected upside vs. downside. 3:1 = you risk $1 to make $3.
Risk_Adj_Return
تحلیل بیت کوین امروز: آیا اصلاح قیمتی تا ۶۵,۰۰۰ دلار در راه است؟

So, on Bitcoin, we’ve seen quite a ride lately, a correction, a strong pump, some sideways movement, it’s been a journey full of ups and downs, but a rewarding one overall. Right now, I believe we’re at a point where a correction is due. Bitcoin could move up toward $65,000, or it might dip below that level. It depends on time, which is always a key factor in my trading. Another important aspect for me is scenario preparation. When you look at my chart above, you’ll see I always prepare two scenarios, long and short and I often hedge accordingly. Could Bitcoin fall all the way to $60,000? It’s possible, though unlikely at the moment. What seems more probable is that we’ll face strong resistance on the upside. We’ve broken out of the previous parallel channel and sideways range, but there’s still heavy resistance ahead. It would take a very strong catalyst to push higher from here. For me, the preferred scenario is to look for an entry around $61,000–$62,000, but I’ll wait until Monday’s stock market open to take any new trades. I don’t trade weekends, and it’s currently 2 a.m. on Friday, October 18, so I’ll stay flat until the markets reopen. That said, recent trades have been solid. My portfolio has performed well, even during the altcoin crash that wiped out over 1.5 million accounts through liquidations. I wasn’t one of them because I had prepared for this scenario. I shorted Ethereum perfectly, took profits, and added to positions where it made sense. My focus, as always, was on institutional flow, understanding where the big money is moving. Now, on Bitcoin, I’m watching a key liquidation zone around $74,000, which I call the maximum pain zone. This is typically where trapped longs start exiting their positions, creating opportunities for larger players to step in. We also have the VWAP (Volume-Weighted Average Price) aligning near that area, which gives us an idea of where the true average price lies based on traded volume. That’s an important level to monitor. I wanted to share this idea with you. If it helps or adds value, give it a like, share it, and drop a comment with your thoughts or critiques. If this post reaches 10+ likes, I’ll post a TradingView update with the latest analysis and scenarios for the upcoming week.18.10.2025 Quick update for the text 1. Bitcoin could move up toward $131,000* 2. I am waiting for an entry around $111.000, I will decide on Monday*
Risk_Adj_Return
OPUSDT | Long Setup | Unlock Overhang | Sep 3, 2025
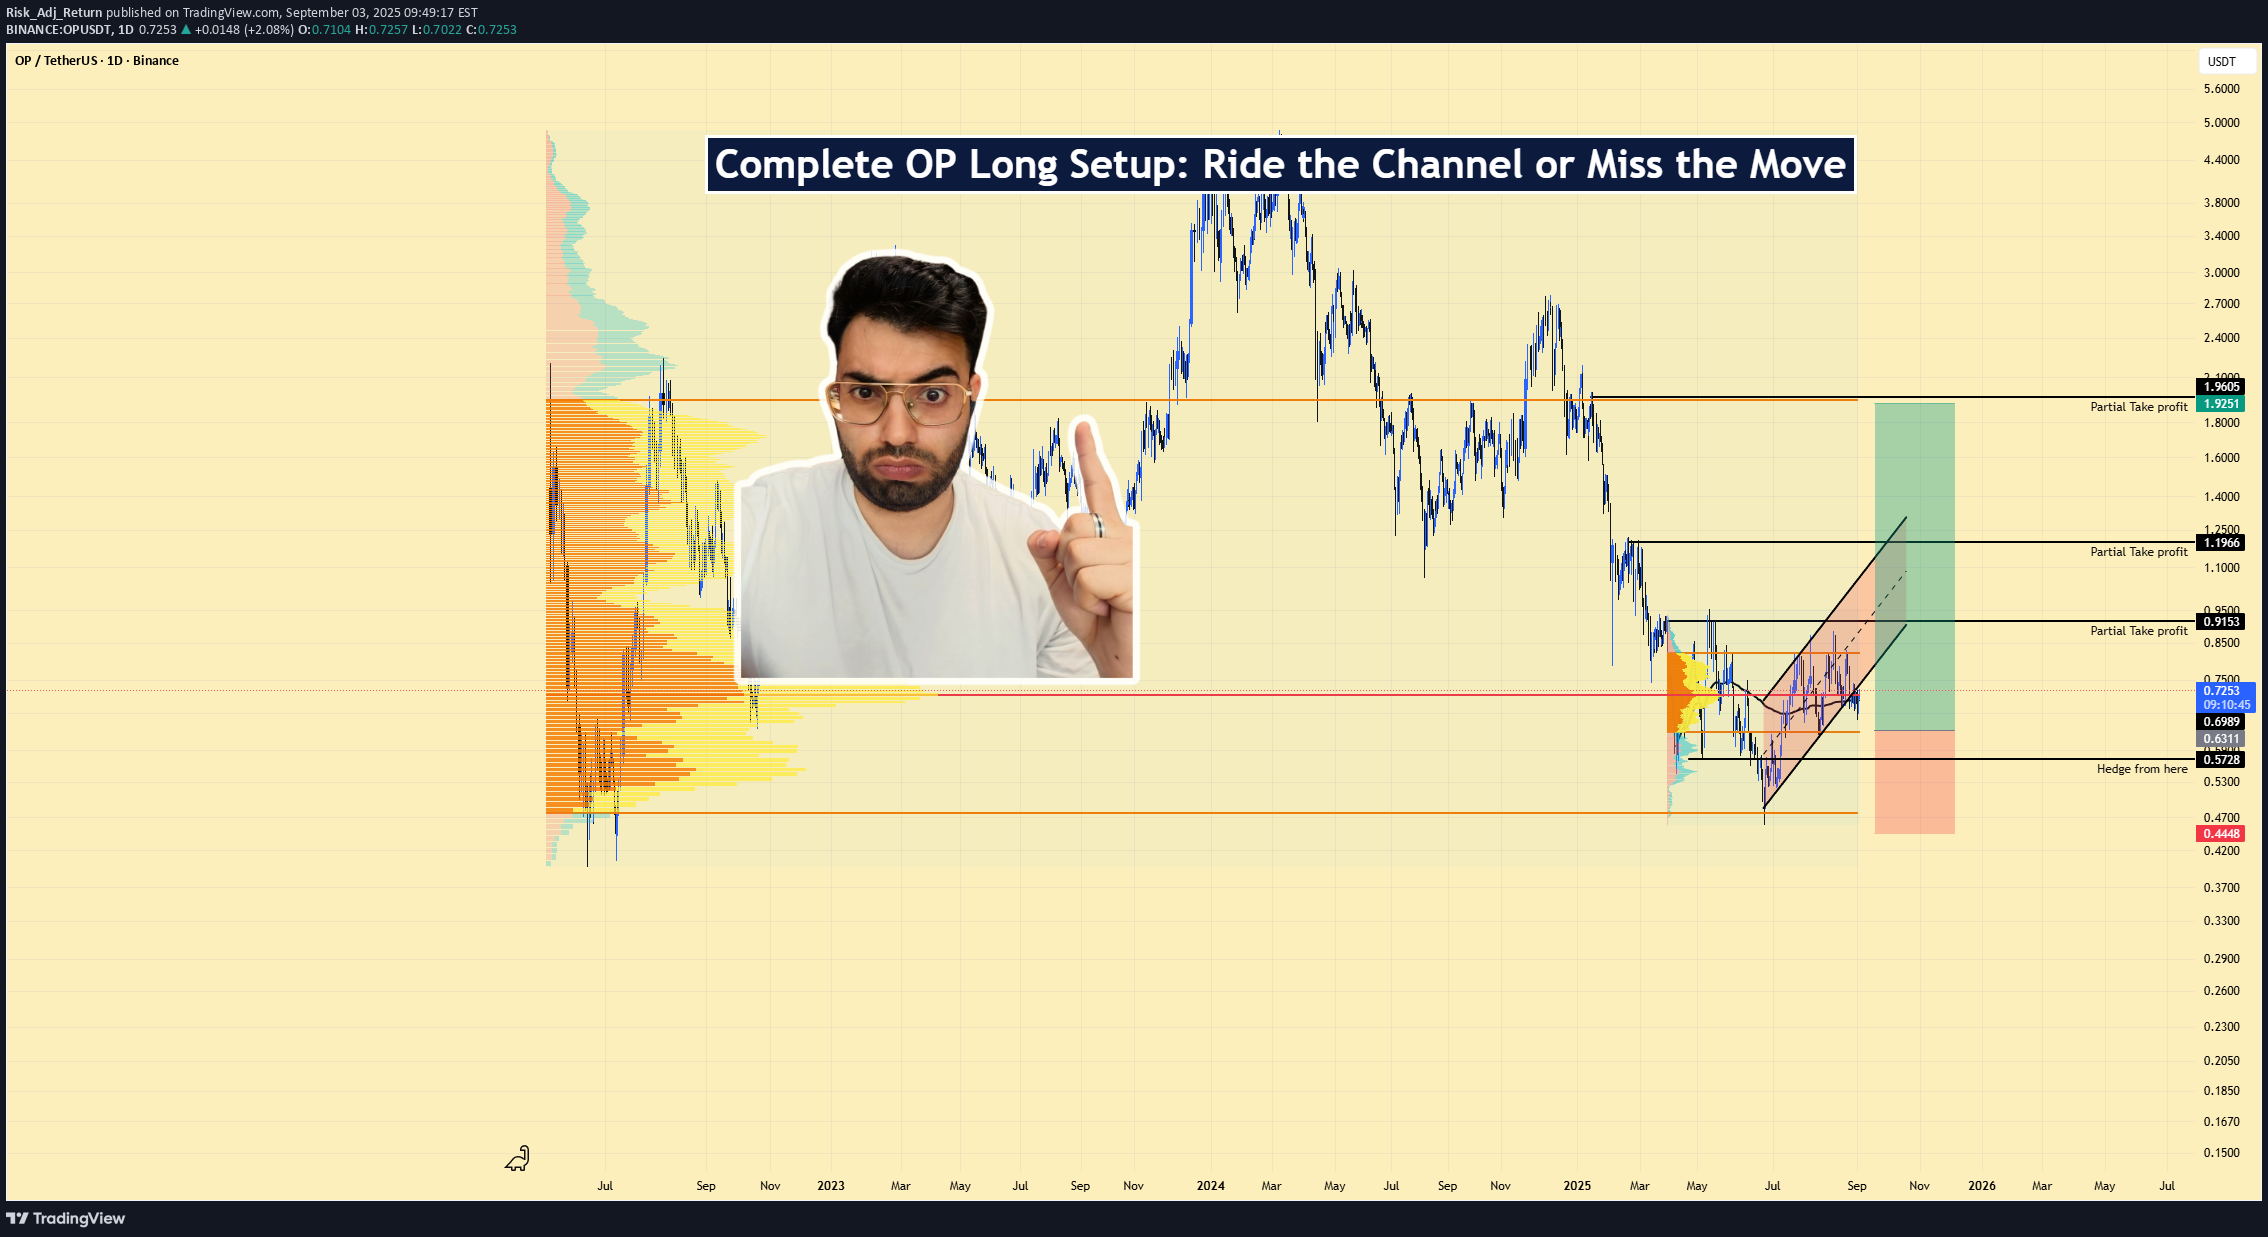
📌OPUSDT | Long Setup | Ascending-Channel Reclaim vs. Unlock Overhang | Sep 3, 2025 🔹 Thesis Summary OP is basing after a deep drawdown while price grinds higher inside a rising channel. With >50% of supply already unlocked and TVL near $500M supporting 97 protocols (UNI, SNX, VELO), the risk/reward favors a defined-risk long into resistance reclaim. 🔹 Trade Setup Bias: Long Entry Zone: $0.68 – $0.75 (pullbacks into channel support/VWAP cluster) Stop Loss (invalidation): $0.5728 (loss of channel + “hedge from here” level) Hard Backstop (catastrophic): $0.4468 Take-Profits: TP1: $0.9153 TP2: $1.1956 TP3 / Max: $1.9525 – $2.00 Indicative R:R from $0.715 midpoint → $0.5728 stop: TP1 ≈ 1.41x, TP2 ≈ 3.38x, TP3 ≈ 8.70x. 🔹 Narrative & Context Structure: OP reclaimed a higher-low structure inside a clean ascending channel. Volume profile shows acceptance in the $0.60–$0.75 band; above $0.80–$0.92 sits a low-resistance pocket into $1.20, then the prior breakdown shelf near $1.95–$2.00. Sector positioning: As an Ethereum L2 using optimistic rollups, Optimism inherits L1 security while offering cheaper throughput—key into any ETH-led rotation. Seasonality/performance context: 2023 delivered a late-year impulse (~+301%), while 2024–2025 have been distribution years (~-56% / -61% YTD). Mean path favors relief rallies when flows return; average path sits near ~4%. Tokenomics & unlocks (supply map): ~50.33% of OP is unlocked; Core Contributors ~33.35%, Future Airdrops ~24.57%, Ecosystem funds ~25%. Unlocks continue toward 2026—supply overhang is known and increasingly priced. Where this fits technically: The chart’s labeled targets ($0.915 / $1.196 / $1.953) line up with prior HVNs/inefficiencies. Keeping risk below $0.5728 respects the current value area. 🔹 Valuation & Context MC/TVL ≈ 3.1x (Unlocked Mkt Cap ~$1.55B ÷ TVL ~$0.50B) → Market pays ~$3 for each $1 secured on OP → Reasonable if TVL and sequencer revenues expand with an ETH up-cycle → Supports a re-rating toward prior shelves. Inflation ≈ 2% / yr → Predictable dilution vs. many higher-emission assets → Puts focus on unlock schedule rather than ongoing issuance → Aligns with staged take-profits. Unlock Progress ~50% → Overhang persists but more than half is circulating → Weakens marginal unlock impact over time → Favors buying liquidity sweeps into support rather than chasing breakouts. 🔹 Contrarian Angle (Your Edge) Consensus fixates on unlock supply and the 2024–2025 drawdown. The structure + acceptance above $0.68 argues the overhang is largely priced. If ETH volatility compresses then expands upward, OP can revisit $0.92 / $1.20 quickly and test $1.95–$2.00 on a broader L2 rotation. 🔹 Risks Unlock overhang / treasury distribution timing compresses rallies. Sector rotation away from L2s toward alt-L1s or BTC dominance. ETH beta risk: ETH weakness or elevated gas stagnates activity/revenues. 🔹 Macro Considerations Track BTC/ETH trend, ETH volatility regime, and risk-on breadth. Flows & incentives: Any L2 incentive programs or airdrop cycles can accelerate TVL/usage. Calendar: Monitor OP unlock dates and major ETH events; fade into those if positioning is crowded. 🔹 Bottom Line This is a defined-risk long into a constructive channel with clearly mapped targets. Supply risks are known; structural reclaim plus sector beta argues for measured exposure and staged exits. Above $0.92, momentum can extend toward $1.20 and potentially $1.95–$2.00. 🔹 Forward Path If this post gains traction, I’ll follow up with: weekly structure map, confirmation triggers above $0.92, and updates around unlock windows. Like & Follow for structured ideas, not signals. I post high-conviction setups here before broader narratives play out. ⚠️ Disclaimer: This is not financial advice. Do your own research. Charts may include AI-assisted visuals. 🔹 Footnote Forward P/E: Price divided by expected earnings over the next 12 months. Lower = cheaper relative to profits. P/FCF (Price-to-Free-Cash-Flow): Price vs. the cash left after investments. A measure of efficiency. FCF Yield: Free cash flow per share ÷ price per share. Higher = more cash returned for each dollar invested. ROE (Return on Equity): Net income ÷ shareholder equity. Shows management efficiency with investor capital. ROIC (Return on Invested Capital): Net income ÷ all invested capital (equity + debt). A purer profitability gauge. Debt/Equity: Debt divided by equity. <1 usually means balance sheet is conservative. R:R (Risk-to-Reward): Ratio of expected upside vs. downside. 3:1 = you risk $1 to make $3.
Risk_Adj_Return
BTCUSD | Neutral Bias | Liquidity Whipsaws | Aug 26, 2025
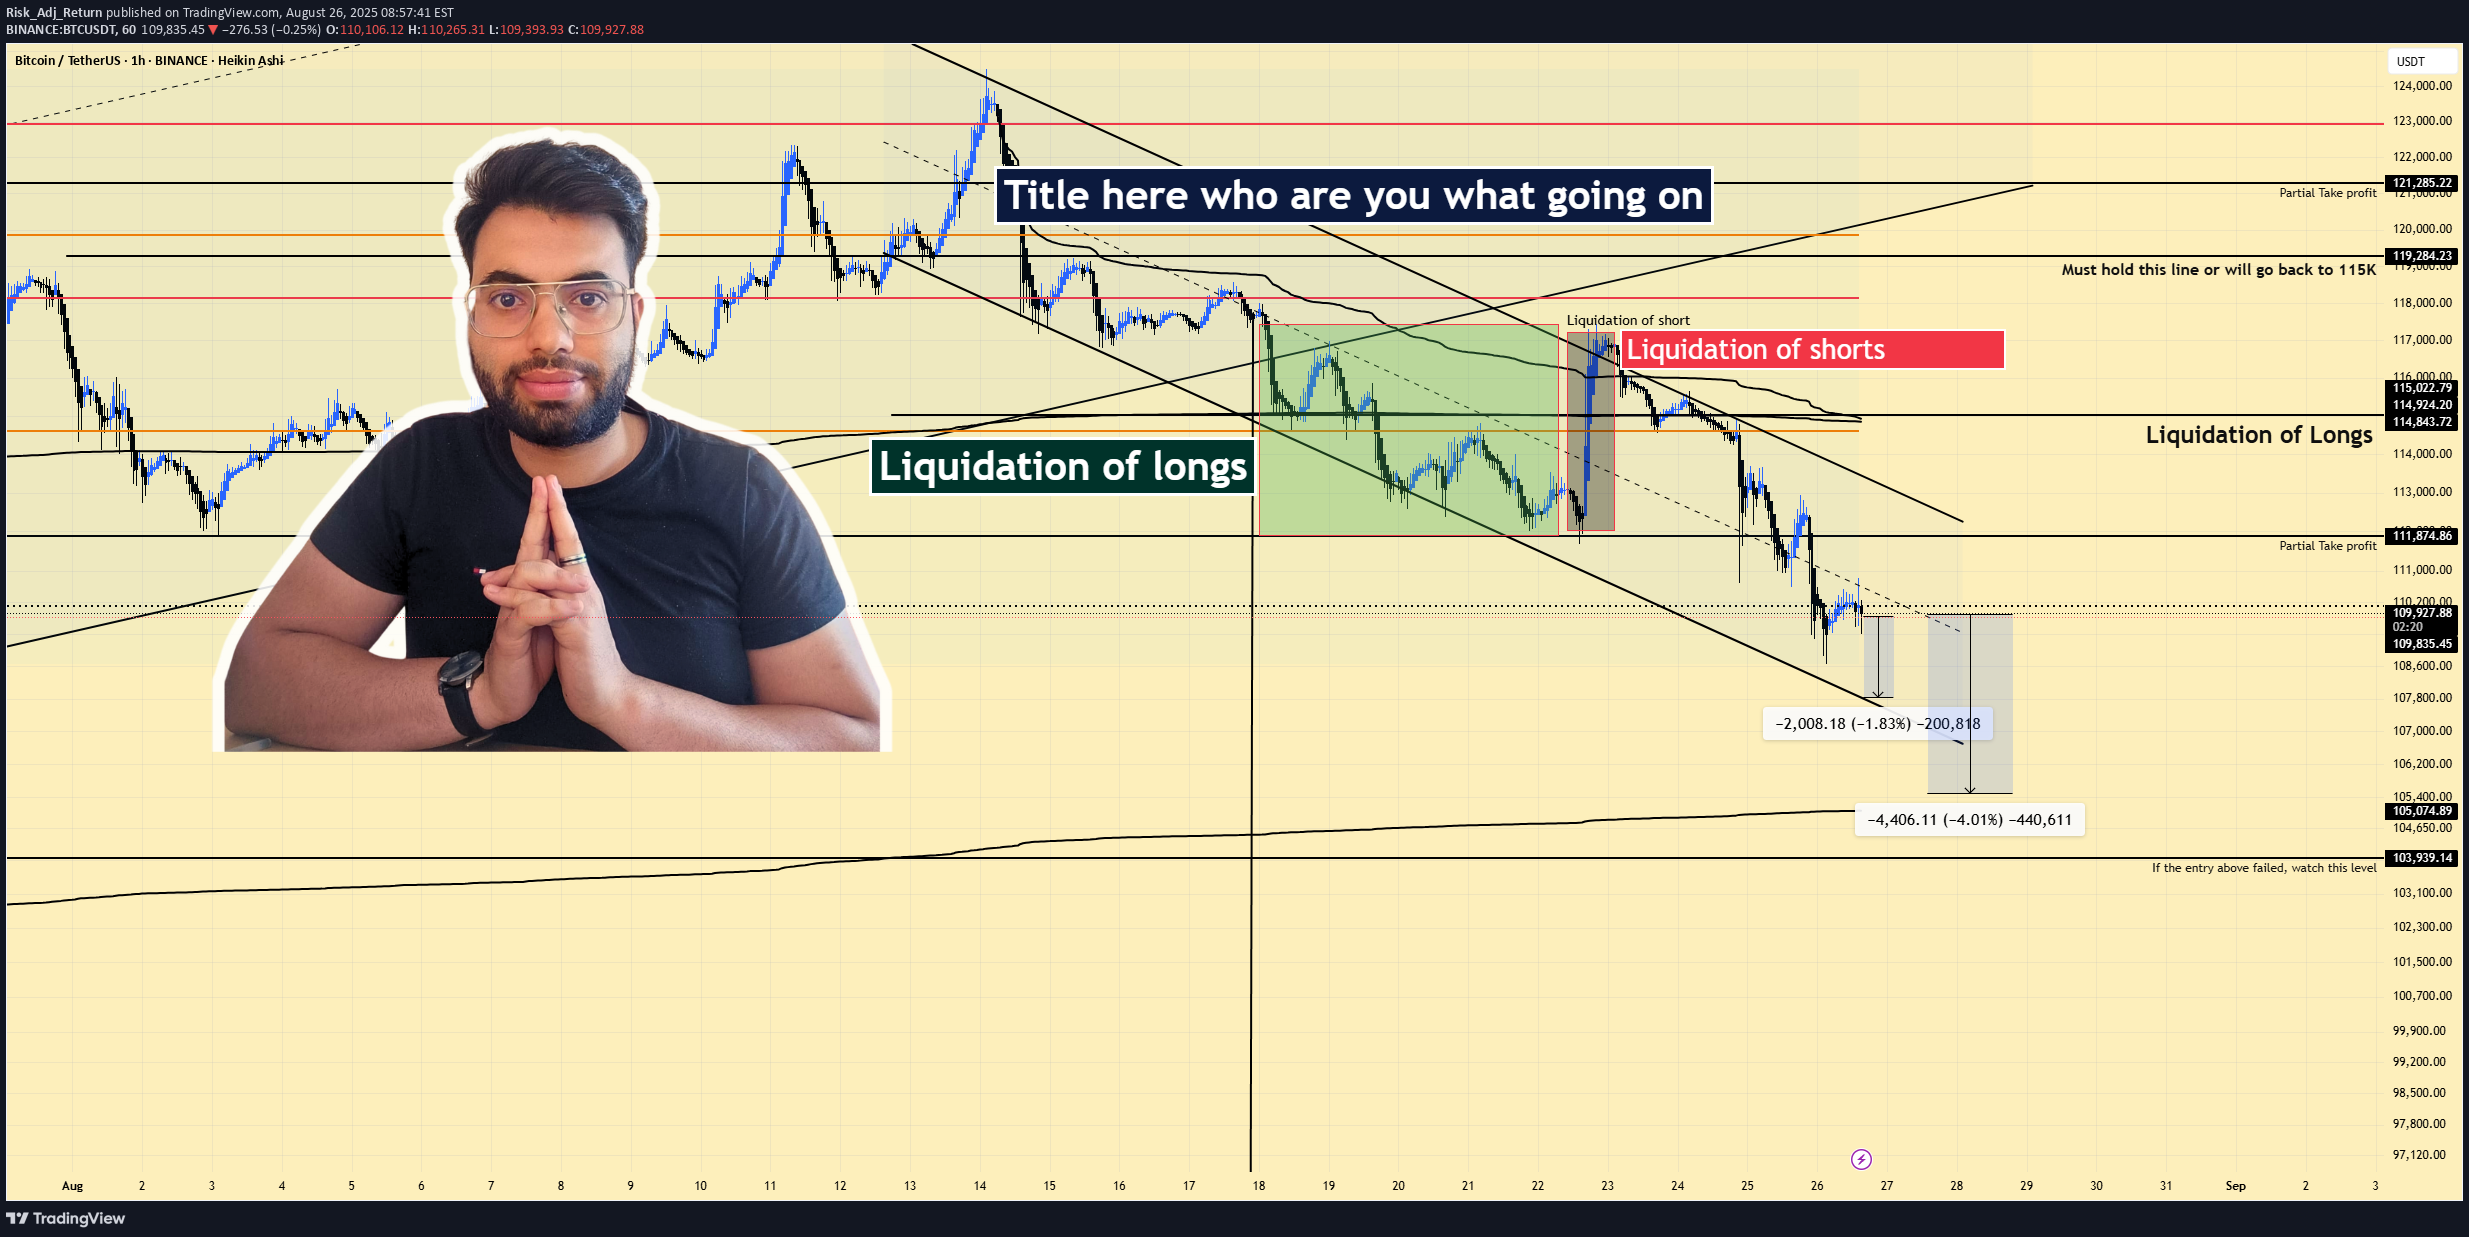
📌 BTCUSD | Neutral Bias | Liquidity Whipsaws Within Descending Channel | Aug 26, 2025 Right now, Bitcoin is around 109,700 after dropping from ~120k. We’re still moving inside a parallel channel to the downside. On the hourly chart, money is flowing in, but on the 4-hour, it’s flowing out. What stood out yesterday was the liquidations, first longs, then shorts. That’s crypto in a nutshell: fast, direct, and unpredictable. It can feel like a “wonderful life,” but only if you’re prepared. This is why, if you don’t fully know what you’re doing, sometimes investing is safer than trading. Trading is a risk game, you can get lucky, but you can also get unlucky just as fast. Yesterday I got lucky, and I want to be transparent about that. Support looks stronger around 105,000, so that’s the level I’m watching for a potential bounce higher. Key takeaway: stay careful, manage risk, and don’t confuse luck with skill.
Disclaimer
Any content and materials included in Sahmeto's website and official communication channels are a compilation of personal opinions and analyses and are not binding. They do not constitute any recommendation for buying, selling, entering or exiting the stock market and cryptocurrency market. Also, all news and analyses included in the website and channels are merely republished information from official and unofficial domestic and foreign sources, and it is obvious that users of the said content are responsible for following up and ensuring the authenticity and accuracy of the materials. Therefore, while disclaiming responsibility, it is declared that the responsibility for any decision-making, action, and potential profit and loss in the capital market and cryptocurrency market lies with the trader.