Technical analysis by Risk_Adj_Return about Symbol OP: Buy recommendation (9/3/2025)

Risk_Adj_Return
OPUSDT | Long Setup | Unlock Overhang | Sep 3, 2025
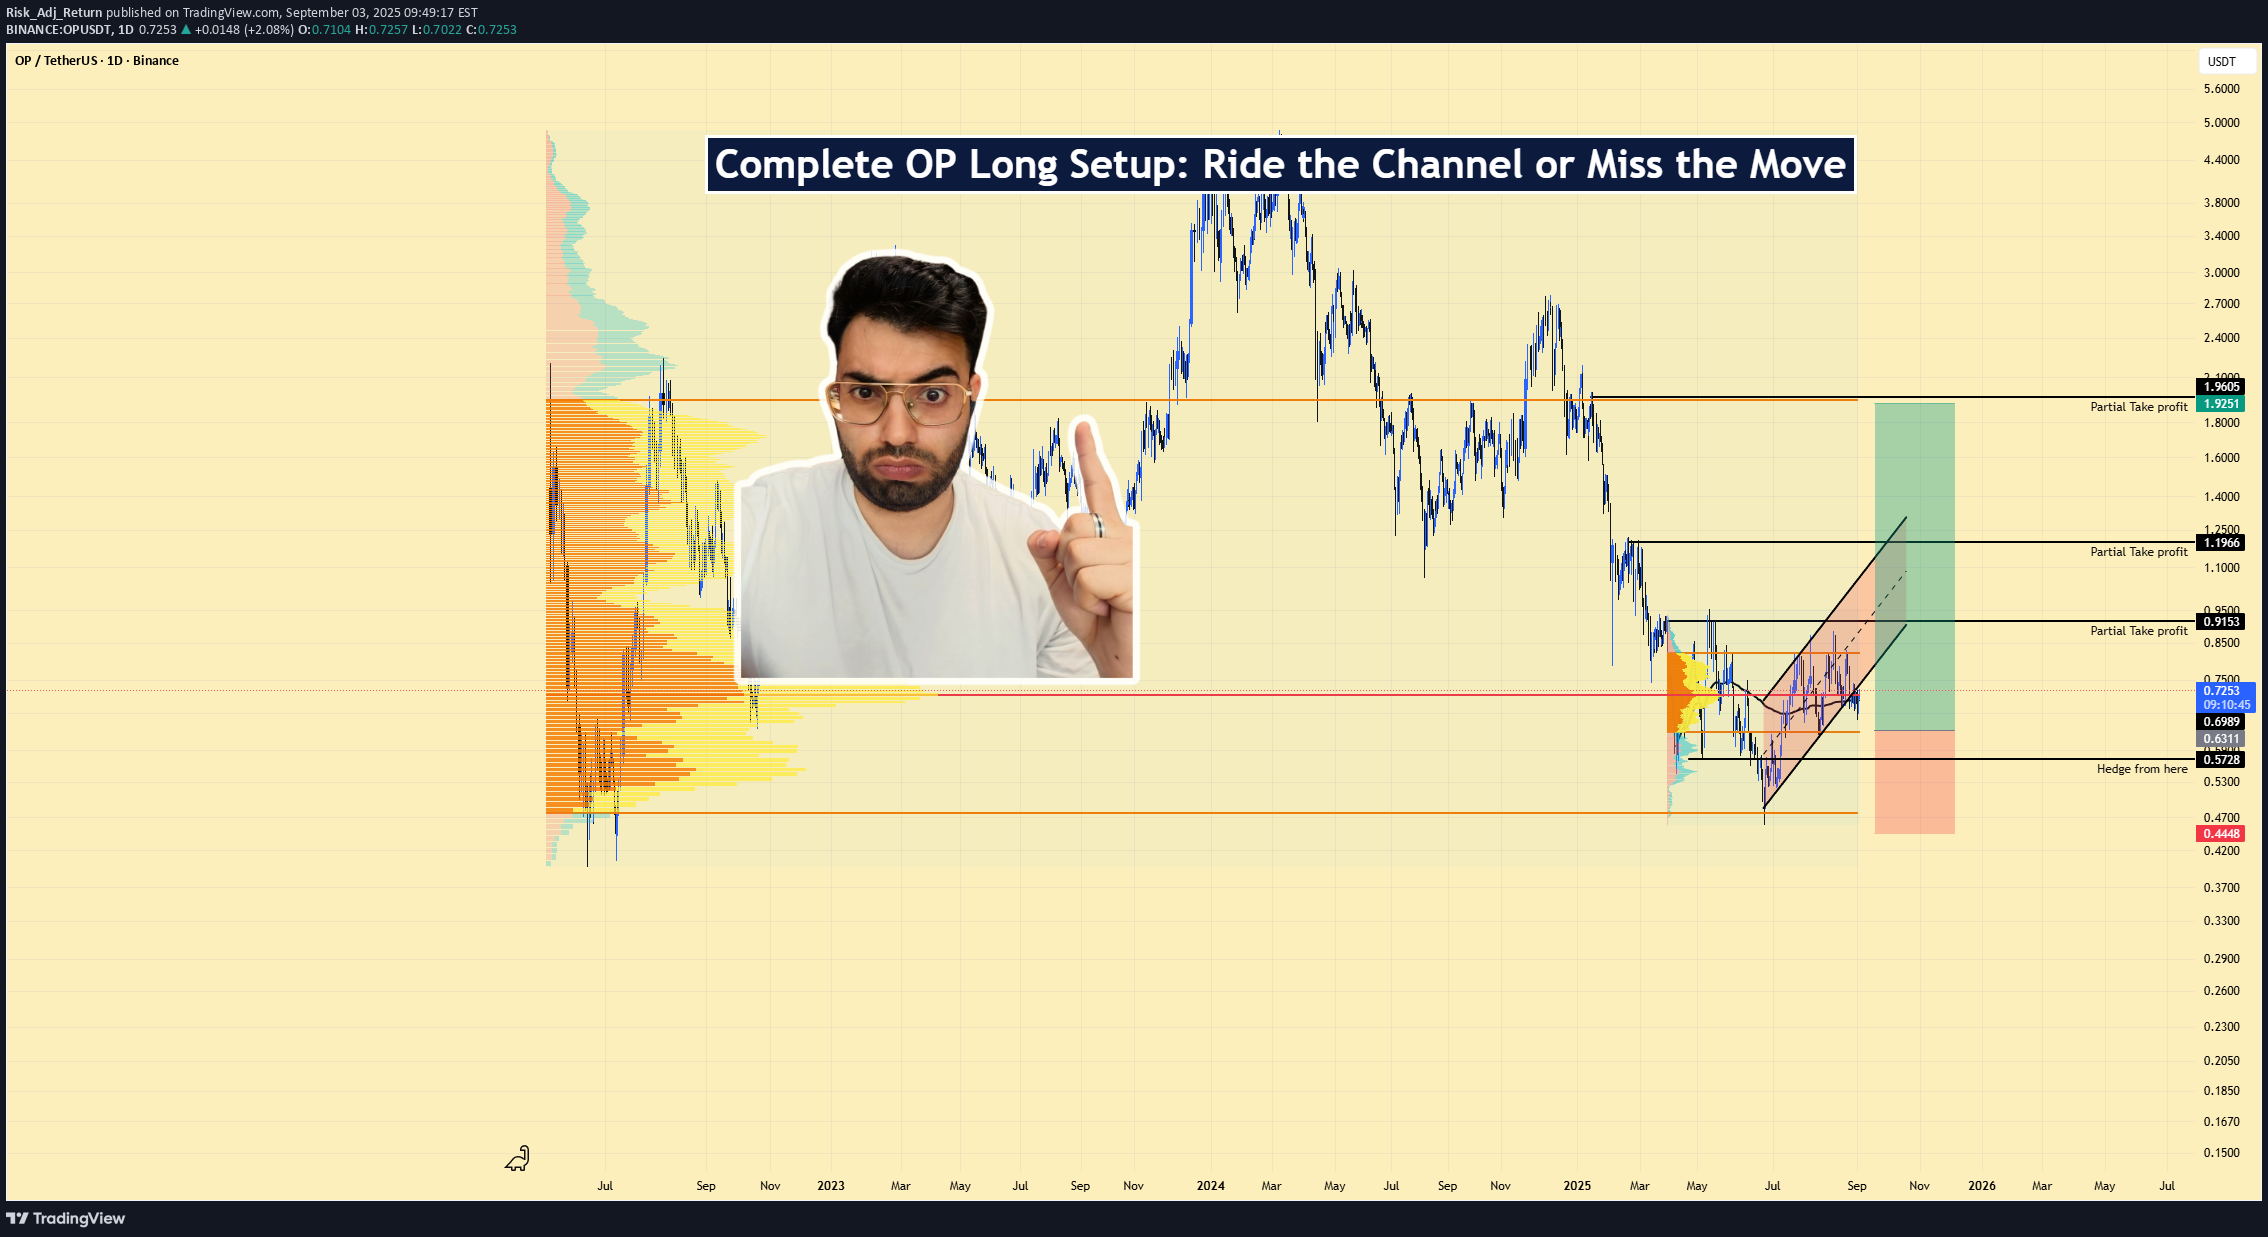
📌OPUSDT | Long Setup | Ascending-Channel Reclaim vs. Unlock Overhang | Sep 3, 2025 🔹 Thesis Summary OP is basing after a deep drawdown while price grinds higher inside a rising channel. With >50% of supply already unlocked and TVL near $500M supporting 97 protocols (UNI, SNX, VELO), the risk/reward favors a defined-risk long into resistance reclaim. 🔹 Trade Setup Bias: Long Entry Zone: $0.68 – $0.75 (pullbacks into channel support/VWAP cluster) Stop Loss (invalidation): $0.5728 (loss of channel + “hedge from here” level) Hard Backstop (catastrophic): $0.4468 Take-Profits: TP1: $0.9153 TP2: $1.1956 TP3 / Max: $1.9525 – $2.00 Indicative R:R from $0.715 midpoint → $0.5728 stop: TP1 ≈ 1.41x, TP2 ≈ 3.38x, TP3 ≈ 8.70x. 🔹 Narrative & Context Structure: OP reclaimed a higher-low structure inside a clean ascending channel. Volume profile shows acceptance in the $0.60–$0.75 band; above $0.80–$0.92 sits a low-resistance pocket into $1.20, then the prior breakdown shelf near $1.95–$2.00. Sector positioning: As an Ethereum L2 using optimistic rollups, Optimism inherits L1 security while offering cheaper throughput—key into any ETH-led rotation. Seasonality/performance context: 2023 delivered a late-year impulse (~+301%), while 2024–2025 have been distribution years (~-56% / -61% YTD). Mean path favors relief rallies when flows return; average path sits near ~4%. Tokenomics & unlocks (supply map): ~50.33% of OP is unlocked; Core Contributors ~33.35%, Future Airdrops ~24.57%, Ecosystem funds ~25%. Unlocks continue toward 2026—supply overhang is known and increasingly priced. Where this fits technically: The chart’s labeled targets ($0.915 / $1.196 / $1.953) line up with prior HVNs/inefficiencies. Keeping risk below $0.5728 respects the current value area. 🔹 Valuation & Context MC/TVL ≈ 3.1x (Unlocked Mkt Cap ~$1.55B ÷ TVL ~$0.50B) → Market pays ~$3 for each $1 secured on OP → Reasonable if TVL and sequencer revenues expand with an ETH up-cycle → Supports a re-rating toward prior shelves. Inflation ≈ 2% / yr → Predictable dilution vs. many higher-emission assets → Puts focus on unlock schedule rather than ongoing issuance → Aligns with staged take-profits. Unlock Progress ~50% → Overhang persists but more than half is circulating → Weakens marginal unlock impact over time → Favors buying liquidity sweeps into support rather than chasing breakouts. 🔹 Contrarian Angle (Your Edge) Consensus fixates on unlock supply and the 2024–2025 drawdown. The structure + acceptance above $0.68 argues the overhang is largely priced. If ETH volatility compresses then expands upward, OP can revisit $0.92 / $1.20 quickly and test $1.95–$2.00 on a broader L2 rotation. 🔹 Risks Unlock overhang / treasury distribution timing compresses rallies. Sector rotation away from L2s toward alt-L1s or BTC dominance. ETH beta risk: ETH weakness or elevated gas stagnates activity/revenues. 🔹 Macro Considerations Track BTC/ETH trend, ETH volatility regime, and risk-on breadth. Flows & incentives: Any L2 incentive programs or airdrop cycles can accelerate TVL/usage. Calendar: Monitor OP unlock dates and major ETH events; fade into those if positioning is crowded. 🔹 Bottom Line This is a defined-risk long into a constructive channel with clearly mapped targets. Supply risks are known; structural reclaim plus sector beta argues for measured exposure and staged exits. Above $0.92, momentum can extend toward $1.20 and potentially $1.95–$2.00. 🔹 Forward Path If this post gains traction, I’ll follow up with: weekly structure map, confirmation triggers above $0.92, and updates around unlock windows. Like & Follow for structured ideas, not signals. I post high-conviction setups here before broader narratives play out. ⚠️ Disclaimer: This is not financial advice. Do your own research. Charts may include AI-assisted visuals. 🔹 Footnote Forward P/E: Price divided by expected earnings over the next 12 months. Lower = cheaper relative to profits. P/FCF (Price-to-Free-Cash-Flow): Price vs. the cash left after investments. A measure of efficiency. FCF Yield: Free cash flow per share ÷ price per share. Higher = more cash returned for each dollar invested. ROE (Return on Equity): Net income ÷ shareholder equity. Shows management efficiency with investor capital. ROIC (Return on Invested Capital): Net income ÷ all invested capital (equity + debt). A purer profitability gauge. Debt/Equity: Debt divided by equity. <1 usually means balance sheet is conservative. R:R (Risk-to-Reward): Ratio of expected upside vs. downside. 3:1 = you risk $1 to make $3.