ورود/ثبت‌نام
VELO

VELO

قیمت6.44%‎$۰٫۰۱۹
اضافه کردن به دیده‌بان
خرید از صرافی
5
دنبال کننده ها
جمع بندی نظر تریدرها در ماه اخیر
فروش
خنثی
خنثی
خرید

نمودار قیمت ولو و روند سیگنال های ولو

بازه زمانی:
نوع سیگنال:

نظر تریدر ها در مورد قیمت ولو

نوع تریدر:
فیلتر زمان:

چه کسی بیشترین سود را از ولو گرفته؟

نوع تریدر:
فیلتر زمان:

سیگنال‌های ولو

فیلتر

نوع سیگنال

نوع تریدر

فیلتر زمان

CrocoCrypto
CrocoCrypto
رتبه: 250
3.2
خرید،تکنیکال،CrocoCrypto

ورود به یک اهرم 5 برابر طولانی از این منطقه. جامد است ، و فکر می کنم به زودی velo به دست می آید. روزهای خوب پیش روی ما ، صبر در چنین مواقعی مهم است.

ترجمه شده از: English
نمایش اصل پیام
نوع سیگنال: خرید
تایم فریم:
4 ساعت
قیمت لحظه انتشار:
‎$۰٫۰۱۷۹۱۷
اشتراک گذاری
خرید،تکنیکال،MasterAnanda

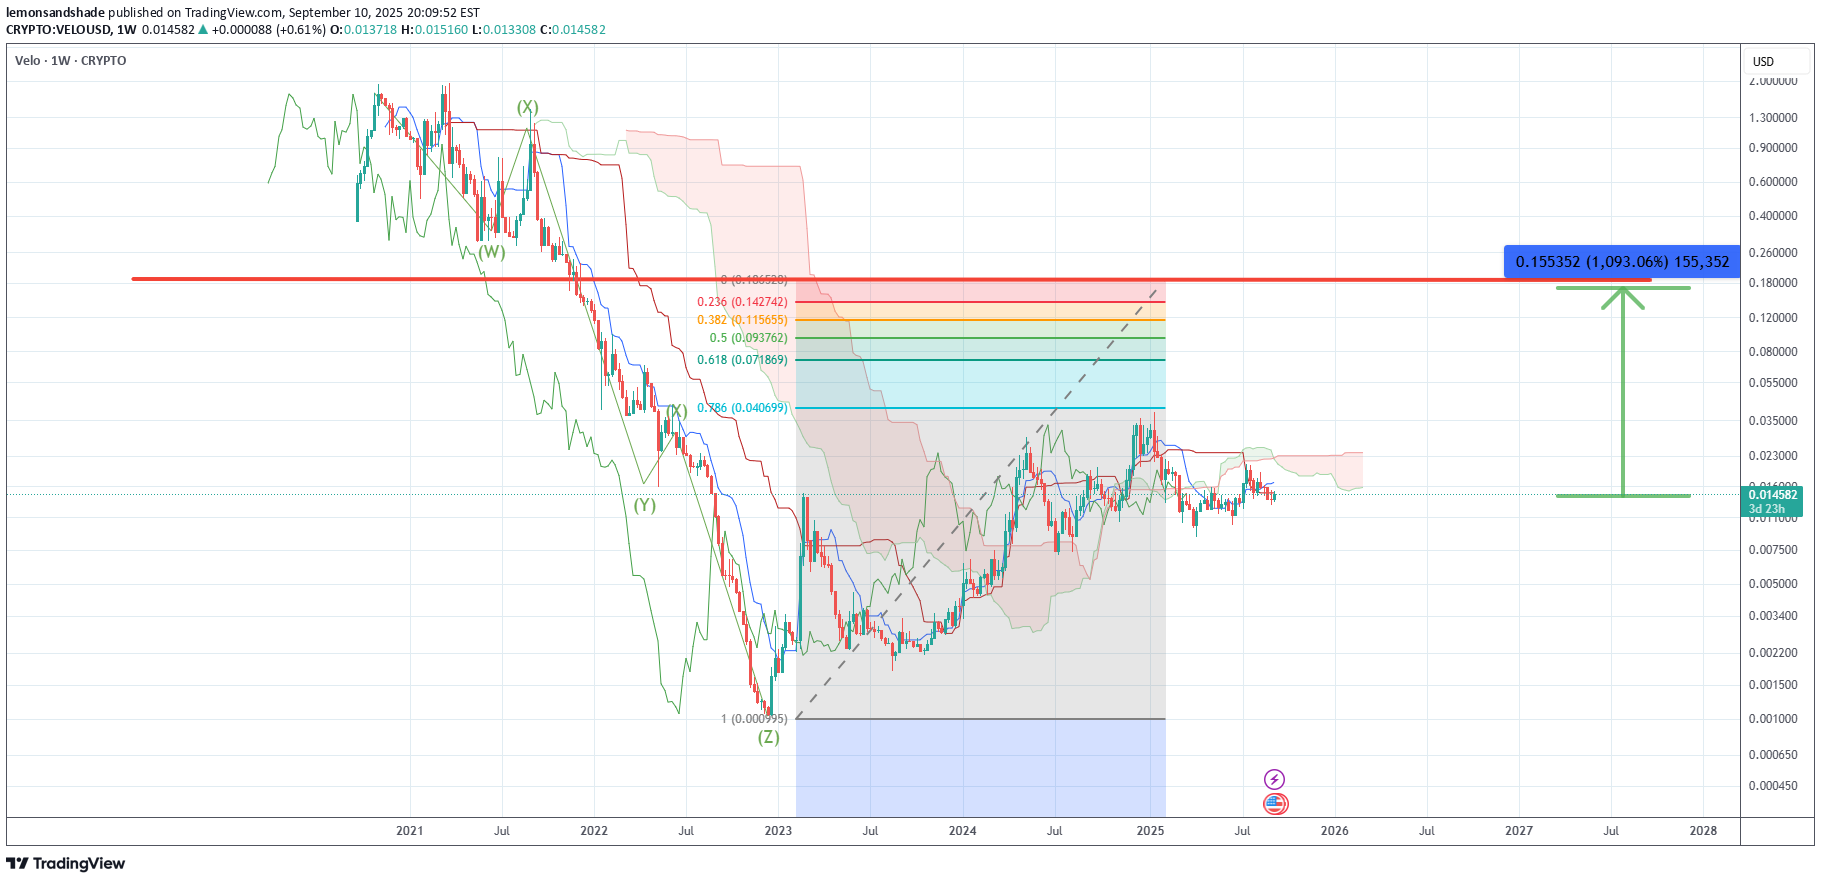
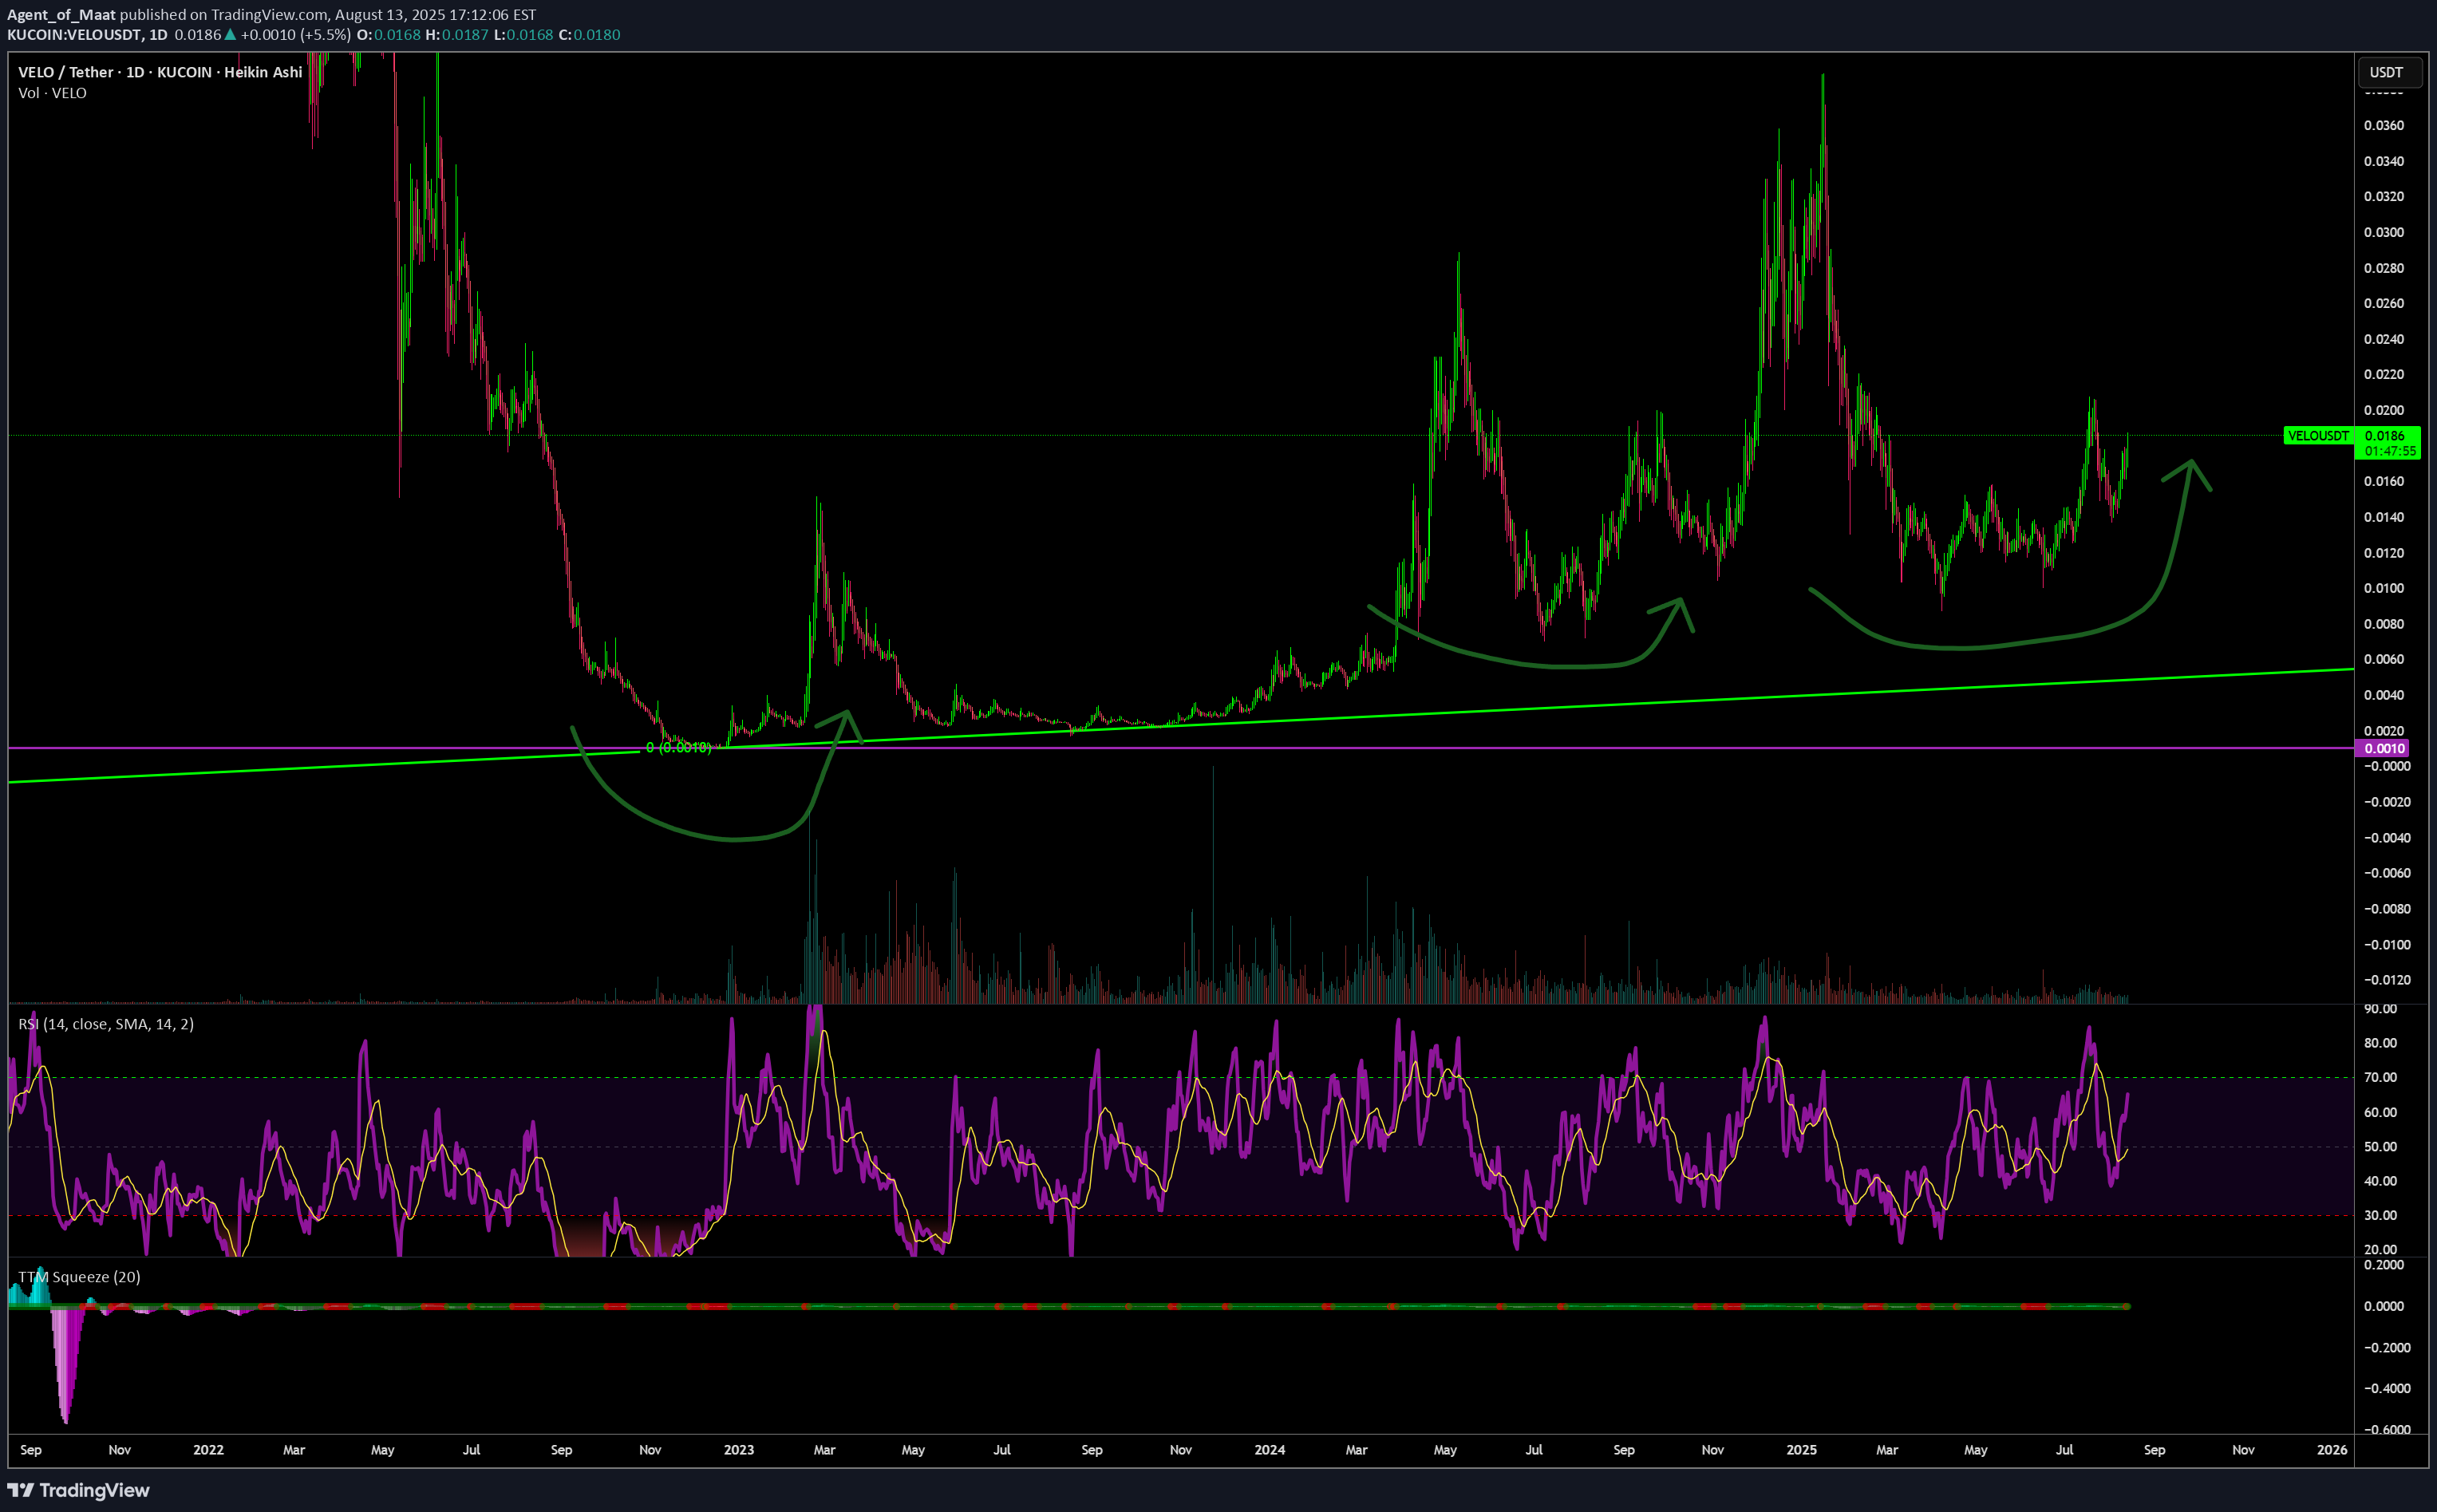
VELO از دسامبر سال 2022 به طور مداوم در حال افزایش است و قرار است بالاتر حرکت کند. یک مقاومت نهایی برای شکستن وجود دارد قبل از اینکه شاهد تولید یک موج صعودی بسیار قوی باشیم. مقاومت نهایی سطحی است که رشد را در ماه مه 2024 و سپس در ماه دسامبر و همچنین ماه گذشته رد کرد. این در نمودار نارنجی مشخص شده است. این محدوده مقاومت بین 0.025 دلار و 0.033 دلار قرار دارد. یک مقاومت طولانی مدت بسیار قوی. این واقعیت که VelousDT سالهاست که تولید مثلث صعودی در حال رشد است بسیار امیدوار کننده است. این مقاومت قرار است در هفته های آینده شکسته شود. پس از بیرون کشیدن ، فتح ، یک پیشرفت بسیار قوی اتفاق می افتد ، چیزی که قبلاً روی این جفت و این نمودار دیده نمی شود. این بزرگترین بازار گاو نر Velousdt از زمان شروع تجارت در Kucoin. از پایین 2022 دسامبر تا قیمت فعلی ، این جفت در مجموع 1900 پوند افزایش یافته است. در حالی که این رشد عالی و طولانی مدت است ، این تنها آغاز است ، یک مرحله انباشت طولانی مدت. با شکستن مقاومت ، رشد گسترده ای وجود داشت. هدف سوم در نمودار احتمالاً پایان بازار گاو نر نیست. Velousdt می تواند بسیار ، بسیار بالاتر حرکت کند. چیزی حتی نزدیک به 10،890 ٪. یک همه زمان جدید در سال 2025. حتماً دنبال کنید. از شما برای خواندن. namaste تشکر می کنم.

ترجمه شده از: English
نمایش اصل پیام
نوع سیگنال: خرید
تایم فریم:
1 هفته
قیمت لحظه انتشار:
‎$۰٫۰۱۹۷
اشتراک گذاری
چه نمادی برای خرید از VELO بهتر است؟
Eliptical
Eliptical
رتبه: 27279
1.0
خرید،تکنیکال،Eliptical

خوب این به روزرسانی نهایی برای مدتی در VELO به نظر می رسد که خونریزی در حال آزمایش مجدد خط روند بود

ترجمه شده از: English
نمایش اصل پیام
نوع سیگنال: خرید
تایم فریم:
1 هفته
اولین حمایت:
‎$۰٫۰۱۷۷۰۵
اولین مقاومت:
‎$۰٫۰۲۳۷۳۷
قیمت لحظه انتشار:
‎$۰٫۰۱۷۸۰۴
اشتراک گذاری
Kenny_Krypto
Kenny_Krypto
رتبه: 3855
2.0
خرید،تکنیکال،Kenny_Krypto

VELO - incomingBinance 2 دلاری مخفیانه این سکه را جمع آوری کرده است و در لیست قرار نگرفته است. آنها چیزی می دانند که شما تا به حال نمی دانید. لذت ببرید.

ترجمه شده از: English
نمایش اصل پیام
نوع سیگنال: خرید
تایم فریم:
1 ماه
حد سود:
‎$۲
اولین حمایت:
‎$۱٫۷۳
اولین مقاومت:
‎$۱٫۹۲
قیمت لحظه انتشار:
‎$۰٫۰۲۵۱۷۴
اشتراک گذاری
Eliptical
Eliptical
رتبه: 27279
1.0
خرید،تکنیکال،Eliptical

فقط یک محاکمه برای تجارت برای velo در کوتاه مدت که انجام نمی شود بلکه به دنبال نحوه عملکرد و اجرای آن در NFA کوتاه مدت است

ترجمه شده از: English
نمایش اصل پیام
نوع سیگنال: خرید
تایم فریم:
4 ساعت
اولین حمایت:
‎$۰٫۰۱۸۶۸۸
اولین مقاومت:
‎$۰٫۰۲۳۷۵
قیمت لحظه انتشار:
‎$۰٫۰۲۲۴۸۴
اشتراک گذاری
Eliptical
Eliptical
رتبه: 27279
1.0
خرید،تکنیکال،Eliptical

به دلیل راه اندازی سکه Trump meme ، همه چیز در حال حاضر عالی به نظر نمی رسد اما هاپیوم همان چیزی است که همه ما در آن زنده می مانیم فردا بهتر از امروز بود

ترجمه شده از: English
نمایش اصل پیام
نوع سیگنال: خرید
تایم فریم:
4 ساعت
اولین حمایت:
‎$۰٫۰۱۵۲۷۵
اولین مقاومت:
‎$۰٫۰۲۷۹۹۹
قیمت لحظه انتشار:
‎$۰٫۰۲۳۳۵۴
اشتراک گذاری
CrocoCrypto
CrocoCrypto
رتبه: 250
3.2
خرید،تکنیکال،CrocoCrypto

Velo یکی از بهترین‌های موجود است. اولین TP با 0.10$. از هفته آینده شاهد پیشرفت‌های بزرگی بود. طولانی و قوی.

ترجمه شده از: English
نمایش اصل پیام
نوع سیگنال: خرید
تایم فریم:
4 ساعت
حد سود:
‎$۰٫۱
اولین حمایت:
‎$۰٫۰۱۴۰۵
اولین مقاومت:
‎$۰٫۰۳۲۴۰۳
قیمت لحظه انتشار:
‎$۰٫۰۳۲۴۳۵
اشتراک گذاری
brandlabelden
brandlabelden
رتبه: 219
3.2
فروش،تکنیکال،brandlabelden

As the crypto market continues to fluctuate, VELOUSDT is at a crossroads. Currently trading at $0.02188, the asset has retraced -43.85% from its recent peak of $0.038965 set just three days ago​. This places it in a prime zone of interest for both bulls and bears. With a low RSI14 at 21.15, VELO is heavily oversold on the 1-hour chart, suggesting a potential rebound is on the horizon​. Meanwhile, the 60-period MFI at 26.60 hints at waning selling pressure​.The emergence of consecutive VSA Buy Patterns in the past few sessions supports the hypothesis of a possible reversal​. However, a break above the resistance at $0.026136 would provide stronger confirmation for a bullish move​.Could this be your chance to catch a trend early, or will VELO test deeper waters before turning? Keep an eye on these levels, and stay tuned for the next steps in its journey. Are you ready to trade with precision?Roadmap: VELOUSDT Patterns UnveiledDive into the historical path of VELOUSDT to uncover how patterns have shaped its journey. This roadmap highlights confirmed moves, discarding noise to reveal actionable insights for traders.1. VSA Manipulation Buy Pattern 2nd - January 19, 09:00 UTC*Main Direction: Buy*Opening Price: $0.023559 | Closing Price: $0.023816*Confirmation: The subsequent pattern at 10:00 UTC continued the bullish movement, closing higher at $0.022719 despite minor fluctuations. The direction aligned perfectly, validating the bullish forecast. This move showcased a strong rebound from a previous sell-off, marking a turning point for VELO.2. VSA Buy Pattern Extra 1st - January 19, 10:00 UTC*Main Direction: Buy*Opening Price: $0.023816 | Closing Price: $0.022719*Confirmation: At 11:00 UTC, the next candle continued the upward push, closing at $0.02188. While the price dipped initially, it tested lower support levels before rebounding in alignment with the bullish signal. This pattern highlighted a retest scenario before breaking out to higher levels.3. Increased Sell Volumes - January 19, 08:00 UTC*Main Direction: Sell*Opening Price: $0.025608 | Closing Price: $0.023559*Skipped: The subsequent patterns contradicted the bearish outlook, signaling that this pattern failed to confirm its trigger. This inconsistency marks it as a noise event in the roadmap.4. VSA Manipulation Sell Pattern 2nd - January 18, 08:00 UTC*Main Direction: Sell*Opening Price: $0.02829 | Closing Price: $0.02705*Confirmation: The following VSA Buy Pattern Extra 1st at 07:00 UTC indicated a minor reversal, but the broader trend remained downward. The sell signal was validated as prices continued to respect resistance levels and declined further.5. Increased Buy Volumes - January 18, 11:00 UTC*Main Direction: Buy*Opening Price: $0.026342 | Closing Price: $0.026624*Confirmation: Subsequent price action upheld the bullish move, rising toward $0.027213. This pattern was instrumental in identifying a shift in sentiment, with buyers reclaiming control after a prolonged sell-off.Key Takeaways for InvestorsPatterns like the VSA Buy Pattern 2nd consistently highlighted key turning points, offering valuable entry points.Noise events such as "Increased Sell Volumes" underline the importance of trigger confirmation in trading decisions.The roadmap demonstrates how aligning with confirmed patterns can improve forecasting accuracy and trading confidence.VELOUSDT's historical patterns showcase the critical role of precise analysis in navigating market volatility. Ready to capture the next move? Follow the roadmap and take control of your trading game!Technical & Price Action AnalysisSupport Levels:0.026136 – This level has been tested multiple times and shows solid buyer interest. If it breaks, expect it to flip into resistance, paving the way for lower action.0.029519 – Another critical support zone. If buyers fail to hold this, sellers will likely push through, making it a tough ceiling on the next retest.Powerful Support Levels:0.037063 – This is the fortress for bulls. A breakdown here signals a significant shift in sentiment, with the level becoming a prime resistance to watch.Resistance Levels:0.034017 – This area has capped recent upside moves. If bulls can break and close above, it could signal a trend reversal. Otherwise, it’ll remain a tough nut to crack.0.036148 – Another ceiling for the price. Watch how price reacts here; failure to break will likely lead to another round of selling pressure.Powerful Resistance Levels:0.013717 – Key battleground for sellers. A clear rejection here strengthens the bearish case. A break could open the floodgates for further bullish momentum.0.011988 – Strong historical resistance; a failure to close above this confirms seller dominance, turning it into a high-confidence short zone.0.010637 – This level acts as a line in the sand. A breakthrough could ignite new buying interest, but until then, it’s a key roadblock.0.00956 – Bottom-line resistance. If bulls can’t clear this, the bears will likely dominate the near-term price action.Failure to respect these levels can quickly flip them into critical zones for the opposite side of the trade. Stay nimble and keep your risk tight—the market’s watching, and so should you.Concept of Rays: Trading Strategies Based on Dynamic LevelsCore IdeaMy proprietary analysis method revolves around "Rays from the Beginning of Movement," constructed using Fibonacci mathematical and geometric principles. These rays form a system of dynamic levels to predict asset movements, emphasizing interactions rather than static levels. By analyzing price interaction with these rays, traders can infer scenarios of reversal or continuation—but only after confirming dynamic factors and patterns.Why Specific Levels Are Not PredictableFinancial markets are complex, nonlinear systems influenced by numerous variables such as liquidity, market sentiment, and macroeconomic forces. Instead of pinpointing exact levels, we focus on probabilities at pre-determined zones. Rays provide key insights into the direction and intensity of price movements when these zones are engaged.How Rays WorkFibonacci Rays: Each ray aligns with significant angles derived from natural proportions and is anchored at the origin of movement.Primary Advantage: Unlike traditional methods, rays are constructed from the movement’s starting point, enabling precise adjustments for new trends or corrections.Adaptability: Rays dynamically adjust with emerging patterns, offering fresh insights into movement boundaries.Ascending and Descending Rays: These define the movement channel’s limits and highlight interaction zones for potential entries.Optimistic ScenarioIf the price reacts positively to support levels, we expect movement along ascending rays to achieve successive targets:First Target: $0.026136 (Resistance Level 1)—Price interaction suggests continued bullish momentum after breaking through.Second Target: $0.029519—A key resistance zone where price momentum will likely face its next challenge.Third Target: $0.034017—Major resistance that aligns with the upper boundary of dynamic rays and Moving Averages.Pessimistic ScenarioIf the price fails at resistance and interacts negatively with descending rays:First Target: $0.02188 (Current Price Level)—A probable retest of support.Second Target: $0.011988—Dynamic interaction with powerful support, marking a critical zone to evaluate bearish persistence.Third Target: $0.00956—Final support level where sellers may dominate before potential consolidation.Dynamic Factors*Moving Averages—Levels at MA50 ($0.02873) and MA100 ($0.03257) act as additional dynamic resistance points. Interaction here confirms strength or weakness.*VSA Rays—Key zones on the chart interact with Volume Spread Analysis rays to offer enhanced clarity. Price moves between rays, using each as a potential stepping stone.Proposed TradesTrade 1: Long Position from $0.026136 to $0.029519—Enter on interaction with ascending ray and confirmation of bullish momentum.Trade 2: Short Position from $0.034017 to $0.02188—Triggered by rejection from upper resistance and descending ray.Trade 3: Long Position from $0.011988 to $0.026136—A high-probability reversal from powerful support.Trade 4: Short Position from $0.029519 to $0.011988—Dynamic resistance at MA100 confirms bearish continuation.Price movement along these rays allows traders to predict targets confidently. The beauty of this method lies in its flexibility and reliance on real-time interaction, ensuring adaptability in any market scenario.Got questions? Let’s discuss! Drop your thoughts and queries in the comments below—I’ll be happy to clarify or dive deeper into the analysis. Don’t forget to hit Boost and save this idea to revisit it later and see how the price follows the roadmap. Tracking key levels and reactions is the cornerstone of trading success.By the way, my proprietary indicator automatically plots all the rays and levels you see here. It’s available privately, so if you’re interested, feel free to message me directly to learn more.Need analysis for a specific asset? I’ve got you covered! I’m open to creating detailed markups—some I can share publicly, and others can be tailored exclusively for you. Whether it’s a broad market idea or a private strategy, let’s connect and find a solution that works for you.Remember, these rays work across all assets, guiding price movements with uncanny precision. If you have assets you’d like analyzed, give this post a Boost and mention them in the comments—I’ll do my best to include them in future updates.Finally, don’t miss out on more insights and strategies! Hit follow here on TradingView to stay updated with all my latest ideas and detailed analyses. Let’s navigate the markets together!

ترجمه شده از: English
نمایش اصل پیام
نوع سیگنال: فروش
تایم فریم:
10 ساعت
قیمت لحظه انتشار:
‎$۰٫۰۲۱۸۱۷
اشتراک گذاری
Cassious
Cassious
رتبه: 27478
0.9
خرید،تکنیکال،Cassious

راه‌اندازی خوب اینجا در Velocurrebtle که روی پشتیبانی بزرگ نشسته است برای خرید VELOUSD VELODROMEUSDT VELODROMEUSDT VELODUSD خوب به نظر می‌رسد

ترجمه شده از: English
نمایش اصل پیام
نوع سیگنال: خرید
تایم فریم:
1 روز
قیمت لحظه انتشار:
‎$۰٫۰۳۱۱۸۶
اشتراک گذاری
Traders_skooll
Traders_skooll
رتبه: 26952
1.2
خرید،تکنیکال،Traders_skooll

VELOUSDTVeloDrome Finance با توجه به بازار کند و نزولی فعلی برای بازه زمانی پایین بسیار قوی عمل می کند. همه alt های دیگر دارای 30-40% dump بودند در حالی که VELO ساختار خود را بسیار خوب نگه می دارد. ما می توانیم انتظار شکست مقاومت را خیلی زود با یک حرکت صعودی 50-70٪ داشته باشیم.

ترجمه شده از: English
نمایش اصل پیام
نوع سیگنال: خرید
تایم فریم:
4 ساعت
حد سود:
‎$۰٫۰۴۶
اولین مقاومت:
‎$۰٫۰۳۰۸۴۸
قیمت لحظه انتشار:
‎$۰٫۰۳۰۸۰۱
اشتراک گذاری
سلب مسئولیت

هر محتوا و مطالب مندرج در سایت و کانال‌های رسمی ارتباطی سهمتو، جمع‌بندی نظرات و تحلیل‌های شخصی و غیر تعهد آور بوده و هیچگونه توصیه‌ای مبنی بر خرید، فروش، ورود و یا خروج از بازار بورس و ارز دیجیتال نمی باشد. همچنین کلیه اخبار و تحلیل‌های مندرج در سایت و کانال‌ها، صرفا بازنشر اطلاعات از منابع رسمی و غیر رسمی داخلی و خارجی است و بدیهی است استفاده کنندگان محتوای مذکور، مسئول پیگیری و حصول اطمینان از اصالت و درستی مطالب هستند. از این رو ضمن سلب مسئولیت اعلام می‌دارد مسئولیت هرنوع تصمیم گیری و اقدام و سود و زیان احتمالی در بازار سرمایه و ارز دیجیتال، با شخص معامله گر است.
نماد برگزیده
برترین تریدر‌
دنبال شده
هشدار