Technical analysis by Risk_Adj_Return about Symbol AMZNX: Buy recommendation (10/20/2025)

Risk_Adj_Return
سهم آمازون (AMZN): چرا اکنون زمان خرید است؟ (فصل اوج + قدرت حاشیه سود)
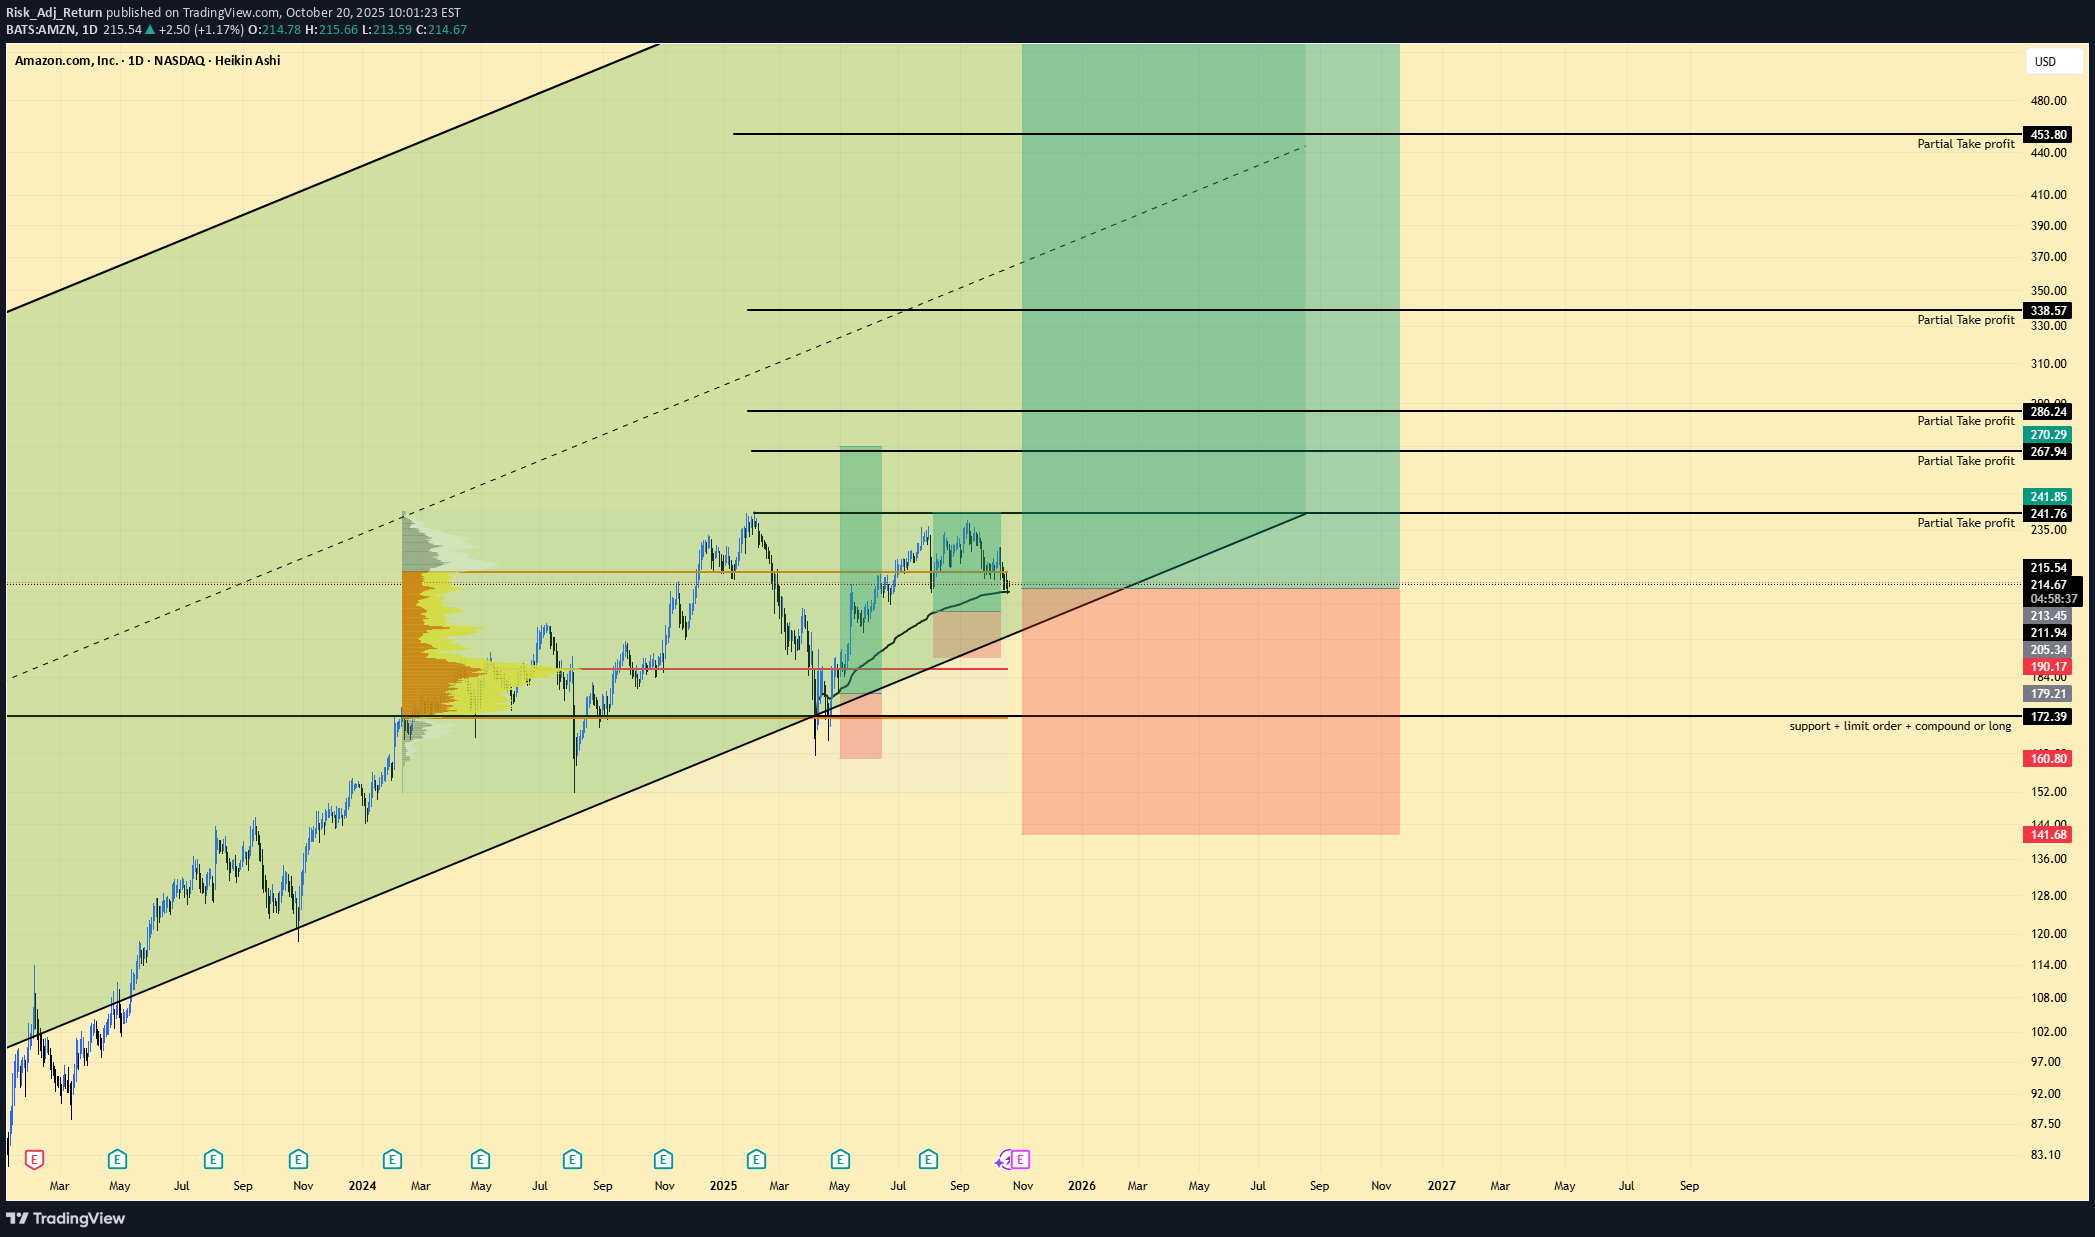
AMZN | Long Setup | Q4 Seasonality + AWS/Ads Margin Mix | Oct 20, 2025 🔹 Thesis Summary Amazon underperformed YTD but enters its strongest seasonal window into Q4 with margin mix improving (AWS + Ads). With earnings on Oct 30 and analyst targets clustered above spot, a defined-risk long seeks a channel continuation toward 292–317, stretching to 417 on multi-quarter follow-through. 🔹 Trade Setup Bias: Long Entry Zone: 209–216 (prior breakout retest + HVN) Stop Loss: 142 (below summer higher-low and volume shelf) Take-Profits: • TP1: ~241 • TP2: ~267 • TP3: ~290 • Max Target: 317.1 (extension 417.3 on multi-quarter trend) R:R (from 213 mid-entry): to TP1 ≈1.4:1, TP2 ≈2.2:1, TP3 ≈3.8:1, Max ≈5.0:1 (417 ≈9.7:1) 🔹 Narrative & Context Price respects a 2023–2025 rising channel; recent pullback held the channel midline and a dense volume node near 210–212. Multi-tap resistance at 241–246 is the first decision area; clearing it opens 260–292 (measured move from the summer base). Seasonality favors strength into Nov–Dec, and earnings (Oct 30; EPS est 1.57 on $177.8B rev) can catalyze a range expansion. Street positioning remains constructive: 1-yr price-target avg ~265, range 230–306, with a dominant Strong Buy skew and a visible EPS beat cadence on recent quarters. Operational quality remains intact (Gross margin ~49.6%, Op margin ~11.5%, Profit margin ~10.5%). Balance sheet leverage is restrained (LT Debt/Equity ~0.40). Valuation & Context (Pro Metrics, Framed Simply) Forward P/E ≈ 28.3x vs large-cap megatech peers mid-20s → modest premium → market pricing AWS/Ads mix resilience → premium is acceptable if EPS growth tracks mid-teens. P/FCF (screen) elevated vs Alphabet/Microsoft → investors paying up for reinvestment runway → acceptable if AI capex converts to durable cash yields; watch 2026 FCF inflection. ROIC ≈ 15% vs peers: GOOGL ~29%, MSFT ~23% → solid but not best-in-class → upside if Ads/AWS mix lifts returns. EPS growth next 5y ~19% → above retail/consumer staples → supports multiple stability through the cycle. Debt/Equity ~0.46 → conservative leverage → reduces drawdown risk around macro or regulatory shocks. 🔹 Contrarian Angle (Your Edge) Consensus clusters $230–$306 with focus on AWS deceleration. Price structure shows accumulation above 209–212 and an intact up-channel. With Q4 seasonality, improving operating leverage, and continuing Ads share gains, we see a path to 292–317 in 1–3 quarters and 417 on a multi-quarter trend extension if margins expand 100–150 bps from mix. 🔹 Risks (Balanced) AWS growth undershoots or margin compression from AI capex. Regulatory/antitrust actions affecting retail or Ads. Consumer softness or post-earnings gap below 200 invalidating the base. 🔹 Macro Considerations Track NDX breadth and real yields; higher real rates could cap the multiple. USD strength pressures international; weakness helps. Event risk: Oct 30 earnings, CPI/PCE prints, and large-cap tech earnings read-through; watch cloud commentary from MSFT/GOOGL for competitive signals. 🔹 Bottom Line AMZN screens slightly expensive on headline multiples, but the mix (AWS/Ads) and Q4 seasonality justify a defined-risk long. Above 246, momentum opens 260–292; sustained strength targets 317, with 417 as an extended objective if margins and FCF inflect through 2026. 🔹 Forward Path If this post gets 10+ likes, I’ll publish a follow-up on the weekly structure, update earnings levels (gap/hold/fail), and adjust targets based on post-print volume profile. Like & Follow for structured ideas, not signals. I post high-conviction setups here before broader narratives play out. ⚠️ Disclaimer: This is not financial advice. Always do your own research. Charts and visuals may include AI enhancements. 🔹 Footnote Forward P/E: Price divided by expected earnings over the next 12 months. Lower = cheaper relative to profits. P/FCF (Price-to-Free-Cash-Flow): Price vs. the cash left after investments. A measure of efficiency. FCF Yield: Free cash flow per share ÷ price per share. Higher = more cash returned for each dollar invested. ROE (Return on Equity): Net income ÷ shareholder equity. Shows management efficiency with investor capital. ROIC (Return on Invested Capital): Net income ÷ all invested capital (equity + debt). A purer profitability gauge. Debt/Equity: Debt divided by equity. <1 usually means balance sheet is conservative. R:R (Risk-to-Reward): Ratio of expected upside vs. downside. 3:1 = you risk $1 to make $3.