Technical analysis by Risk_Adj_Return about Symbol ETH: Sell recommendation (11/5/2025)

Risk_Adj_Return
پیشبینی ریزشی اتریوم (ETH): فرصت شورتگیری با استراتژی VWAP تا ۳۰۰۰ دلار!
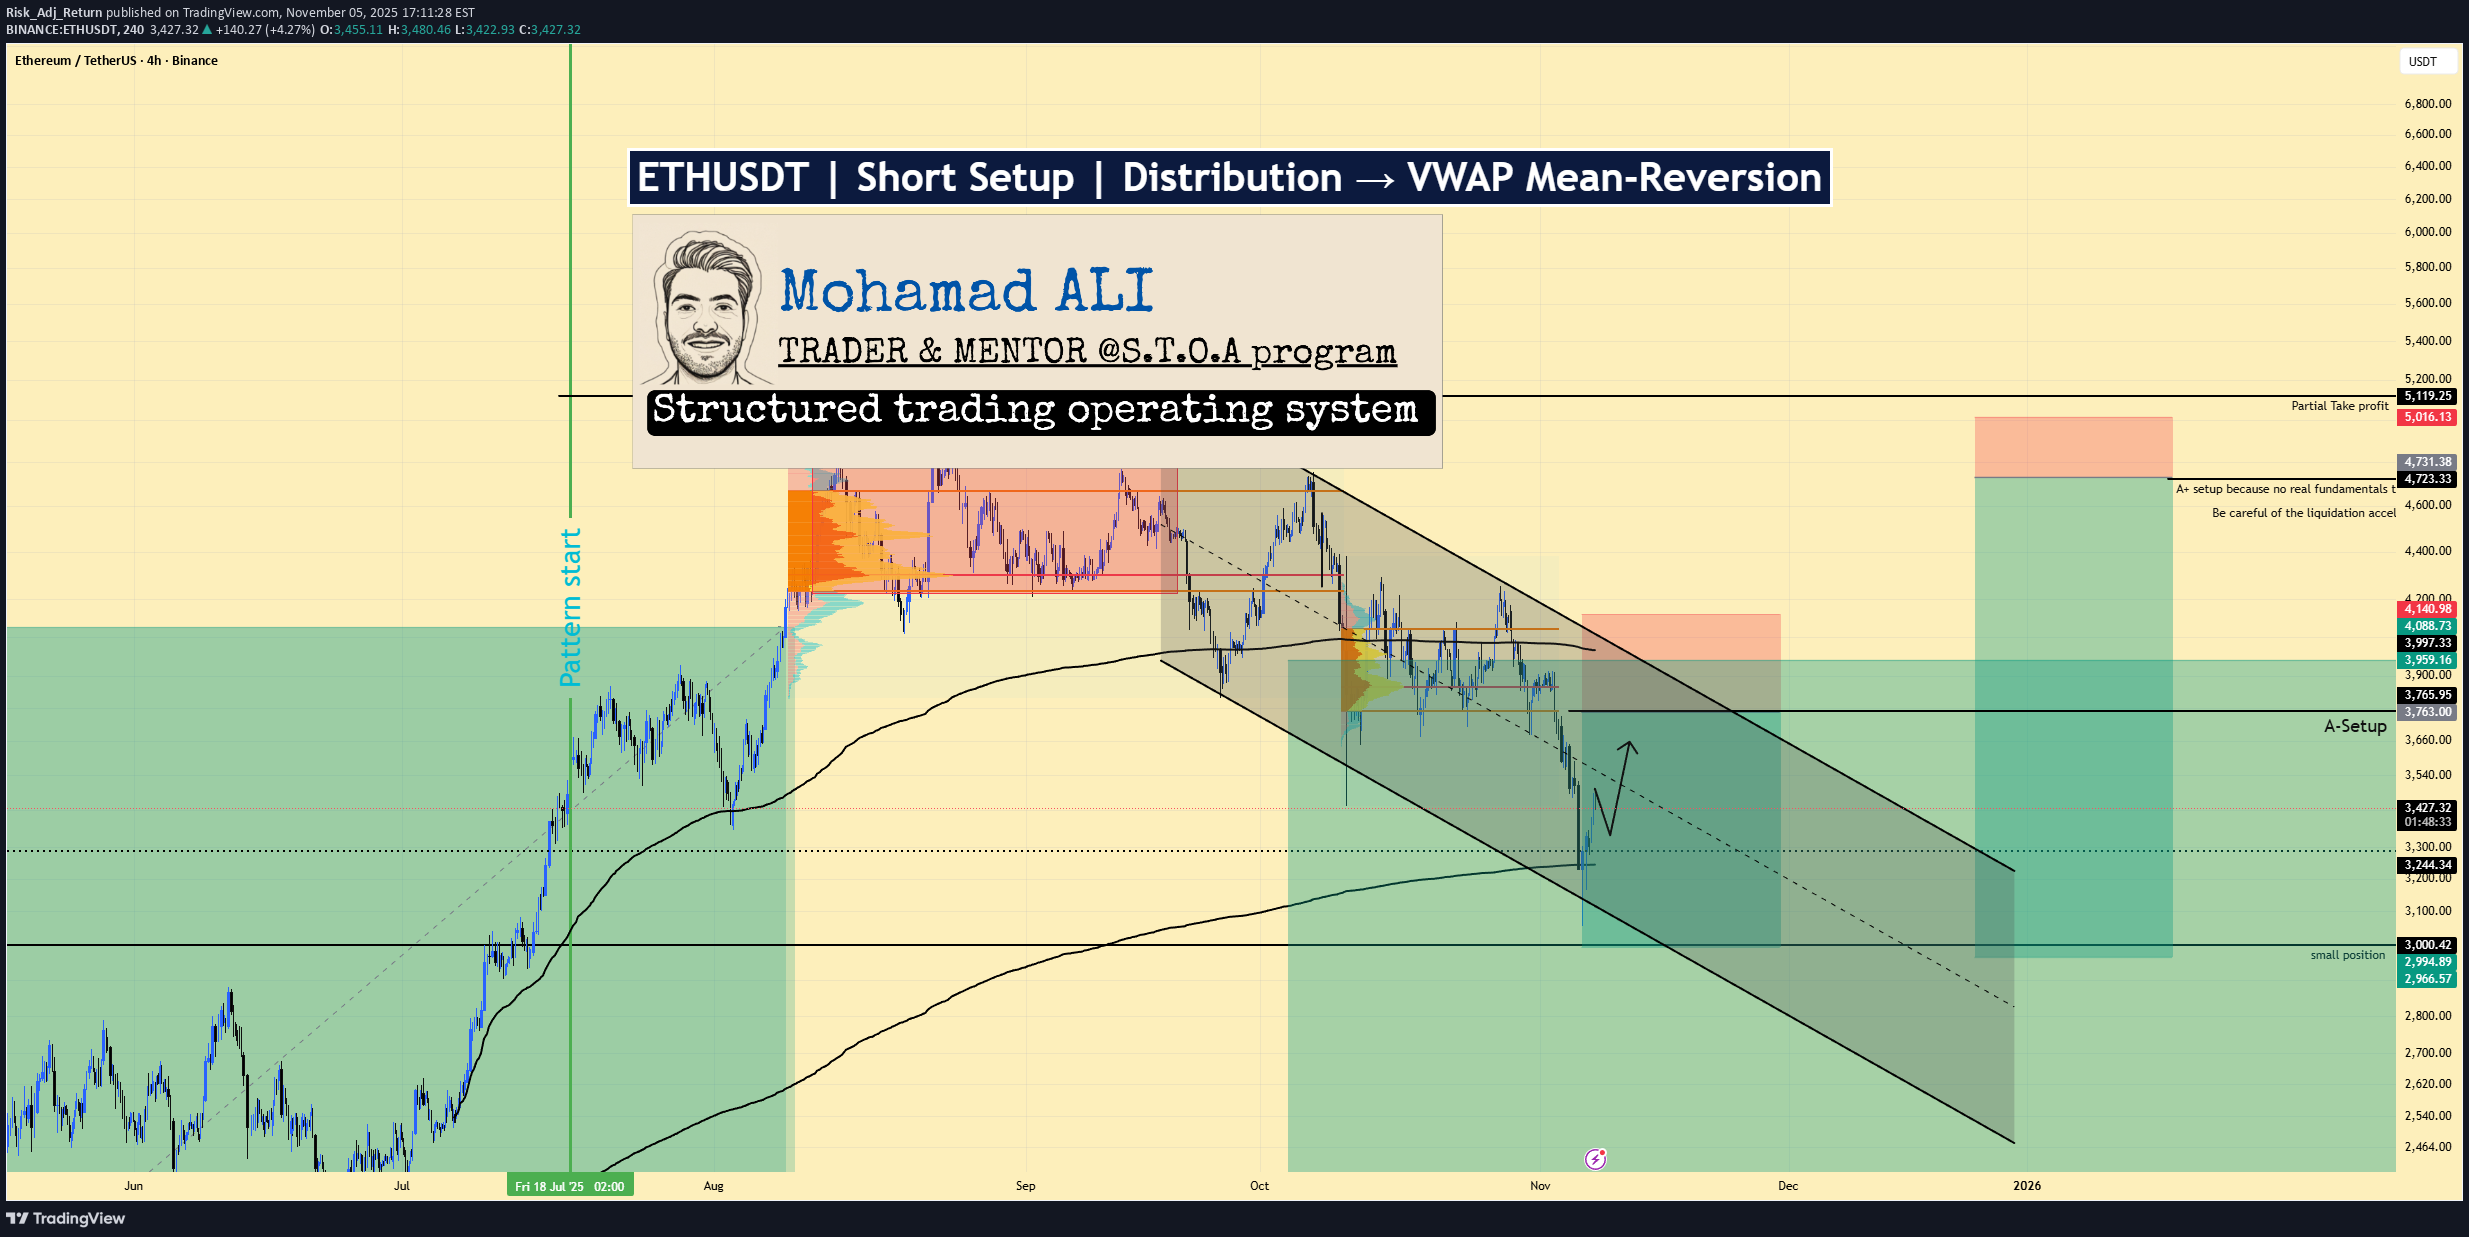
ETHUSDT | Short Setup | Distribution → VWAP Mean-Reversion | Nov 5, 2025 🔹 Thesis Summary ETH is bouncing inside a corrective leg after clear distribution. A retest of ~3,756 into prior value and VWAP resistance offers asymmetric short exposure toward 3.3k → 3.0k, with deeper paths to 2.5k–2.0k if risk-off accelerates. 🔹 Trade Setup Bias: Short Entry Zone: 3,720–3,780 (primary), optional add on overshoot into 3,860–3,900 Stop Loss (hard invalidation): 4,150 (daily close back above prior distribution high) Take-Profits: TP1: 3,300 (first VWAP/mid-range reaction) TP2: 3,000 (range low / liquidity shelf) TP3: 2,500 (capitulation pocket) Max Target: 2,000 (cycle mean-reversion) Indicative R:R (from 3,750 vs 4,150): TP1 ≈ 1.1R, TP2 ≈ 1.9R, TP3 ≈ 3.1R, Max ≈ 4.4R 🔹 Narrative & Context Structure: Left-side distribution is clear; subsequent liquidation aligned with the classic cycle (distribution → correction → accumulation). Current rally is corrective into a prior value area/high-volume node around 3,750–3,900, where supply previously dominated. VWAP & Means: Price is orbiting multi-week VWAP bands; first touch/retest of the upper band into that A-setup line near 3,765 is where sellers have edge with defined risk. Sector & Rotations: SPX remains semiconductor-heavy; the Aug 25–Sep 20 window showed distribution/exit flows, consistent with a broad risk-off tone spilling into crypto. Alt breadth is weakening first (early panic tells). Leverage & Flow (pro watch-items): Into the short zone, watch for positive perp funding + rising OI (late longs), ETH/BTC underperformance, and basis cooling—all consistent with a re-short after a squeeze. 🔹 Valuation & Context (Pro Metrics, Framed Simply) Perp Funding Rate: Positive/expanding into resistance → indicates long-side crowding → increases squeeze-then-fade probability at 3.75–3.90k → supports short timing. Open Interest vs. Price: OI rising on up-ticks → leverage adding into supply → raises liquidation risk on pullback → improves short R:R. ETH/BTC Ratio: Weak/flat vs BTC → capital prefers base-layer beta over ETH beta → less support on bounces → aligns with lower targets on rejection. 🔹 Contrarian Angle (Your Edge) Consensus is leaning toward “buy-the-dip into year-end flows.” Our read: acceptance back into prior value is failing, VWAP is capping, and leverage is rebuilding into supply. That combination often precedes a second-leg lower toward 3.0k with room to 2.5k if macro tightens. 🔹 Risks Sudden risk-on impulse (index squeeze, dovish macro headline) pushing ETH through 4,150. Catalyst risk (unexpected ETH-specific positive news/flows) that invalidates distribution. Liquidity pockets: thin books amplify wicks; poor fills if size isn’t laddered. 🔹 Macro Considerations DXY firming and VIX pressing higher favor risk-off follow-through; a DXY fade or vol crush would reduce downside velocity. Gold stretched and due to cool → typically aligns with a broader cross-asset balance; a hard gold bid with rising VIX would strengthen risk-off. Track NQ/semis: continued weakness supports the ETH short; a decisive semiconductor rebound would argue for patience or reduced size. 🔹 Bottom Line Defined-risk short into 3,720–3,780 with invalidation 4,150. First objective 3,300, core target 3,000; extended bear paths 2,500–2,000 if macro stays risk-off. Trade the structure, hedge, and keep sizing disciplined. 🔹 Forward Path If this post gains traction (10+ likes), I’ll publish: A weekly-frame update on the distribution range and VWAP bands Breakout/invalidations above 3.90k–4.15k and how that flips bias Comments thread Q&A on execution (laddering, partials, hedge overlays) Like & Follow for structured ideas, not signals. I post high-conviction setups here before broader narratives play out. ⚠️ Disclaimer: This is not financial advice. Do your own research. Charts may include AI-assisted enhancements. 🔹 Footnote Forward P/E: Price divided by expected earnings over the next 12 months. Lower = cheaper relative to profits. P/FCF (Price-to-Free-Cash-Flow): Price vs. the cash left after investments. A measure of efficiency. FCF Yield: Free cash flow per share ÷ price per share. Higher = more cash returned for each dollar invested. ROE (Return on Equity): Net income ÷ shareholder equity. Shows management efficiency with investor capital. ROIC (Return on Invested Capital): Net income ÷ all invested capital (equity + debt). A purer profitability gauge. Debt/Equity: Debt divided by equity. <1 usually means balance sheet is conservative. R:R (Risk-to-Reward): Ratio of expected upside vs. downside. 3:1 = you risk $1 to make $3.