Technical analysis by Risk_Adj_Return about Symbol SOL: Sell recommendation (11/5/2025)

Risk_Adj_Return
شانس فروش سولانا (SOL) از کجا آغاز میشود؟ تحلیل تکنیکال دقیق با اهداف قیمتی جدید
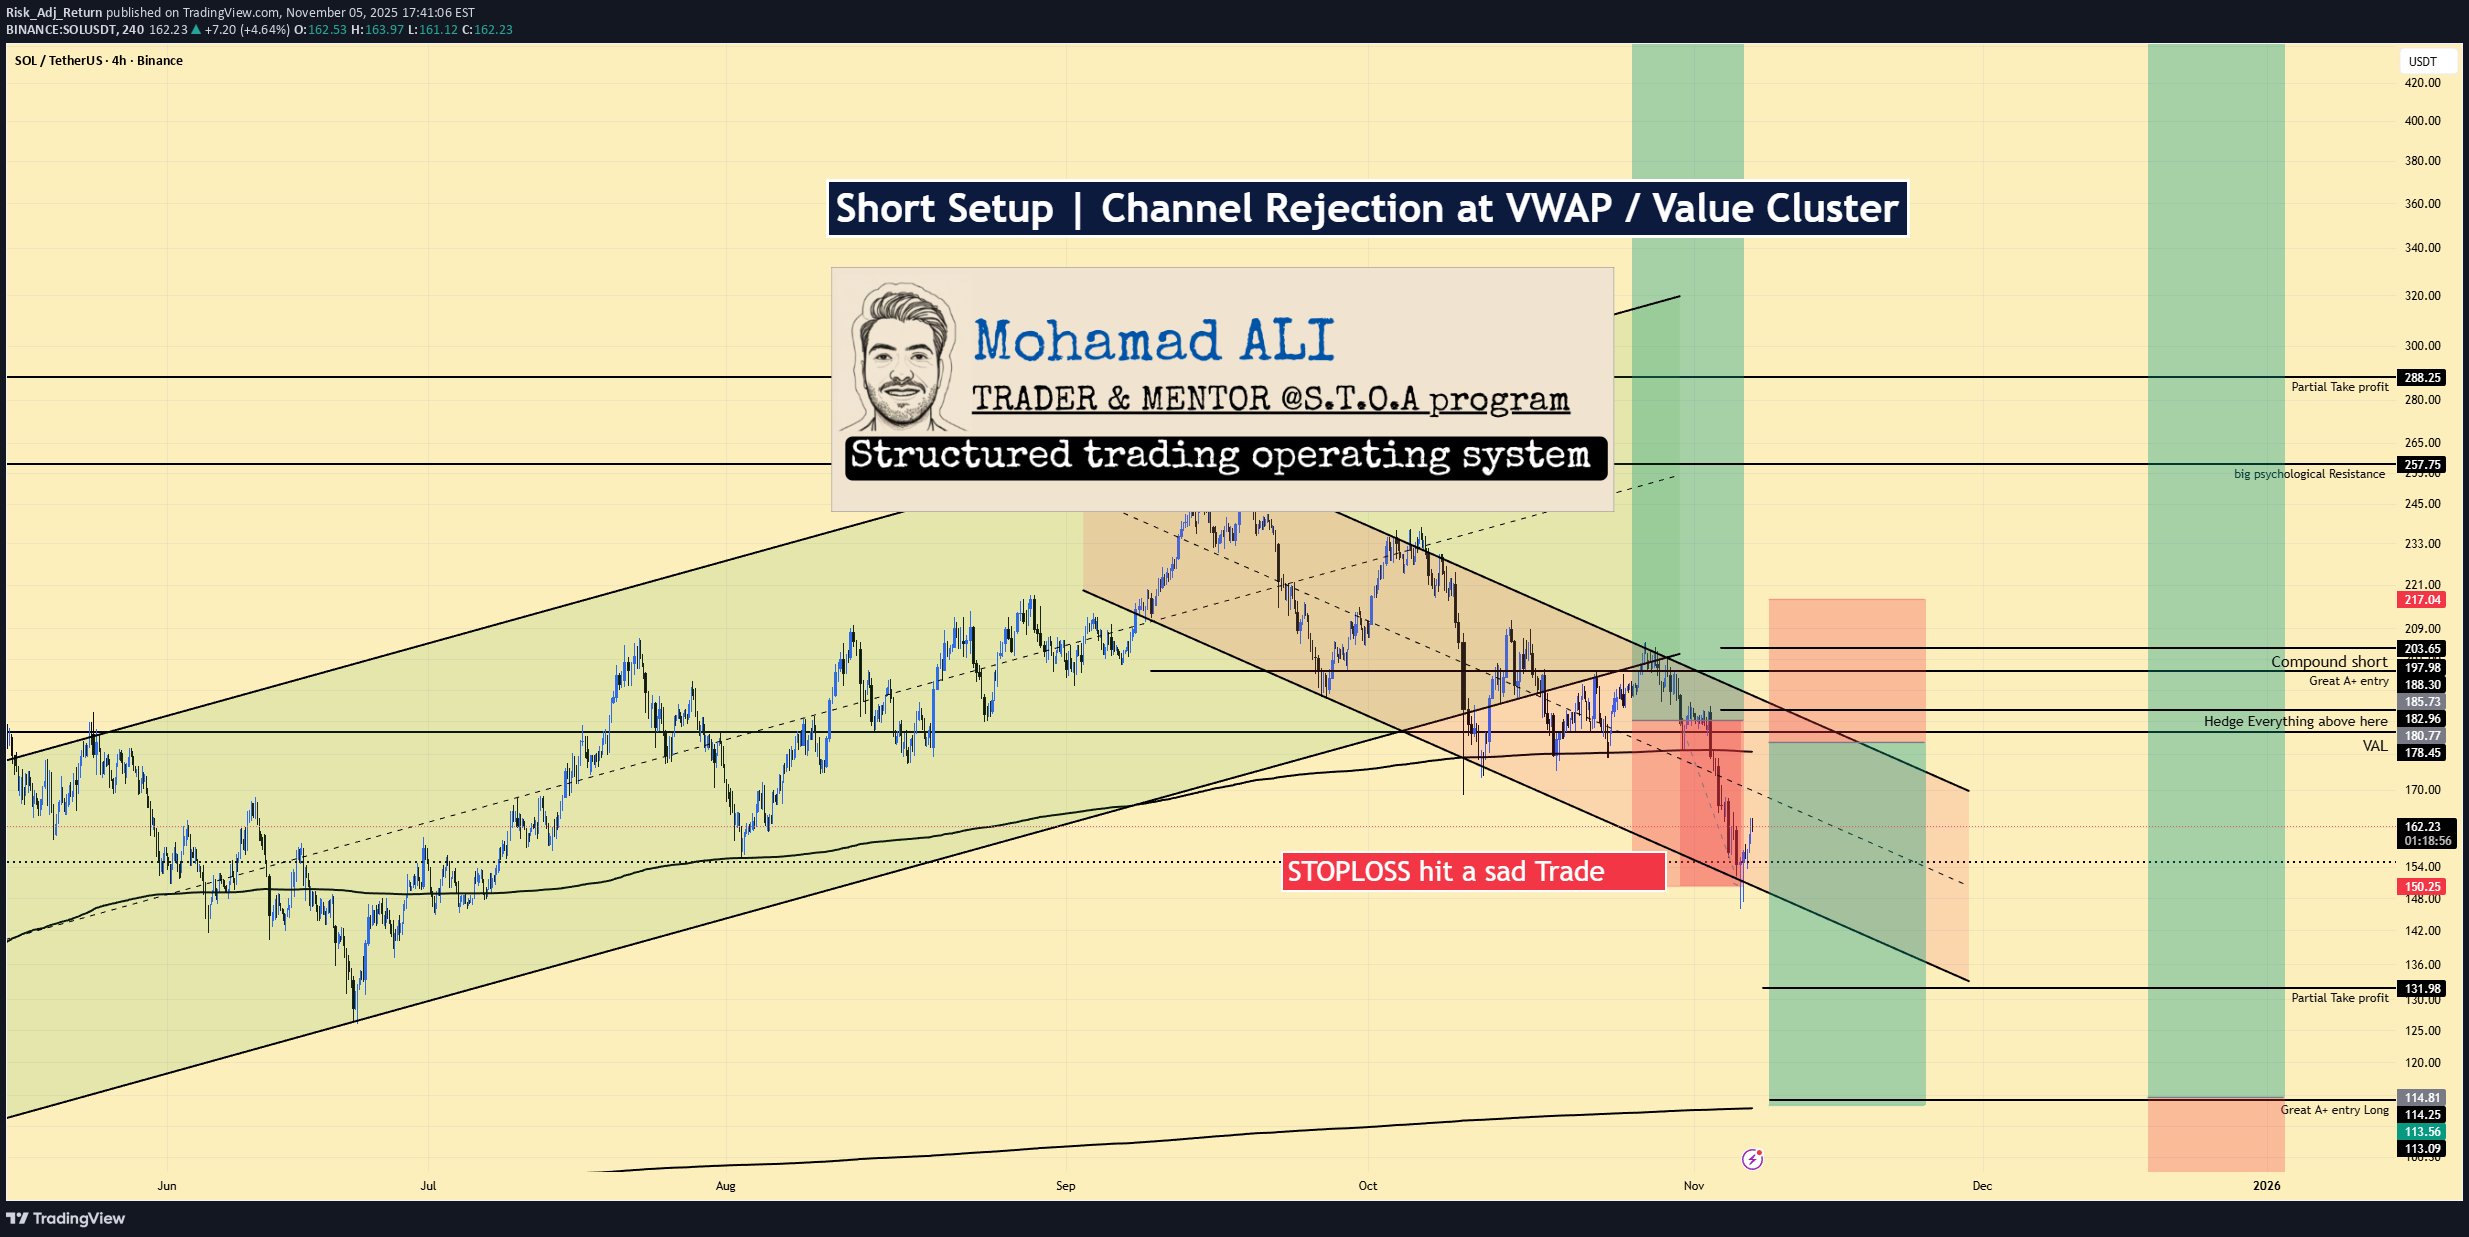
SOLUSDT | Short Setup | Channel Rejection at VWAP / Value Cluster | Nov 5, 2025 🔹 Thesis Summary SOL is bouncing inside a descending parallel channel. A push into the 188–203 supply band (VWAP/value cluster) offers a defined-risk short back toward 150/132 as broad crypto remains correlation-heavy and fragile. 🔹 Trade Setup Bias: Short Entry Zone: 188–203 (prior supply; confluence with anchored VWAP/upper channel) Stop Loss: 217 (acceptance above supply → invalidate short idea) Take-Profits: TP1: 150 (mid-channel / liquidity shelf) TP2: 132 (prior reaction / partial-TP on chart) TP3 (stretch): 114 (channel lower bound / “A+ long” area) Indicative R:R (mid-fill 195 vs 217): If filled closer to 1.88, R:R compresses; closer to 203, it expands. Laddering helps execution. 🔹 Narrative & Context Structure: Clear lower highs/lows within a well-defined downward channel. The 188–203 zone aligns with prior distribution, multiple failed breakouts, and a visible liquidity pocket just under 200. VWAP & Value: Price frequently mean-reverts to the anchored VWAP from the prior breakdown; 188–195 is the first area where sellers historically regain control. Correlation: Crypto remains tightly co-moving; beta shocks propagate across majors. Breadth is weakening on alts first—typical of the distribution → correction phase. Execution: Look for a bounce into 188–203 with positive funding and rising OI (late longs) and fading spot CVD—then fade the move with tight invalidation. A clean break/hold above 217 flips bias. 🔹 Valuation & Context (Pro Metrics, Framed Simply) Perp Funding → Peer/Historical: Positive/expanding into resistance vs neutral on BTC → crowded long into supply → increases squeeze-then-fade odds → supports short timing. Open Interest → Regime Check: OI rising with price into 188–203 vs flat spot flows → leverage leading → greater liquidation risk on pullback → aligns with targets 150/132. SOL/BTC Cross → Relative Strength: Underperformance on bounces vs BTC/ETH → weaker risk appetite for SOL beta → rallies likely sold at value → fits channel-fade plan. Basis (Perp Premium) → Thresholds: Premium > ~10–15% annualized vs spot → stretched leverage → signals to scale shorts; flat/discount basis → stand aside. 🔹 Contrarian Angle (Your Edge) Consensus leans “SOL leadership continues.” Our read: supply sits heavy at 188–203, VWAP caps, and leverage rebuilds into resistance. That combination often precedes a second leg lower toward 150 → 132, with an extension to 114 before any durable base. Long-term bull case remains intact after a proper reset (W-base risk). 🔹 Risks Impulsive risk-on (index squeeze, dovish macro) forcing acceptance above 217. SOL-specific catalysts (ecosystem launches/flows) that negate supply. Liquidity gaps/wick risk: thin books can overshoot levels; size and ladder accordingly. 🔹 Macro Considerations DXY firm + VIX bid support a broader correction; a vol crush or dollar fade weakens the short. Semis/NQ drive cross-asset beta; strength there argues patience. BTC dominance up → alt underperformance risk; BTC breakdown, however, accelerates the path to 150/132. 🔹 Bottom Line Tactical short the rip into 188–203 with hard invalidation at 217. Manage into 150/132, stretch to 114 if macro stays risk-off. Keep sizing conservative, respect correlation, and hedge. 🔹 Forward Path If this gains traction (10+ likes), I’ll post: A weekly-frame update of the channel/VWAP map Playbook if 217 breaks (what flips the bias) Execution notes (laddering, hedge overlays, basis/funding triggers) Like & Follow for structured ideas, not signals. I post high-conviction setups here before broader narratives play out. ⚠️ Disclaimer: This is not financial advice. Do your own research. Charts may include AI-assisted enhancements. 🔹 Footnote Forward P/E: Price divided by expected earnings over the next 12 months. Lower = cheaper relative to profits. P/FCF (Price-to-Free-Cash-Flow): Price vs. the cash left after investments. A measure of efficiency. FCF Yield: Free cash flow per share ÷ price per share. Higher = more cash returned for each dollar invested. ROE (Return on Equity): Net income ÷ shareholder equity. Shows management efficiency with investor capital. ROIC (Return on Invested Capital): Net income ÷ all invested capital (equity + debt). A purer profitability gauge. Debt/Equity: Debt divided by equity. <1 usually means balance sheet is conservative. R:R (Risk-to-Reward): Ratio of expected upside vs. downside. 3:1 = you risk $1 to make $3.