
MoralDisciple
@t_MoralDisciple

What symbols does the trader recommend buying?
Purchase History
پیام های تریدر
Filter
MoralDisciple
سقوط بیت کوین به ۸۵ هزار دلار: تحلیل شوکهکننده و هشدار برای آلتکوینها
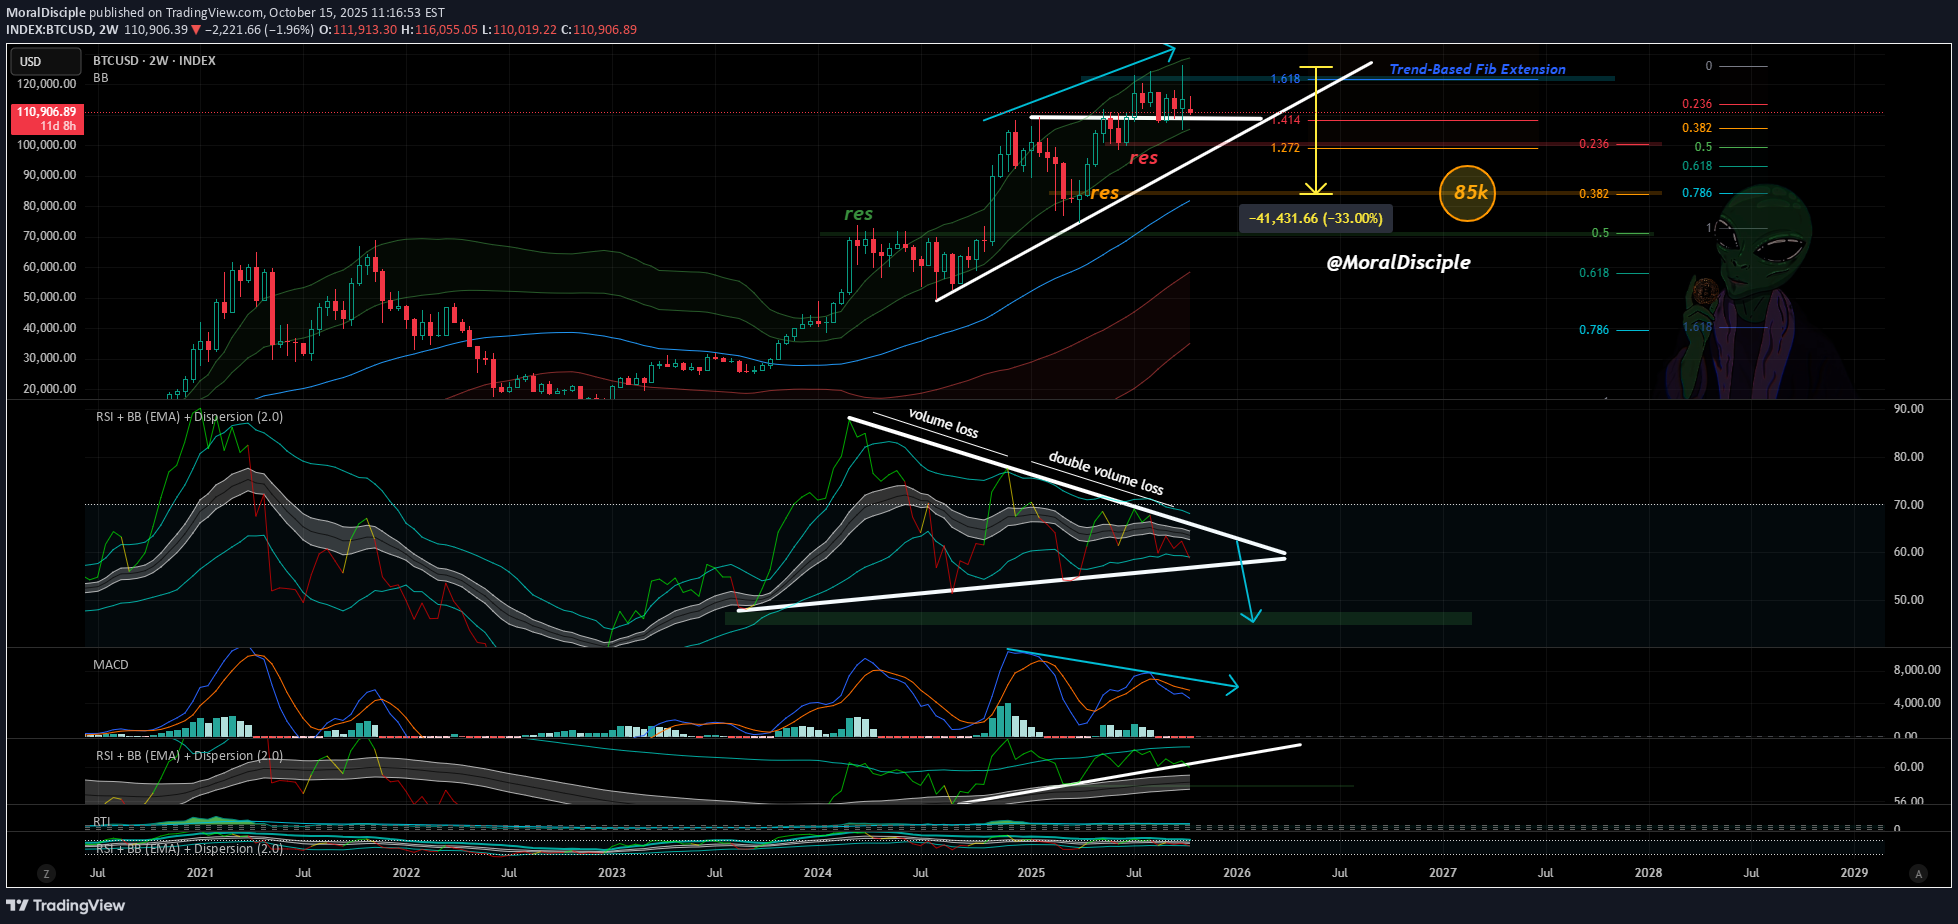
BTC's rise that started in April is currently in a strong volume loss. Today's assumption is below the White trend line and with the price pattern RES and fib level, it seems to be an 85k decline. In the area where BTC is, every green is sus, if this still happens there. The altcoin crypto crash was wonderfully catastrophic and BTC will probably slow down their recovery. Some decline was likely but I would not have expected such price levels to come so quickly and already in October.. Binance crypto charts are especially extreme, showing more decline compared to other stock charts, such a difference causes me confusion in analysis today.... I predicted a decline on the CMC page and I myself have not been negatively affected by it, but this situation caused some to lose all their money and some ended in suicide, especially those who traded altcoins with leverage, quite sad. BTC decides what will happen next with altcoins, if BTC analysis is true then it will be difficult to predict a good rise for altcoins before BTC drops. Welcome to Coinmarketcap, coinmarketcap.com/community/profile/MoralDisciple/ The conditions are better for me there and most of the analysis is crypto-related anyway, I fit in there. MD
MoralDisciple
Does anyone think that buying bitcoin is too expensive?
Does anyone think that buying bitcoin is too expensive? These people will regret their opinion in the future. I believe it will grow another 200%. Many altcoins say that, seeing how cheap they are and how little support there is for a big Bitcoin crash, I see the rise continuing. +there haven't been normal altseasons, I believe it's still ahead and will come. How are you doing? I hope you're doing well But what about me? I didn't do so well... I got into a serious car accident... I was driving 150 km/h and had a terrible car accident, how am I still alive, you ask? I don't even know the answer to that, but I miraculously survived. All that was left of the car was a big pile of metal... Maybe my guardian angels protected me and didn't let me die? Who knows, but I was very lucky that my soul remained in my body. Today I'm on my feet and the major threats in the hospital have passed, but I'm still in pain and the recovery has been long and it continues. The doctor says that I will be completely healed one day and life will continue for a while as if the accident had not happened. Except for the scars, they leave a memory. I will not be trading weekly this year and will not be restoring my indicator system with a Premium account, which is especially important for weekly trades. I also do not intend to share any theories here at this time, today's btc analysis was an exception. I will let myself recover and rest peacefully before I continue with more activity. However, I will monitor the situation and only do big-picture analyses for myself, if I can do them, but I will not burden myself too much. I started sharing analysis images on Coinmarketcap page, where I don't add any special text, just a few sentences. It's easy for me Be green and see you here in half a year, if I recover faster then a few months earlier and we will restore the indicator system. Peace to you And you know what else? MAKE BITCOIN PUMP, WHAT ARE YOU WAITING FOR MD✌️Screaming risk in my eyes. abc volume or price pattern + long needle + resistance. I'm afraid of the red candle closing on the 1M chart. I'm just warning about the temporary cooling that today's analyses indicates. stay safe TOTAL Some altcoin analysis can be found on the cmc page: coinmarketcap.com/community/profile/MoralDisciple/If true, it could last for several months, 2 or..... 3?. As mentioned in the previous comment, there is a clear ABC + orange line resistance and the yellow box looks like an S-signal + before this signal there is a double top DT and it drops below the orange line, which shows clear weakness. Based on the current information, I set the ABC downtrend at around 90k. The illustrative waves can differ in reality... why did I even say that lol It's a shame that the initial analysis is ruined, but so common. In July I expected a slightly smaller decline... in fact it's not ruined yet but I believe it will happen, considering the btc and alt analyses. Actually, it's good, you have time to steal some money from somewhere to put it into bitcoin later, and at a discount price haha. See you in a couple of months in a new analysis and then also altcoins
MoralDisciple
Old good

Old one but still works today and the rsi(/macd) comparison is based on it where today's is 4 times larger. Seed analysis: Comparison of three different time frames: 1 2 3 + in the same area there is a liquidation movement Can it continue this truth? i don't know but it is too much similar.us500 hints that there can be more decline in 2025 and the next greens will fall back (IF greens come). I already talked about the loss of volume of us500 and several stocks in some btc analysis(jan/veb) and that the situation looks suspicious and today we can see the first results. All this can affect bitcoin. since I don't feel like sharing separate altcoin analyses, I'll talk about some altcoins here: *DOGE*, gave the worst decline in history, which signal has not been seen on rsi indicators (different time frames) before. It is so strong that it gives the probability that if greens are coming, they will fall back where they came from(applies to several other meme coins). *SOL*, the decline looks like a big point A, where every green can be at risk of correction (point b). Absolutely impossible to predict anything else about it today. *ETH*, in my eyes it is clear that in 2025 it will not make a new ath (not even over 4k) unless it is at some x moment like an xrp pump x) but hardly. but any greens are expected to come lower. maybe next month when btc can leave March in the red? we will see. *TRX* idiotically fast pump has only made it suspicious the fourth was already too much, the fifth will not comex). In summary, it seems that the situation will not recover quickly. right now I'm thinking of altcoins that have reached a strong catastrophe. this is no longer a correction, in the case of bitcoin it cannot be said for sure yet, because it is still holding up well compared to others. And an update to the base analysis: let's see if it can continue
MoralDisciple
MONERO

XMR has made a double support and after that today is BS and hopefully we are hoping for a strong abc volume or in other words every trader's dream. We are honest, actually pure copying of history, but as you can see, it has worked well so far and we hope that nothing comes and ruins our opportunity, but you never know for sure. SL is always necessary anyway. The volume is smaller compared to many other coins, but this is definitely not a problem, you can always use leverage. I was actually worried what a btc crash could do to xmr coin if a btc crash is true. as you can see monero is doing its thing and is not being radically disrupted by bitcoin. google copy *xmr is a cryptocurrency that uses blockchain with privacy enhancing technologies to obfuscate transactions to achieve anonymity and fungibility* What do you think? Perfect for storing criminal money and making trades to buy drugs, we are encouraging crime and turning it into a pump haha. comparison of indicators: Copying history! what could be wrong
MoralDisciple
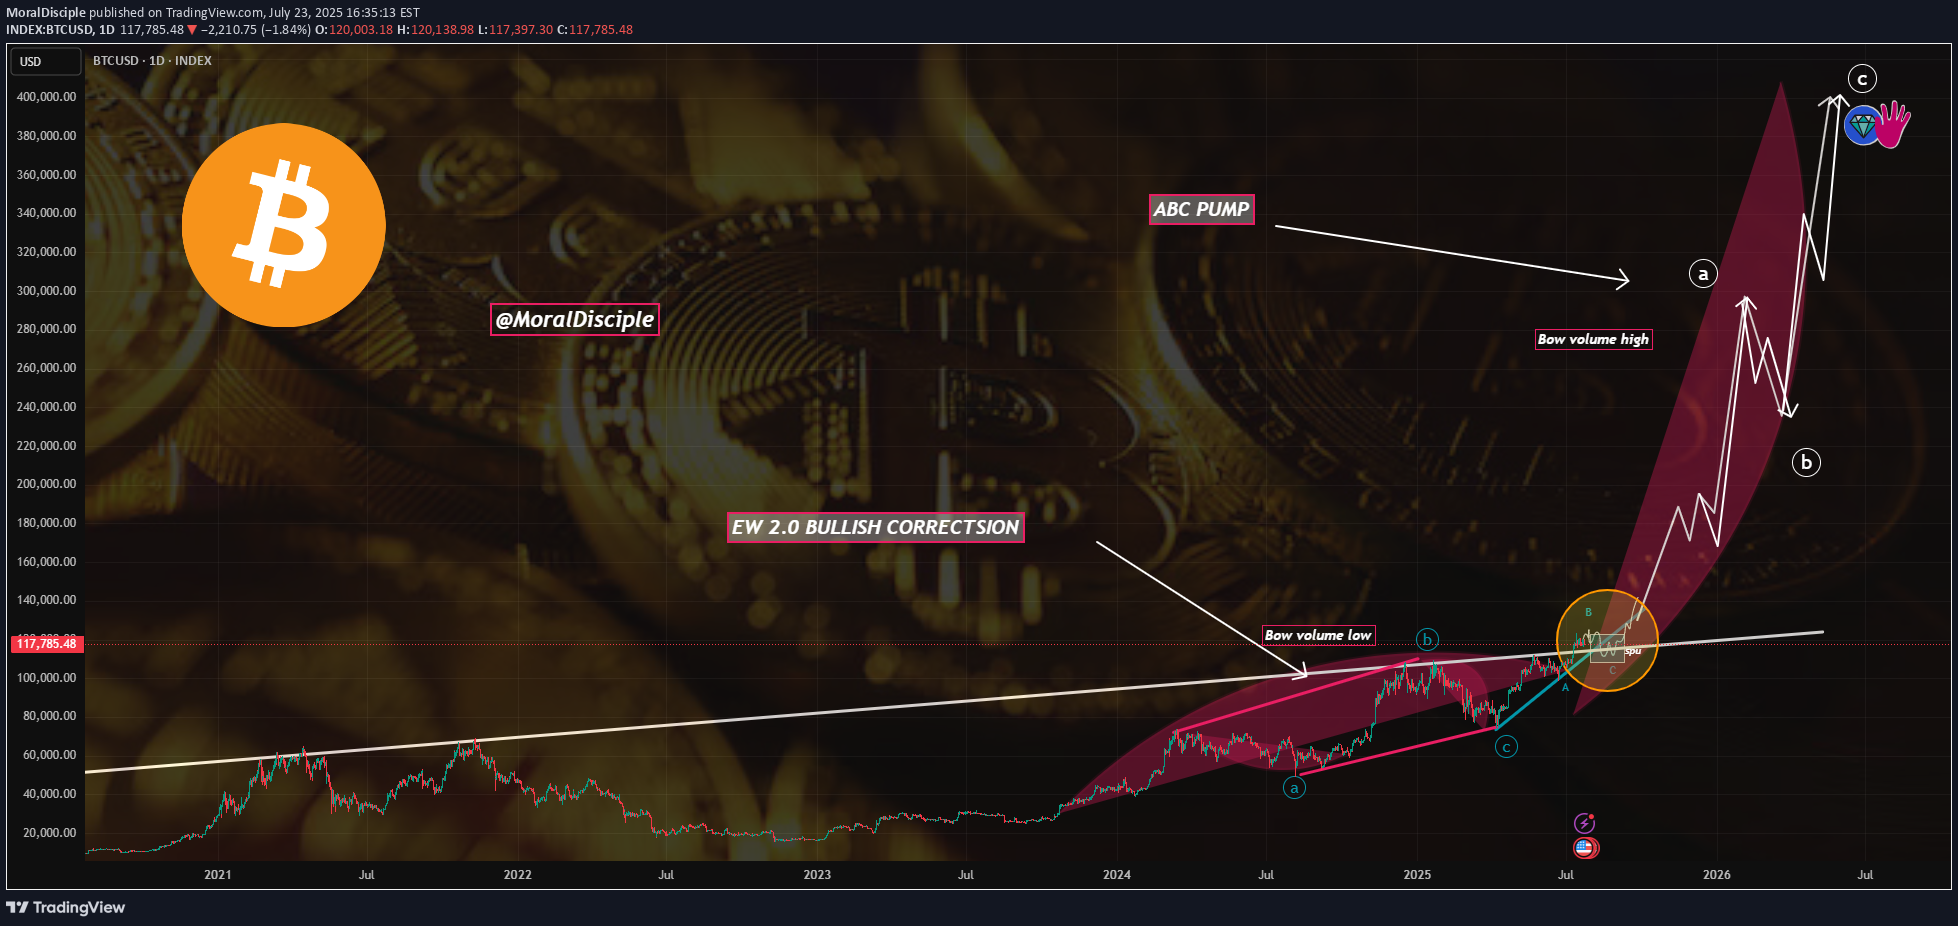
Generally More Upside. ABC

The smaller chart (currently added 1D) detects a clear loss of volume and when I look at the blue area, it smells more like potential truth. Because there is no adequate correction + today's declines are not the minimum fib, but everything has reached at least that minimum in today's bull market. 1d: The big abc can be potentially correct, because the previous correction can be determined by the bow low. In very many cases, a b-wave bow low and a c-wave bow high are seen (it is especially good if the b point is a new high, which gives potential for a bullish correction (ew 2.0)). + Bitcoin sees more upside potential when comparing the two previous volumes on large charts (currently 2w). 2w: Adding the different results together, there is a decline (finding support) and then an increase (abc wave up). There are some trend based and classic fib levels on the chart where btc can stop. The liquidation movement marked with the yellow line, between which it can oscillate. -30% of the higher peak remains the assumption today and it seems to be a March(April?) thing. Only the result of technical analysis. **Can be wrong or change step by step in details over time**. Do your own analysis and it should be number 1 for you and all other people's analysis should be for entertainment purposes. Understand? only you can save your own shitty life in this crypto world. I don't trust anyone here or anywhere else, it's great if I can trust myself. Good luck to you and I accept if you see something different.I can't comment on anything smart. it didn't even need a support point to fall, the situation is just worse than I expected. but what had to happen happened, the most basic thing in this analysis. bitcoin is ready when there are also altcoins and altcoins are still not ok, presumably. the most terrible is solana, in which the fall seems like a big wave a and any green is b. but it only seems that way, the reality may be different. no one knows what will really happen and maybe the bitcoin analysis is only a partial truth. but let see step by step.The problem is that I can't apply the Solana assumption to all altcoins. I'm not sure about anything.shib history compupdate: today's bull market (smaller) / today's bull market (larger) historical comparison on the rsi indicator. everything is still basically the same and still needs a more decline to make it more of the same.there is still something missing from the movement and today btc only feel a purple res.If I look at the 1D chart, there might be some delay, but maybe it will be there very soon?🤔Where it should ideally be.you know what? WTF hahah, this 1w needle. I really didn't expect it but tomorrow a new weekly candle will open, it's as good as confirmed candel. The only thing I can think of right now is that there is no adequate correction. Or is this needle a correction??? so hard to believeI'll let the situation digest for x days and see what happens. Maybe there's a new sell enter opportunity? if btc hold more 90k+ area. I'm not confirming the correction today because there was a double bottom before and this rise could also be point b. + this idiotic needle + several altcoins show that the cherry on the cake is missingdouble bottoms give a chance for better greens on the usdt.d chartONE scenario IF btc rises above the pink line and looks for a better resistance to get red. can btc make more green? I don't know but we can hopeanother scenario with a larger delay
MoralDisciple
SHIB ABC

Market cap today: around 10 billion Shiba Inu (SHIB) is an Ethereum-based altcoin in the cryptocurrency world. It is a meme-inspired project based on the meme "Dogecoin", whose mascot is the Shiba Inu dog. SHIB has been launched as a decentralized cryptocurrency built on the Ethereum blockchain. I don't feel like sharing several similar real-time analyses by doing a separate analysis, but there are other popular coins with similar price patterns. Maybe I will share other real-time analyses in the comments, but I won't do separate analyses because it's absolutely pointless. Yes, the analysis is based on real-time, but I will also put the similarity of the x price pattern, which is on a historical basis, the waves may differ in reality, but today's similarity is significant. The area where the decline starts is area b: Maybe the red has already been made in March? and then the green arrow up? who the hell really knows. both green and red arrow are 50% movement, and it is absolutely not surprising if this is true because it is a crypto and increases the potential if it is a memecoin SHITCOIN THAT DESTROYS YOUR LIFE!!!!AAAAAAA haha and shib is a memecoin. There are an awful lot of needles today, it stinks more than it is good in today's specific position. BUT in a larger view it can be positive, showing that the price movement in billions is easy on this coin. I have seen a similar sea of needles before and it ended positively. I do not want to believe that shib is a coin that will die permanently, rather I believe in its potential but its green potential is more of a matter of time. Just my eyes and nose with several other analyses, reality can be different. if you see something different or are forced to see something different then I understand you. the base analysis is actually very simple and poor but I did not bother to make it too colorful today BUT maybe I will do it in the comments + INDICATORS. Good luck to youbtc can affect shib. in this shib area some green won't change anything. just more decline more in depth in new btc analysisLet's recall the historical comparison, which is missing only one thing and has a perfect similarity. btc support point for the decline was a wrong assumption and it managed it so so easily without it. In general, it is not a surprise, but it is a surprise that it reached 80k lower already in February. I rather assumed that this would be more of a March thing, but fuck already in the last days of February.make it more red! hypehypeIf the shib rises above 1733 then I will consider real-time analysis where it is accepted as point c. but historical comparison is also nice I am not trading bear today and I only hope to buy cheaper.1w rsi 30 area is not possible to confirm before March 10th. which means there is time before there is a buy enter opportunity, the goal is to get it in the 30 area. and let's hope the goal is not destroyed in the meantimeavax res greens before cherry on the cake?if true then presumably also on the shib coin some x dealy.these needles... it just stinksrsi is rising but price is weak and then the cherry on the cake. similar to the previous two I am willing to try if it is true march shitone is the same area i did the shib history comparison, which has too similar details. by accident i share avax coin in shib analysis but that's ok because the movement can be similarbitcoin scenario with a larger delay(rsi)rsi14 30 in zone????, 4DI really hope this is true and the worst thing that can happen is that I miss out on the buy opportunity. If it goes up to 0.00000109 before then it can only be a scam. Crypto will remain crypto or in other words a pyramid will remain a pyramid. It will fall when the hope is the greatest, fuck...classic:)I don't know how sensible it is to copy the previous RSI 30 area and whether the result will be similar or not, but at some point it will come out of there. and it seems that it is not extremely far away.0.0000109******shib bs + bs cooling new analysis needed. current analysis outdated********what happens if btc drops below 76.7k and looks for support at a lower x level? 1100 lower? let's see what happens. yes i currently expect bitcoin to drop to 76.7k and i don't want to be bullish on altcoins before then. some bs like thing was given and if there are drops then this could be the last one and expect 1700 higher. currently the shib analysis is broken, i expected bs like thing at another level. i will not comment on this analysis anymore
MoralDisciple
XLM Hope

XLM has made a clear correction, where wave A is bow low volume and wave c is bow high volume. The volume suggests that most of the correction has been made. Is the correction complete? It seems that it is not. It would be nice to see that February closes this month in the red on the monthly chart. + can hold 26c higher. What waves it makes in February, then you can imagine all sorts of things here. I added blue waves and they are illustrative and reality can differ. When I think about the quick analysis of the XLM coin in January, where I marked the bow volume in pink, I see the volume today that I wanted to see Whether this is a correction to a new strong volume or not, no one knows today. But you can hope for the best, believing that it will pump is also necessary, just reading this correction does not help as a whole. Rather it helps to minimize the risk so that if it fails you don't cry yourself to sleep in bed for a month hah. The hope is 1$ or x level 65c higher. In theory 2025 should be bullish. Several historical comparisons show rather unpleasant hints but who knows, these analyses are just historical comparisons. MD
MoralDisciple
Historical price pattern analysis

---------------------------------------------------------------------------------------------------------------------------------------------------------------------------------------------------------------------------------------------------------------------------------------------------------------------------------------------------------------------------------------------------------------------------------------------------------------------------------------- This historical price pattern analysis today is due to July 2024. I hypothesized that area 2 would make a similar move to area 1 but area two would be a larger version of area one (because I saw a significant similarity). Comparing the indicators to achieve similarity, area two is 4 times larger than area one. Since I privately save all kinds of porn and there is an insane amount of it, I forgot about this July analysis. I found it about a month ago. Paying attention to the details with indicators and on different timeframes, I see a significant similarity today. I will only share one timeframe comparison, but if I do at least three different ones, I only see a similarity. Will this similarity continue? Who knows. The same expected area is marked with a light blue line + I marked similar waves with colored boxes: What hypotheses can we make with this analysis? *btc rises to 110k before falling to 86k. *btc stays above 86k in february, also in march *main disaster in summer, which is already visible. 72999-49999k. and many other hints based on hypothesis that I will not write. ONLY PRELIMINARY ASSUMPTION THAT CAN CHANGE. It is visible that bitcoin is losing volume and these waves in my eyes do not qualify as a correction. why? because bitcoin has made all corrections in today's bull market minimum fib or more but today's one is not, minimum fib is 86k and the next level is 73k + several other hints. if I cannot determine a correction today then all waves in the 100k area are waves of volume loss, which will end badly. yes i know what STFM and RBC indicators show that 2025 bullish hypehypehyyyyyype and btc 200k minimum this year fuck yeah, maybe even 400k w sigma!!!!!!!!!!!!!!!!!!!!!!!!!!!!. This is all interesting but unfortunately when doing usdt.d, others, btc and separate altcoin analyses, then everything doesn't look so strawberry. but who knows what will really happen? no one. ***this price pattern analysis may be destroyed** but i want to see it. not only the cancellation of this specific analysis but also usdt.d, OTHERS and other crap(for example us500 and several stocks). Update to July 2024 analysisif I think that MEGA minimum fib is 86k and I can't determine today's correction in the price pattern, then maybe this rsi will work until the end? Actually I'm already wondering how everything can be so similar, like the system. when I look at this rsi chart I get the feeling that the disaster is already in March/april? who the hell knows. rsi on different time frames is so different that if I want I can also set some other theory...**nothing is set in stone** but look and wonder at this comparison of smaller and larger. actually wow 1d chartdon't forget usdt.d, others, total etc other porns(they all show different volume on the chart and also waves), if you believe only one theory, you have to be able to generate it for all of them at exactly the same time. Can you do it? I can't. If you can then share your shit with me the only thing I can say is that it's not easy, if something seems too easy to understand then it's wrong and without technical analysis is just wrong. +with this update this analysis was closed because it was my last update to it. if I want to update then a new analysis, based on July 2024 don't forget that crypto is the worst shithole that exists. it's legal and maybe a better opportunity than selling drugs or stealing somewhere, but the reality is that it doesn't matter which one you choose you need brains anyway if you want to survive until the end in freedom. good luck to you my friends and m*******ckersscenario with a larger delayWhich means that today's situation is 4 times bigger than the previous one. 12h vs 2d is specific rsi comp
MoralDisciple
Chainlink history comparison. Green potential 40$?

---------------------------------------------------------------------------------------------------------------------------------------------------------------------------------------------------------------------------------------------------------------------------------------------------------------------------------------------------------------------------------------------------------------------------------------------------------------------------------------- On the 1M chart, the candle closes are very similar. chart: link closes February green? Same color equals same month open Charts: Bitcoin did not achieve anything special anymore and with each new minimum height it fell back. Remember that this is PURE copying of history. copying does not always give what we want. This is just interesting. I am following the situation and cannot rule out sharing additional information in the comments. for example, a comparison of indicators also. MDI'm not surprised at all, because most analyses identified a bear + bitcoin still doesn't seem ready, hmm. the link showed interesting similarities in history, but there's nothing to be done with this historical comparison, because the recent decline changed it. unpleasant bear analyses: some show that it's ready, some are missing something, but damn this bitcoin. bitcoin is the only one not doing it? suspicious.it's wise to wait and see what bitcoin does and whether it will soon be below 89k or not. it would be ideal if it did. I'll feel better then haha
MoralDisciple
History comparison

What next? I'll share here a little material from a recent price pattern comparison + some indicators that help determine the waves. It is possible to make many different theories at one point in time and even more so compare the current situation in different areas in history. I took two areas where I can identify wave number 1(these two are in today's bull market), which I was able to accept as today's number 1. I count the peaks up to six, where six is today. Number 2 shows the loss of volume, where wave 3 confirms it. Anything can happen, this comparison could be complete nonsense or something that reveals the truth. In theory, there should be higher peaks in 2025 and if the cooling is true, it should rise back. With some other theories, I can expect more upside, but I'm watching the situation closely today. In the end, you decide whether it has value or not. If this is wrong, it won't take long to see it or its truth.All corrections have reached a minimum red fib level, which creates something better than a temporary green. 89k is not even a minimum fib, think about it. It is clear that at least -20% or -30% are corrections, not smaller drops. and how much was today's 89k minus percent? you already know and if you don't know then get out of here. There is no guarantee that the minimum fib will come soon, but there must be some tactic to create an idea for yourself. Just one thing that supports this is historical comparison. Did I say that btc will drop to a minimum of 86k or even 73k? No, I just suspect it. But unfortunately or fortunately, it is not ideal with all analyses. With new private analyses, I can perfectly accept it with bnb and eth coins and a few others. And then there are some other analyses that do not accept it. + you follow us500? Hardly, if you are, for example, a meme coin freak. its last waves show the loss of volume (it can rise but are the last or it seems so) and I also see it in bubble-inflated stocks, for example nvidia. Is this the beginning of the 2025 disaster or a blessing from God? no one really knows. BTC Market Cycle indicates that 2025 will be a strong volume. Remember that the market cycle is a copying of history, which does not always bring what we want. stfm and rbc indicate a situation where btc will rise by about 200-400k in 2025 and the main volume on bitcoin is still coming, Very interesting. Summary: pure porn in the marketAnother historical comparison. there are interesting similarities!!, but the reality can be differentx)place of thought:)
Disclaimer
Any content and materials included in Sahmeto's website and official communication channels are a compilation of personal opinions and analyses and are not binding. They do not constitute any recommendation for buying, selling, entering or exiting the stock market and cryptocurrency market. Also, all news and analyses included in the website and channels are merely republished information from official and unofficial domestic and foreign sources, and it is obvious that users of the said content are responsible for following up and ensuring the authenticity and accuracy of the materials. Therefore, while disclaiming responsibility, it is declared that the responsibility for any decision-making, action, and potential profit and loss in the capital market and cryptocurrency market lies with the trader.