
XMR
مونرو
| تریدر | نوع سیگنال | حد سود/ضرر | زمان انتشار | مشاهده پیام |
|---|---|---|---|---|
فروش | حد سود: تعیین نشده حد ضرر: تعیین نشده | ۱۴۰۴/۱۰/۱۱ | ||
خرید | حد سود: تعیین نشده حد ضرر: تعیین نشده | ۱۴۰۴/۸/۲۴ | ||
خرید | حد سود: تعیین نشده حد ضرر: تعیین نشده | ۱۴۰۴/۸/۲۴ |


نمودار قیمت مونرو
سود ۳ ماهه :
خلاصه سیگنالهای مونرو
سیگنالهای مونرو
فیلتر
مرتب سازی پیام براساس
نوع پیام
نوع تریدر
فیلتر زمان
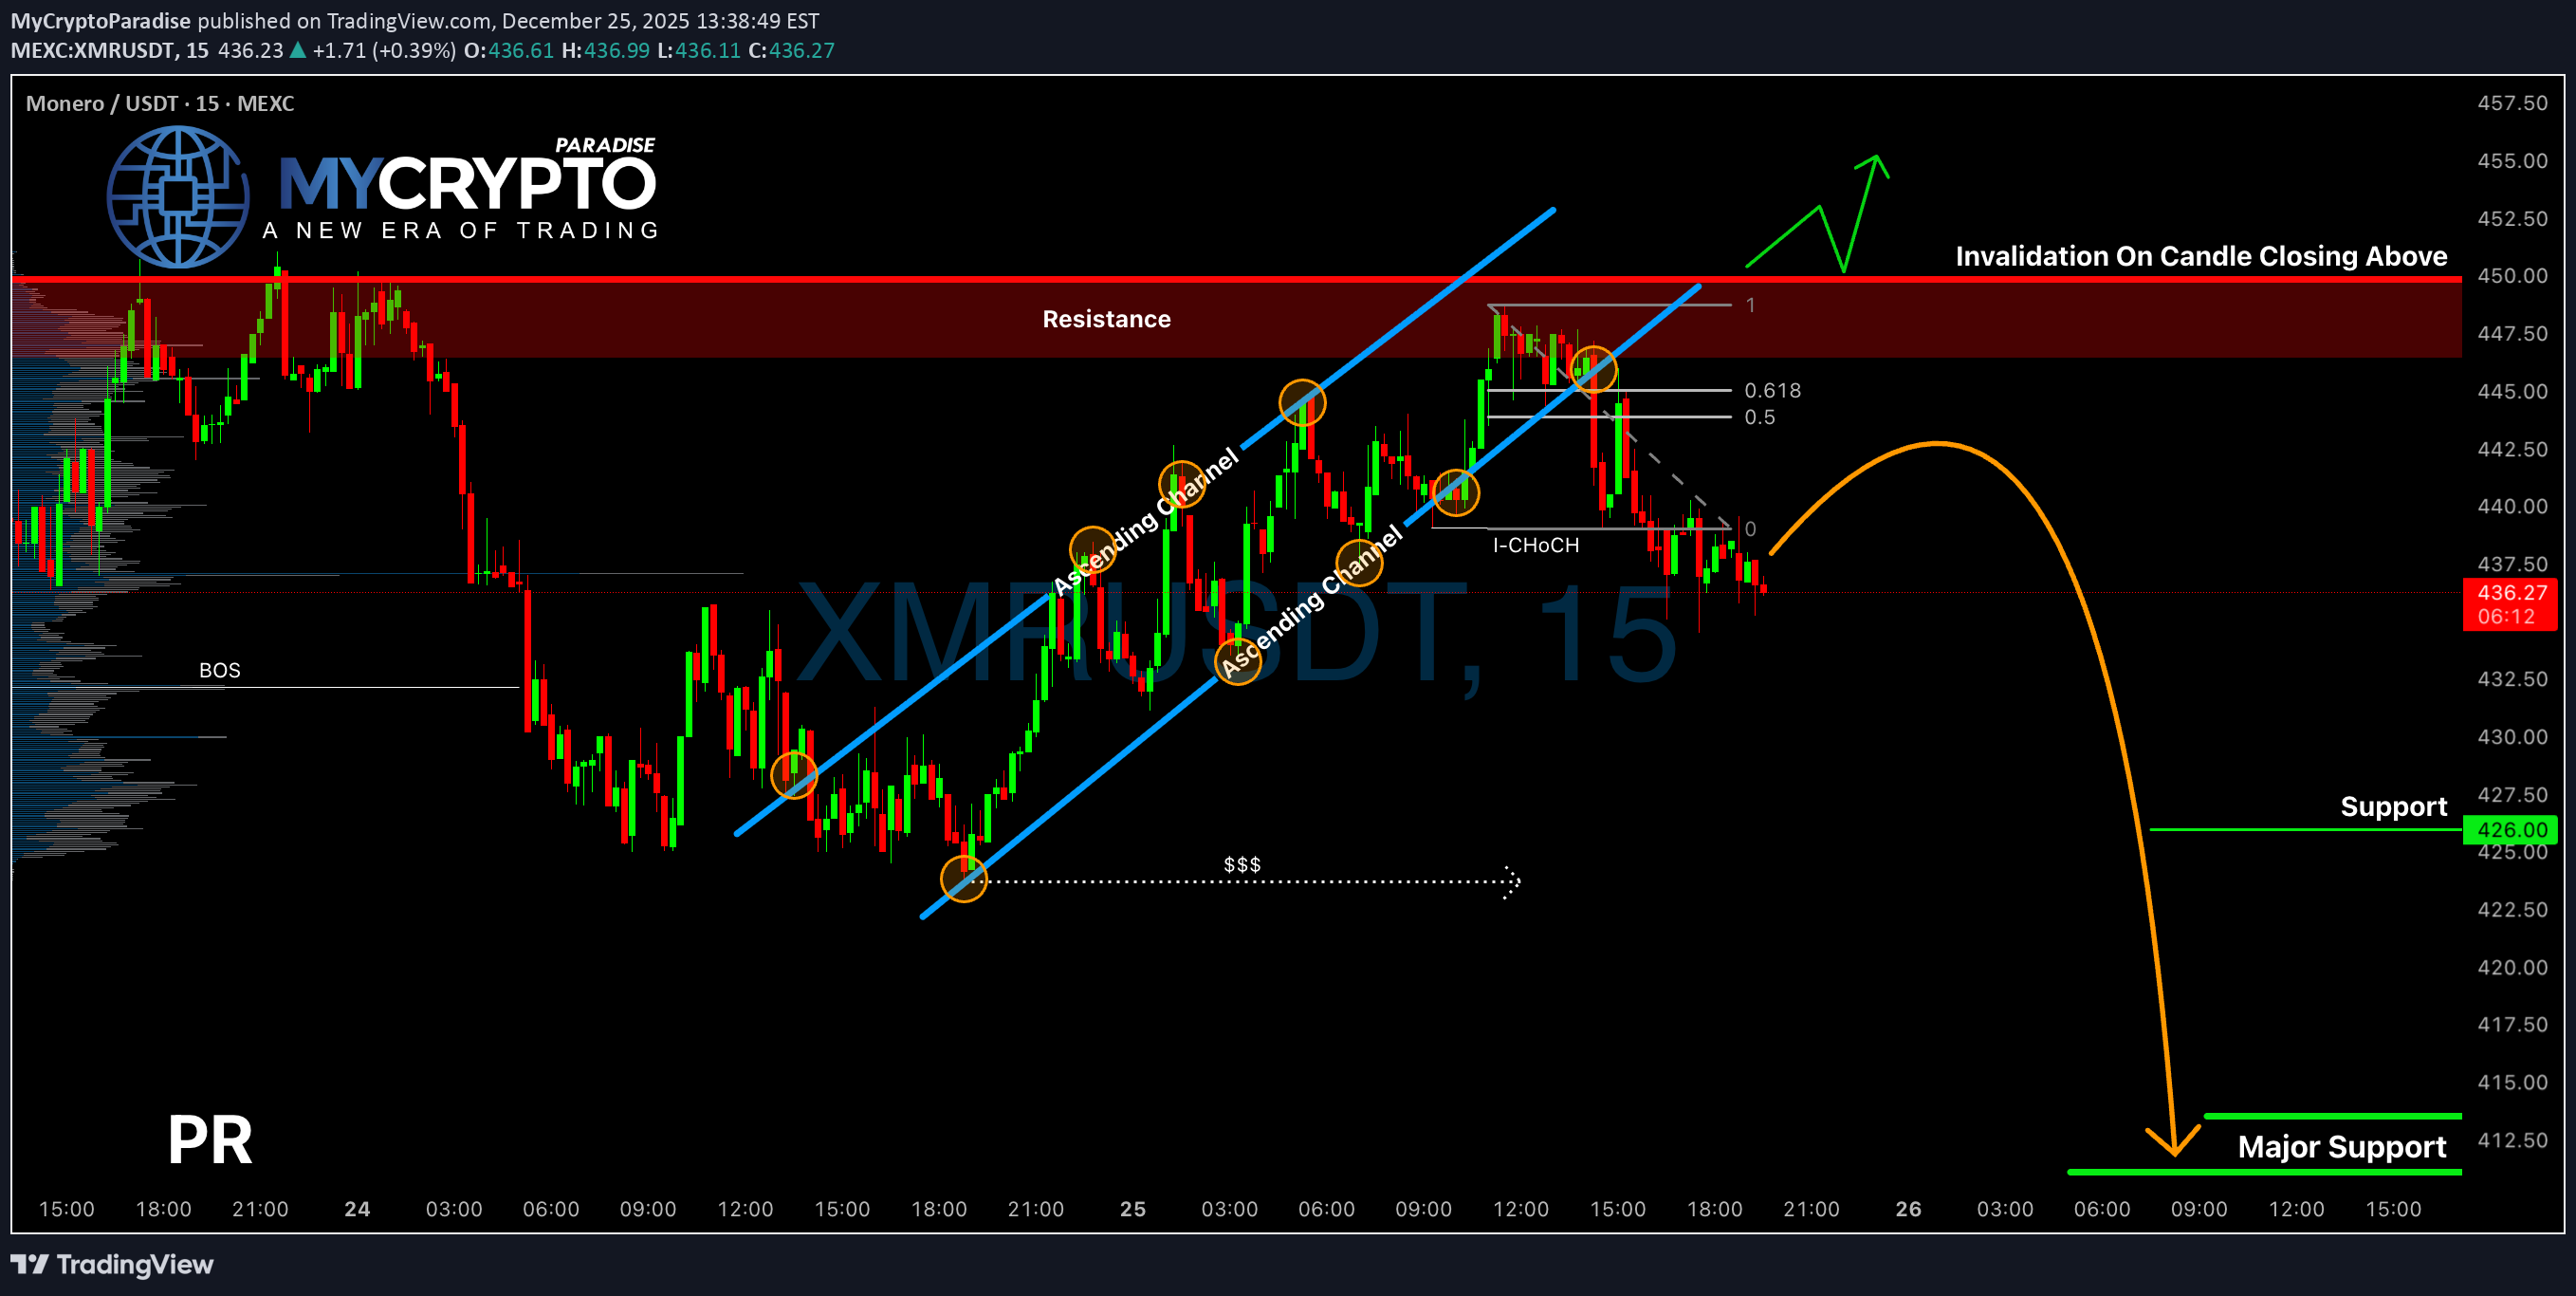
شانس بزرگ مونرو برای صعود: آیا قیمت به مسیر بازگشت برمیگردد؟
شانس عالی برای Monero برای بالا رفتن پس از سقوط، من فکر نمی کنم که قیمت راه دیگری پیش برود

Monero . Bullish Structure Above Trendline
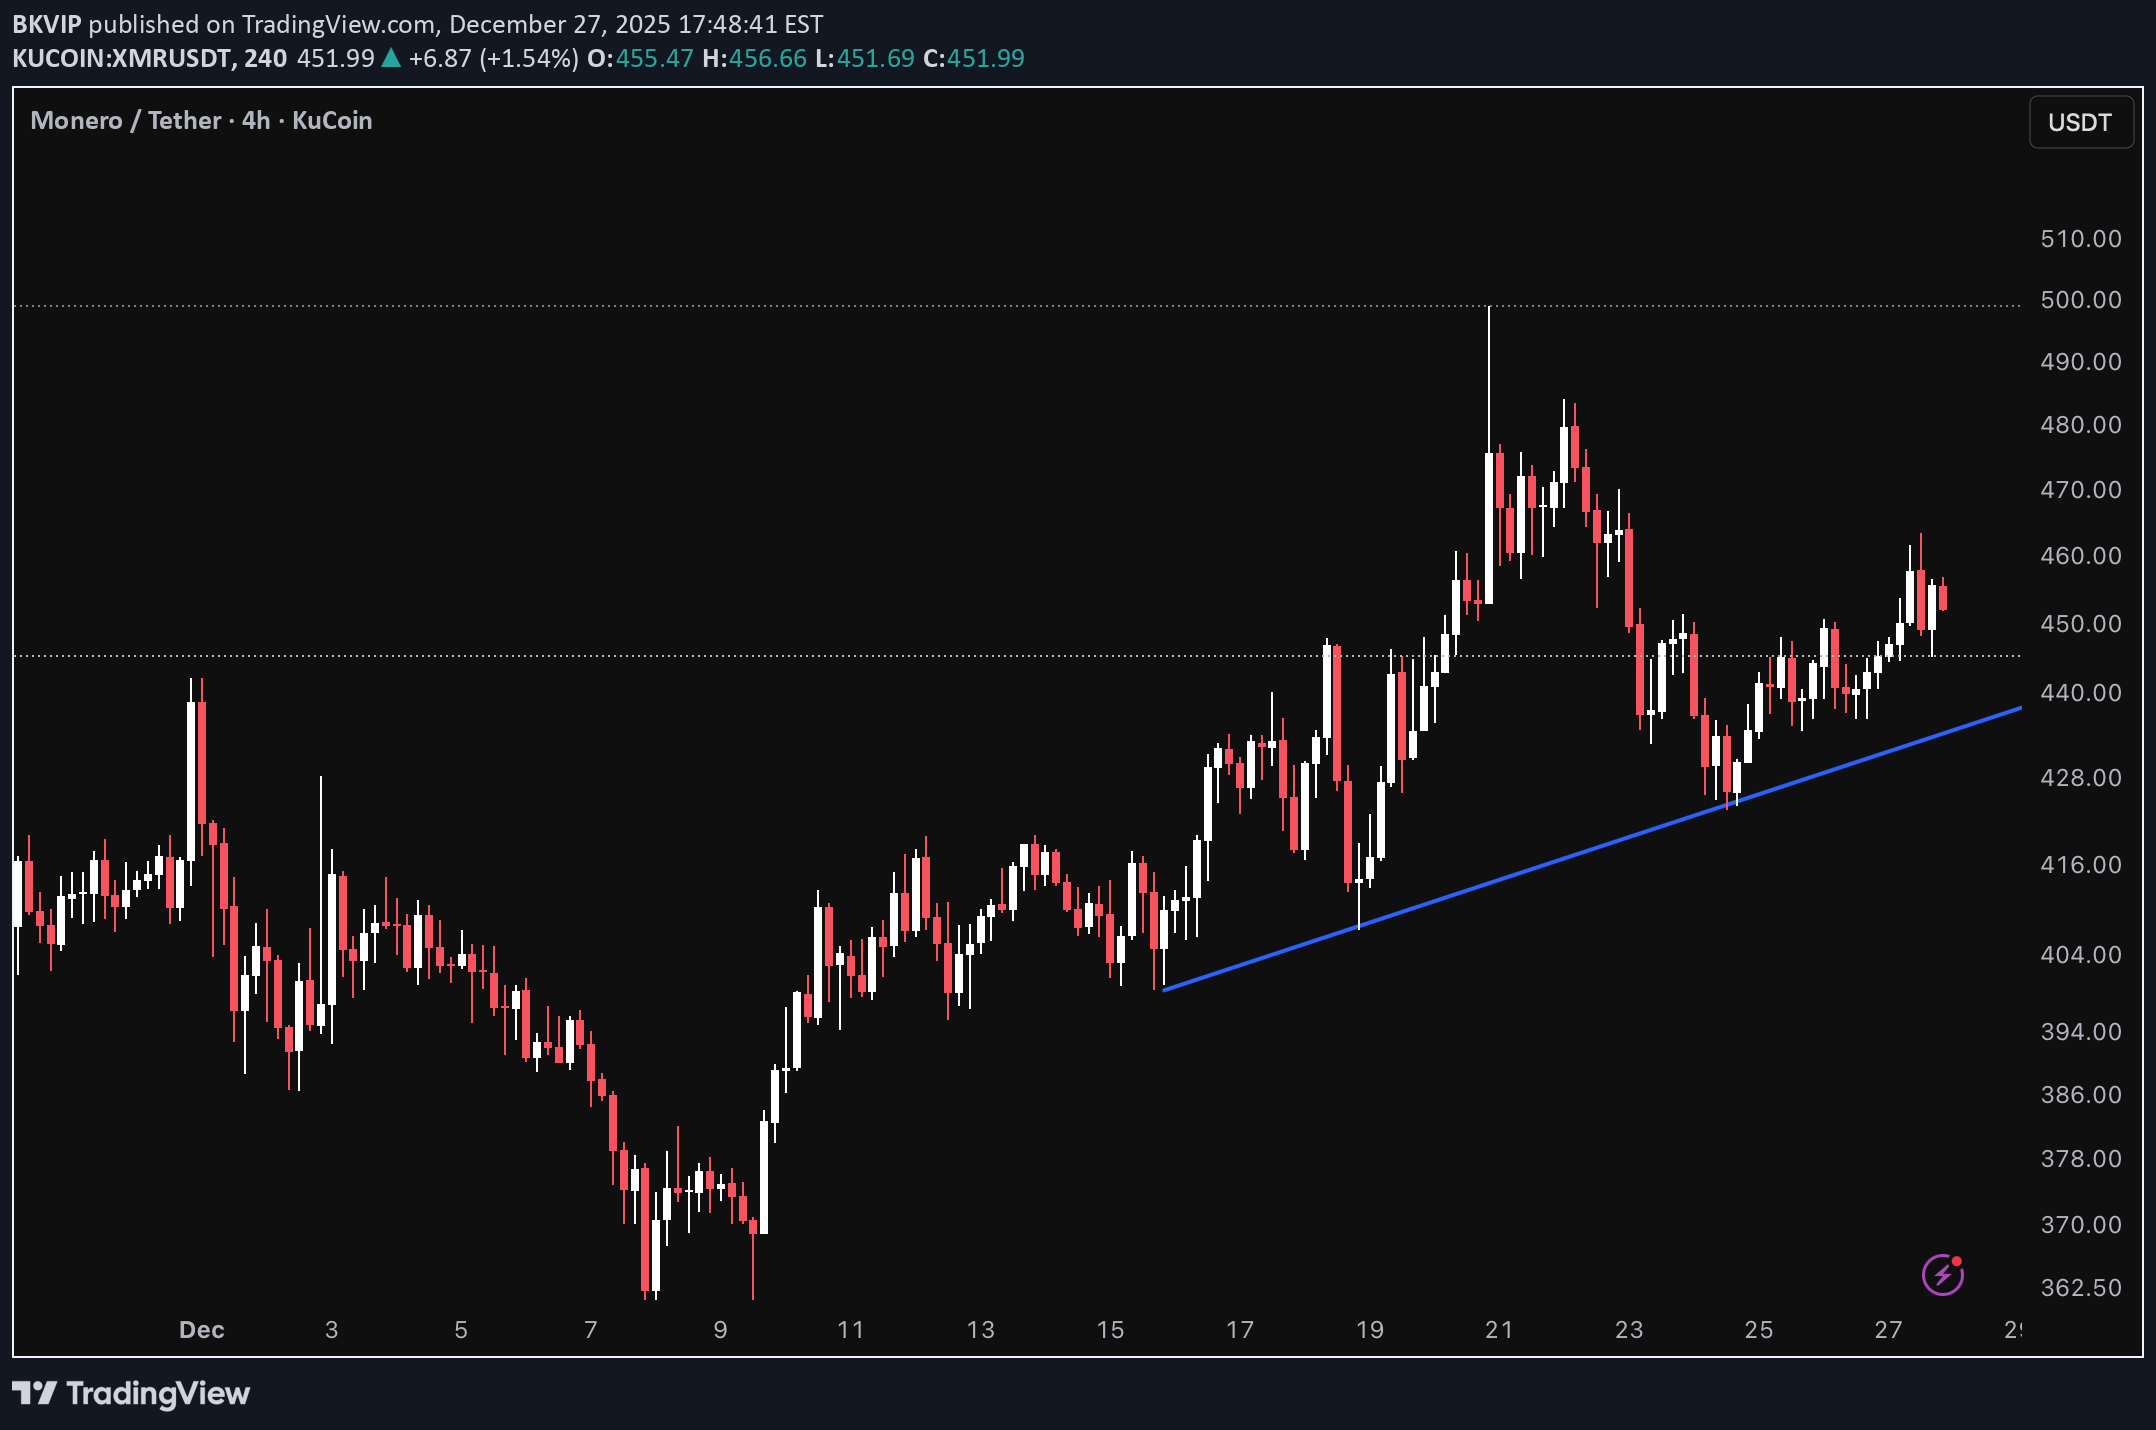
Monero همچنان به یک خط روند صعودی به خوبی تعریف شده در نمودار 4H احترام می گذارد. پس از افزایش ناگهانی move، قیمت به مرحله تثبیت کنترل شده منتقل می شود، پایین ترین سطح را چاپ می کند و بالاتر از حمایت ساختاری نگه می دارد. این رفتار به جای خستگی نشان دهنده قدرت است. تا زمانی که خط روند دست نخورده باقی بماند، این احتمال به نفع ادامه است و هر عقبنشینی بهعنوان آزمونهای مجدد ساختاری بهجای شکست روند تلقی میشود. تکانه خنک کننده است، نه معکوس.

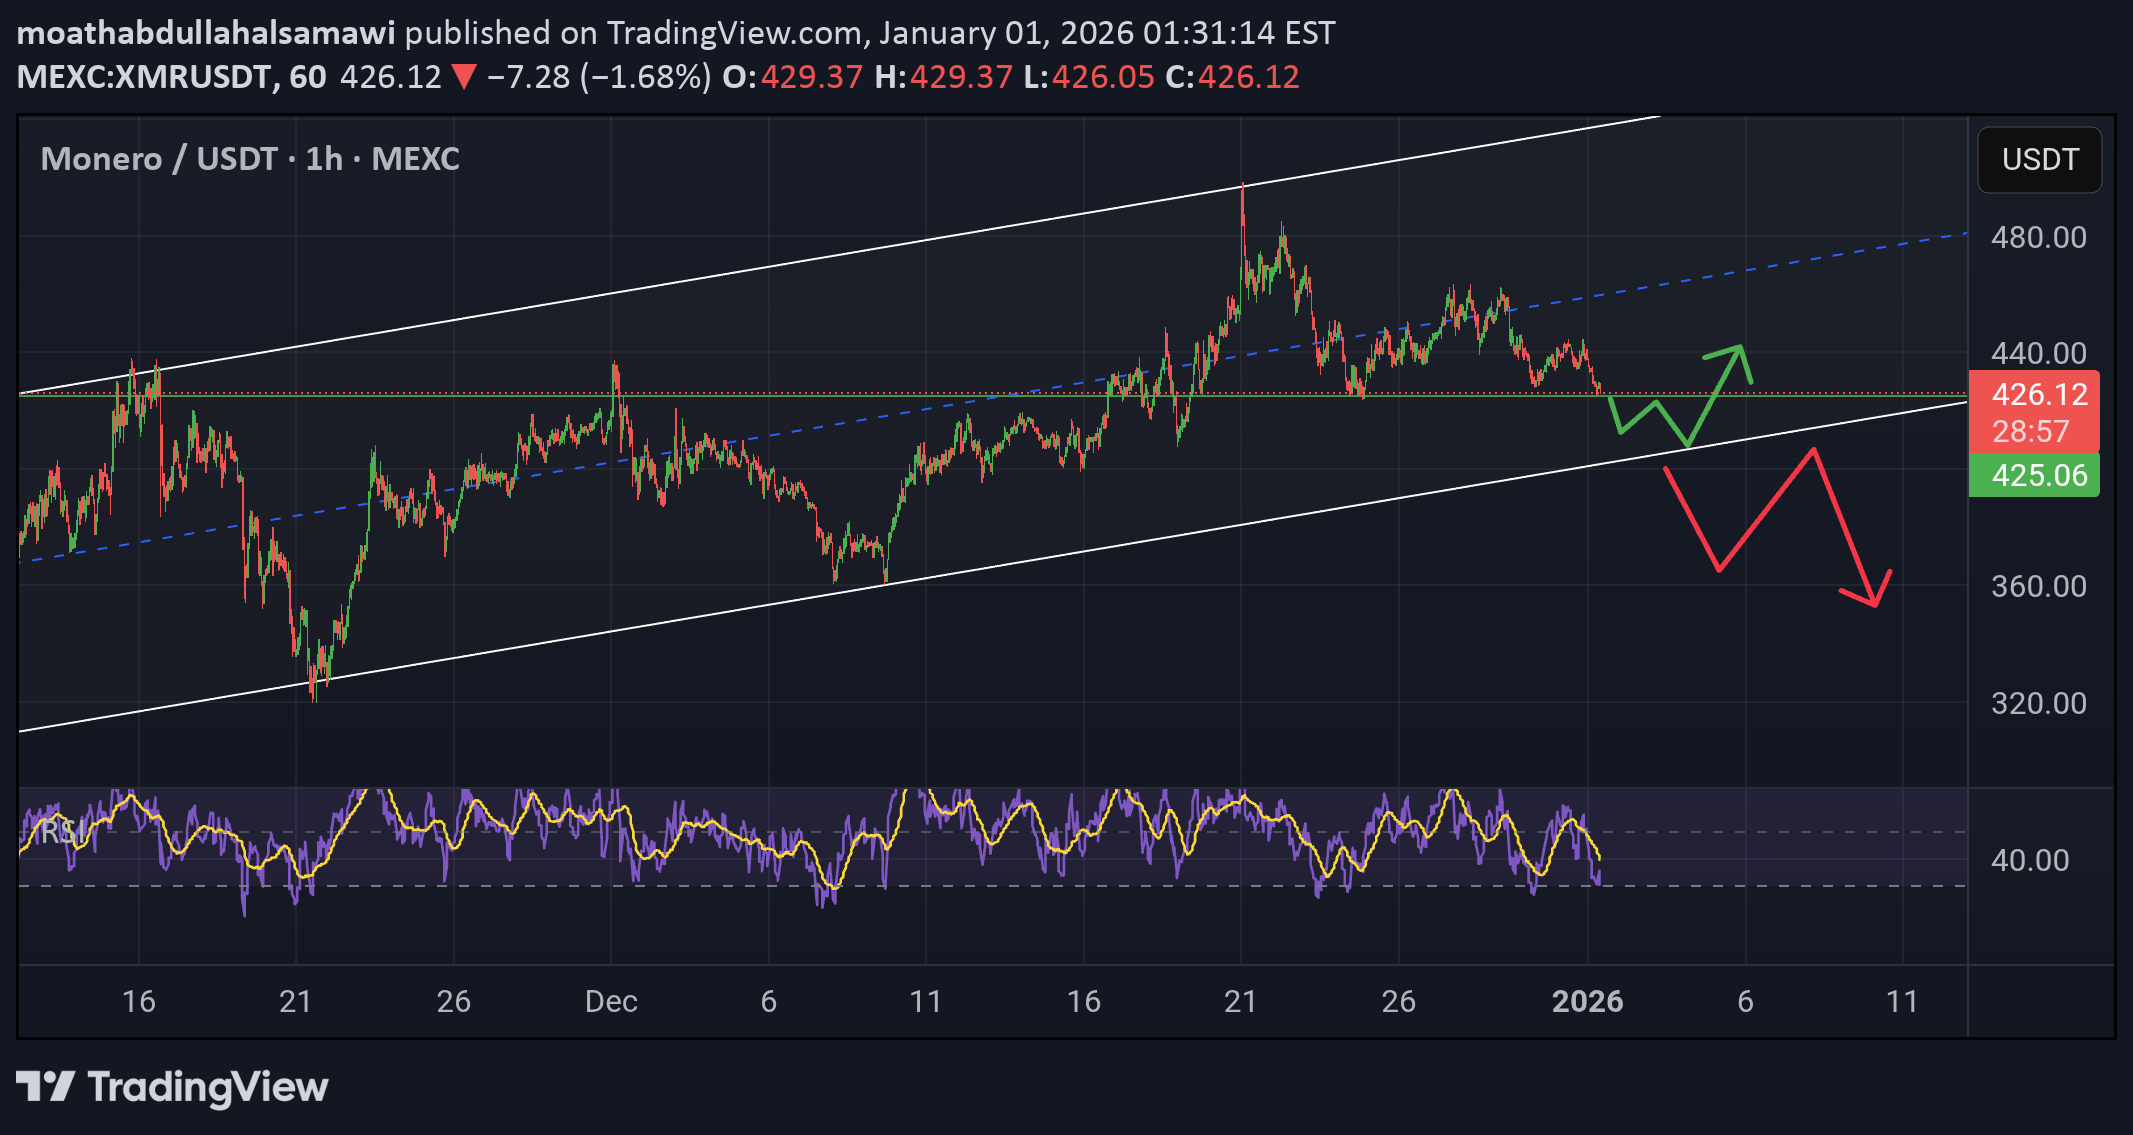
XMR keeps failing at 450 resistance, is a major breakdown coming
Yello Paradisers— XMRUSDT چند بار می تواند به همان دیوار برخورد کند قبل از اینکه برای همیشه فرو بریزد؟ رد شدن از ناحیه 448 تا 450 به نظر چیزی فراتر از نویز می رسد. 💎XMRUSDT برای مدتی به یک کانال صعودی احترام گذاشت، اما این ساختار اکنون به وضوح شکسته شده است. خرابی اخیر همراه با یک CHoCH داخلی نشان دهنده تغییر در حرکت کوتاه مدت است. رد تکانشی خریداران را خنک کرده است و ادغام فعلی درست در زیر کانال شکسته نشان می دهد که فروشندگان کنترل را به دست می آورند در حالی که خریداران برای حفظ موقعیت تلاش می کنند. 💎بعد از شکست، قیمت تلاش اصلاحی انجام داد اما به سرعت دوباره در محدوده 0.5 تا 0.618 فیبوناچی اصلاحی رد شد. این منطقه اکنون به یک منطقه عرضه تبدیل شده است و همچنان به سرکوب هرگونه تلاش صعودی ادامه می دهد. تا زمانی که قیمت در آن ساختار بدون جابجایی صعودی قوی باقی بماند، سوگیری با فشار احتمالی به سمت مناطق نقدینگی پایینتر و سطوح حمایتی کلیدی نزولی باقی میماند. 💎این دیدگاه تنها در صورتی تغییر می کند که قیمت یک شمع قوی بالای مقاومت 450 ببندد. این امر می تواند دامنه قبلی را به بالاترین حد خود بازگرداند، تغییر ساختار نزولی را لغو کند و قدرت صعودی مجدد را با پتانسیل هدف قرار دادن نقدینگی بالاتر بالاتر از محدوده فعلی نشان دهد. 🎖در حال حاضر زمان حرکات احساسی نیست. آرام بمانید و متمرکز بمانید. ما فقط به تمیزترین و با احتمال زیادترین تنظیمات علاقه مندیم. اینگونه است که شما در طولانی مدت در این بازی win. MyCryptoParadise موفقیت را احساس کنید🌴
تحلیل موج الیوت مونرو (XMR): آیا کف قیمت حفظ میشود تا موج صعودی پنجم آغاز شود؟
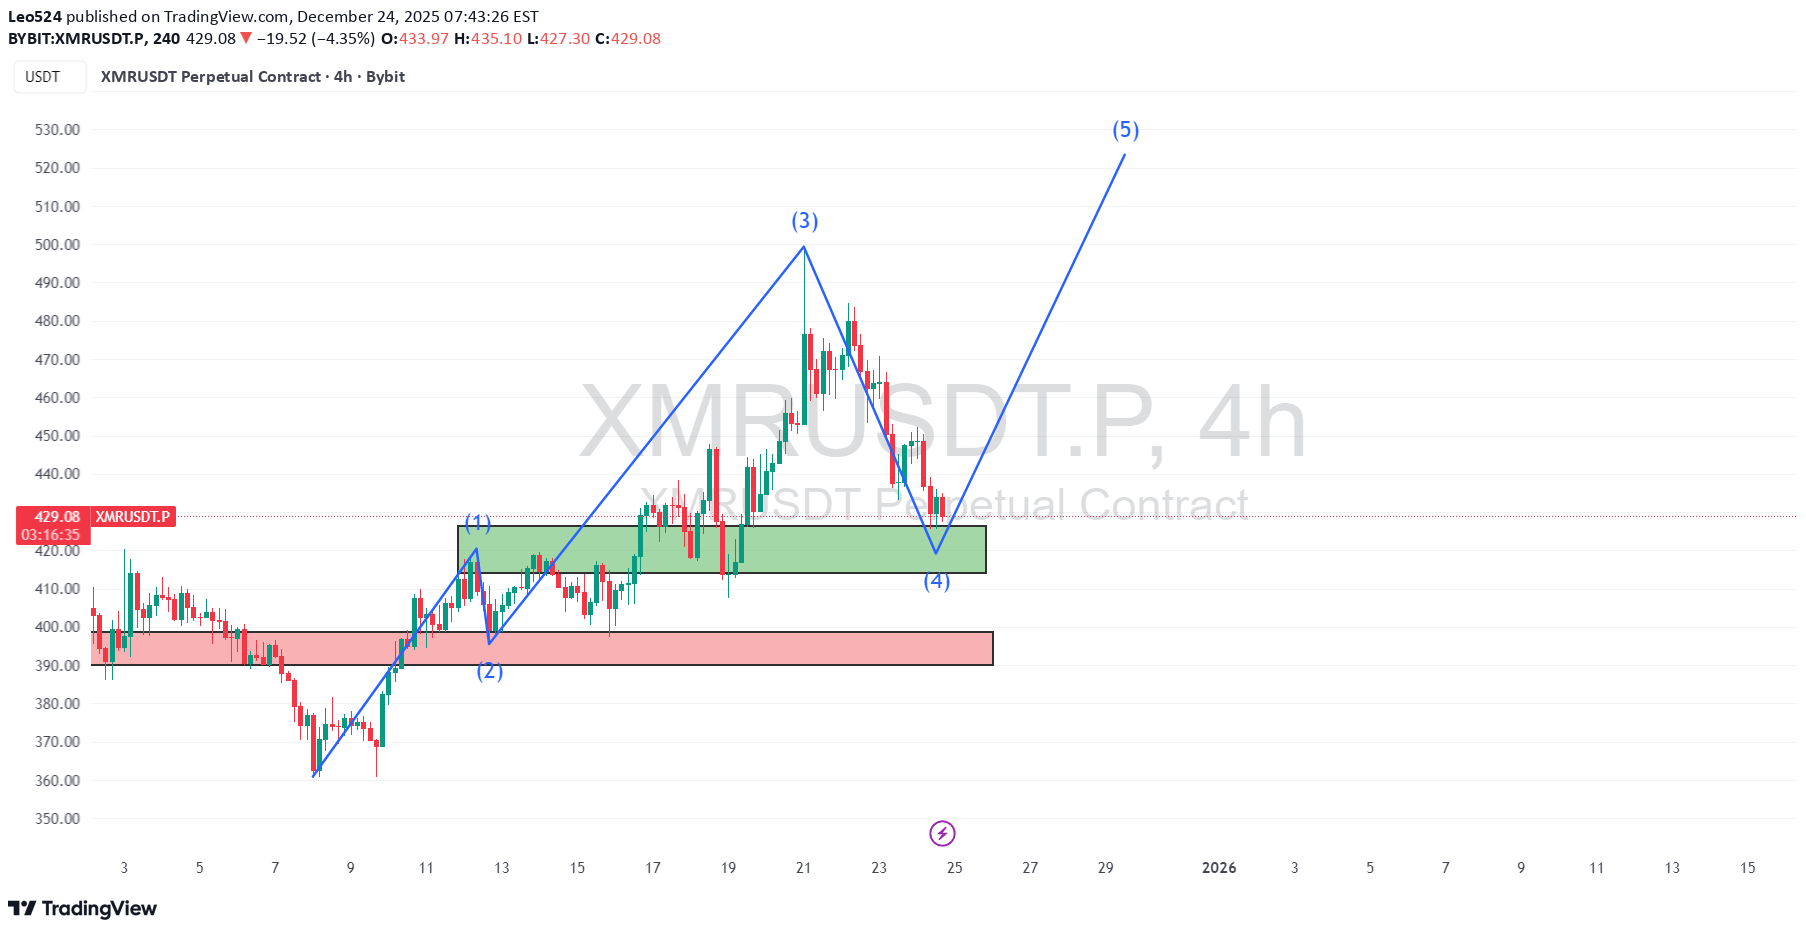
📌این نظریه موج الیوت در عمل است. من تماشا کرده ام XMR گام به گام، نه دنبال شمع، فقط صبورانه منتظر بمانید. 📌در حال حاضر قیمت موج 3 (قوی ترین موج) را تکمیل کرده و در داخل موج 4 حرکت می کند. موج 4 همیشه یک اصلاح است، نه یک معکوس. 📌برای اینکه موج الیوت معتبر بماند، موج 4 باید ناحیه پشتیبانی (منطقه سبز) را نگه دارد. این عقب نشینی سالم است و قبل از move بعدی لازم است. 📌اگر قیمت این حمایت را حفظ کند و قدرت را نشان دهد، موج 5 می تواند شروع شود که معمولا فشار نهایی را به سمت بالا می آورد. 📌نتیجه گیری ساده: پشتیبانی را نگه دارید ➝ اصلاح کامل شد ➝ موج 5 وارونه 🔥 همانطور که گفتم 424 را به 442 پمپ کرد 🔥

XMR USDT SHORT SIGNAL
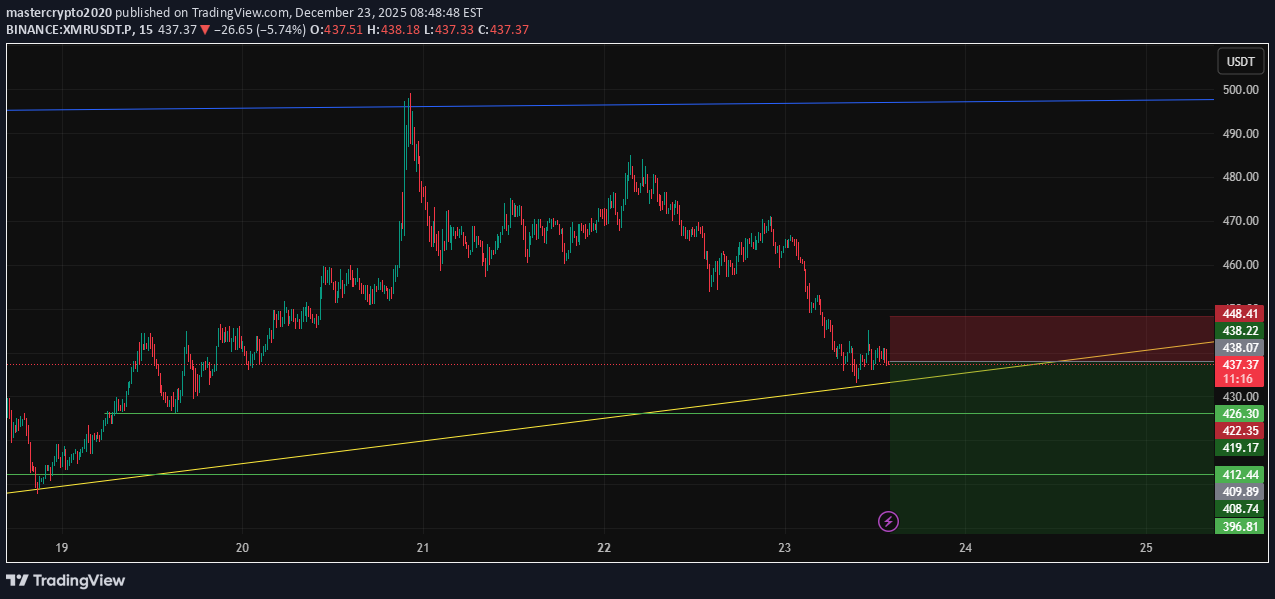
📢 سیگنال تجاری رسمی – XMR/USDT 📉 نوع موقعیت: کوتاه 💰 قیمت ورودی: 438.00 (سفارش محدود) 🎯 اهداف برداشت سود (خروج جزئی): • TP1: 426.30 • TP2: 412.44 • TP3: 396.81 • TP4: 382.95 • TP5: 367.00 • TP6: — 🛑 توقف ضرر: 448.50 📊 بازه زمانی: 15m ⚖️ نسبت ریسک/پاداش: مطلوب 💥 اهرم پیشنهادی: 5× – 10× 🧠 خلاصه تحلیل فنی XMR زیر یک منطقه مقاومت کلیدی نزدیک به 440 معامله می شود که نشان دهنده رد نزولی واضح در بازه زمانی 15 دقیقه است. ساختار بازار در حال تغییر نزولی با اوج های پایین تر است و فشار فروش در حال افزایش است. مناطق نزولی نقدینگی دقیقاً با سطوح TP ما همسو هستند: 426.30 → 412.44 → 396.81 → 382.95 → 367.00 تایید شده move زیر TP1 به طور قابل توجهی احتمال ادامه به سمت اهداف عمیق تر را افزایش می دهد. ⚙️ قوانین مدیریت تجارت ✔ در TP1 سود جزئی بگیرید ✔ Move SL به Break-Even هنگامی که TP1 زده شد ✔ دنباله SL با رسیدن قیمت به اهداف پایین تر ✔ بدون ورود مجدد در صورت ضربه SL ✔ ساختار نزولی را قبل از اجرا تایید کنید 📌 هشتگ های TradingView #XMRUSDT #XMR #CryptoSignal #ShortSetup #TradingView #FuturesTrading #تحلیل فنی

MONERO Bullish Continuation
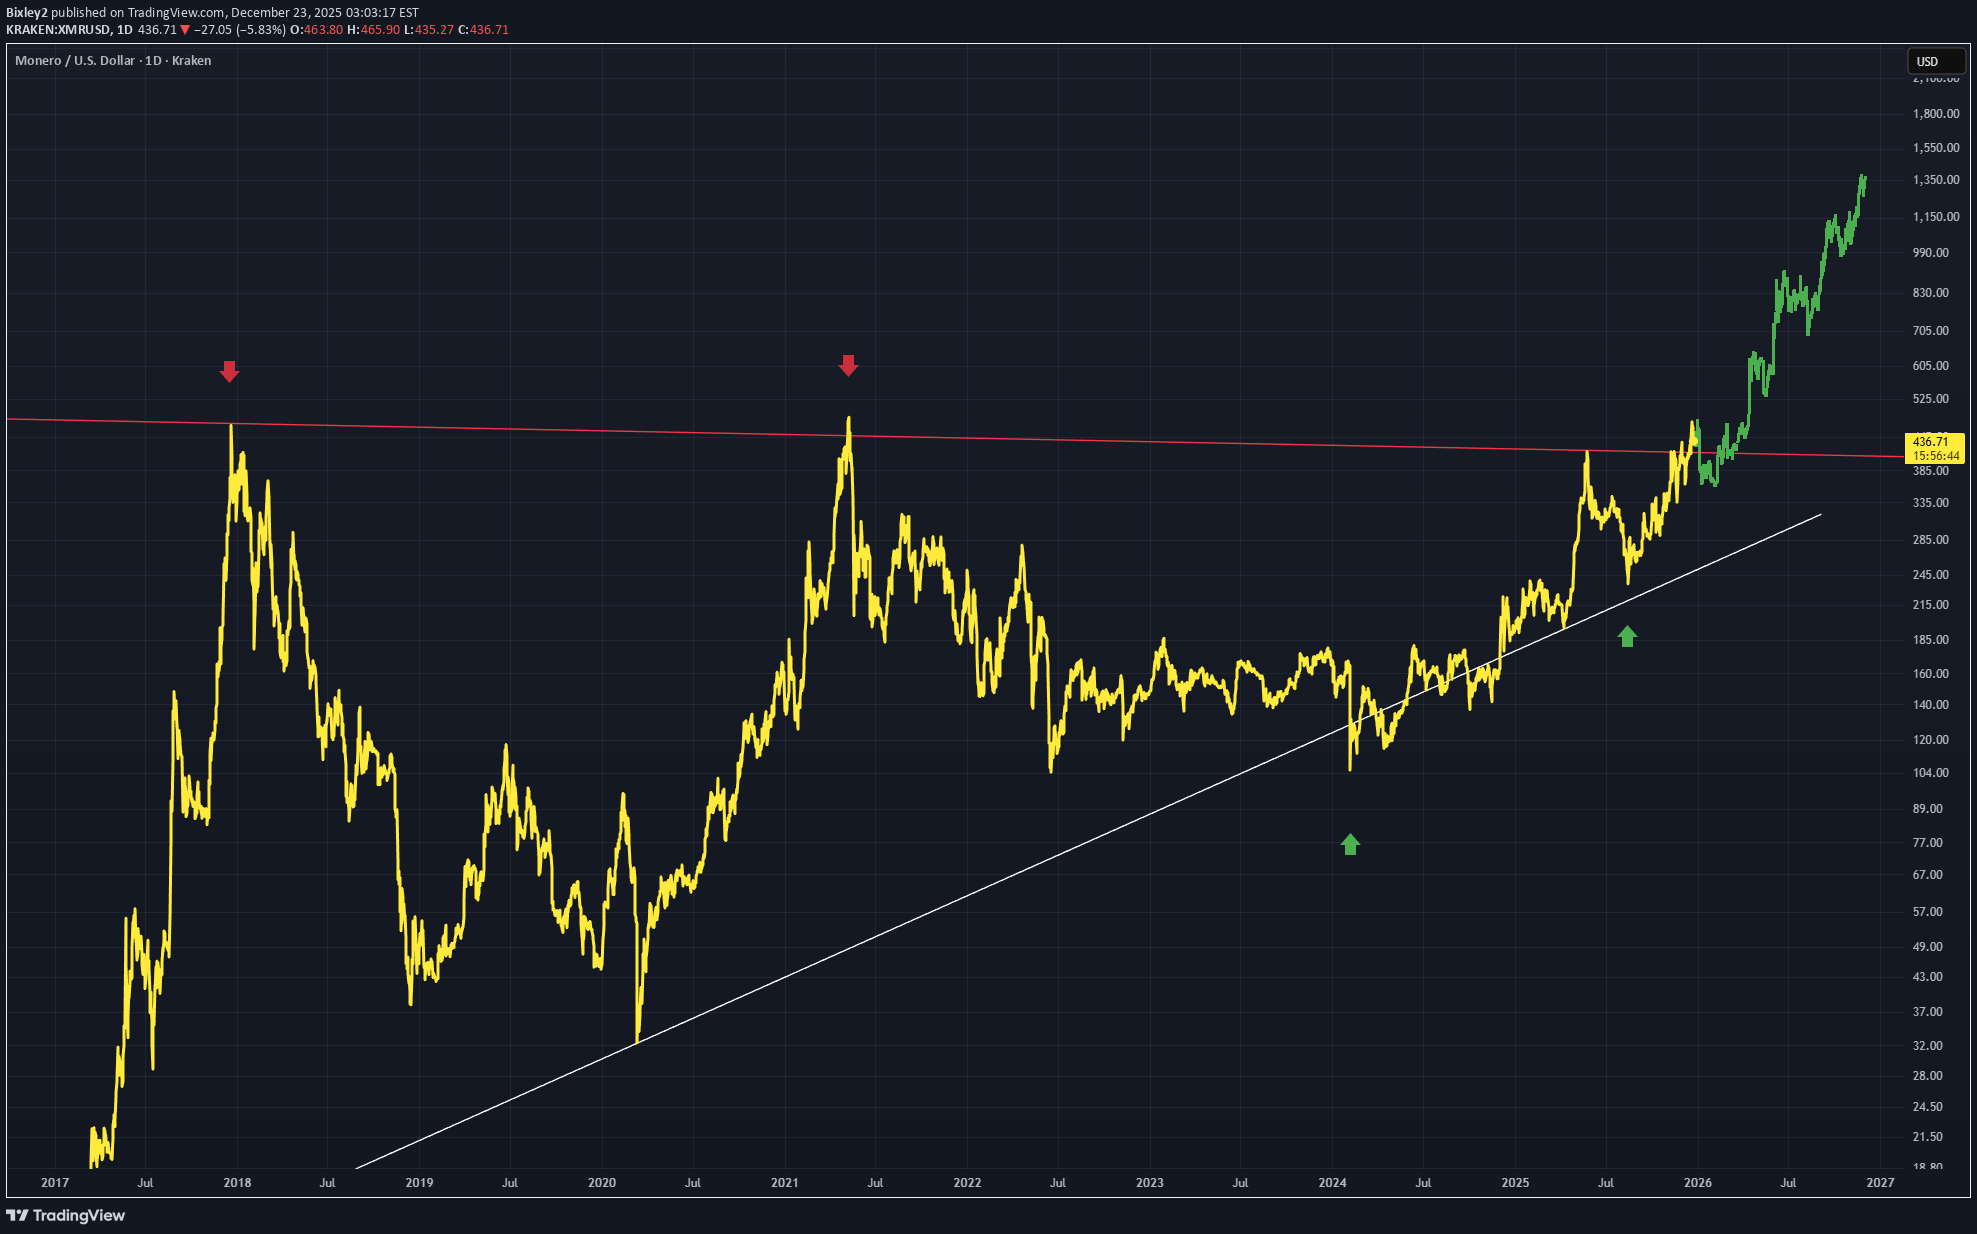
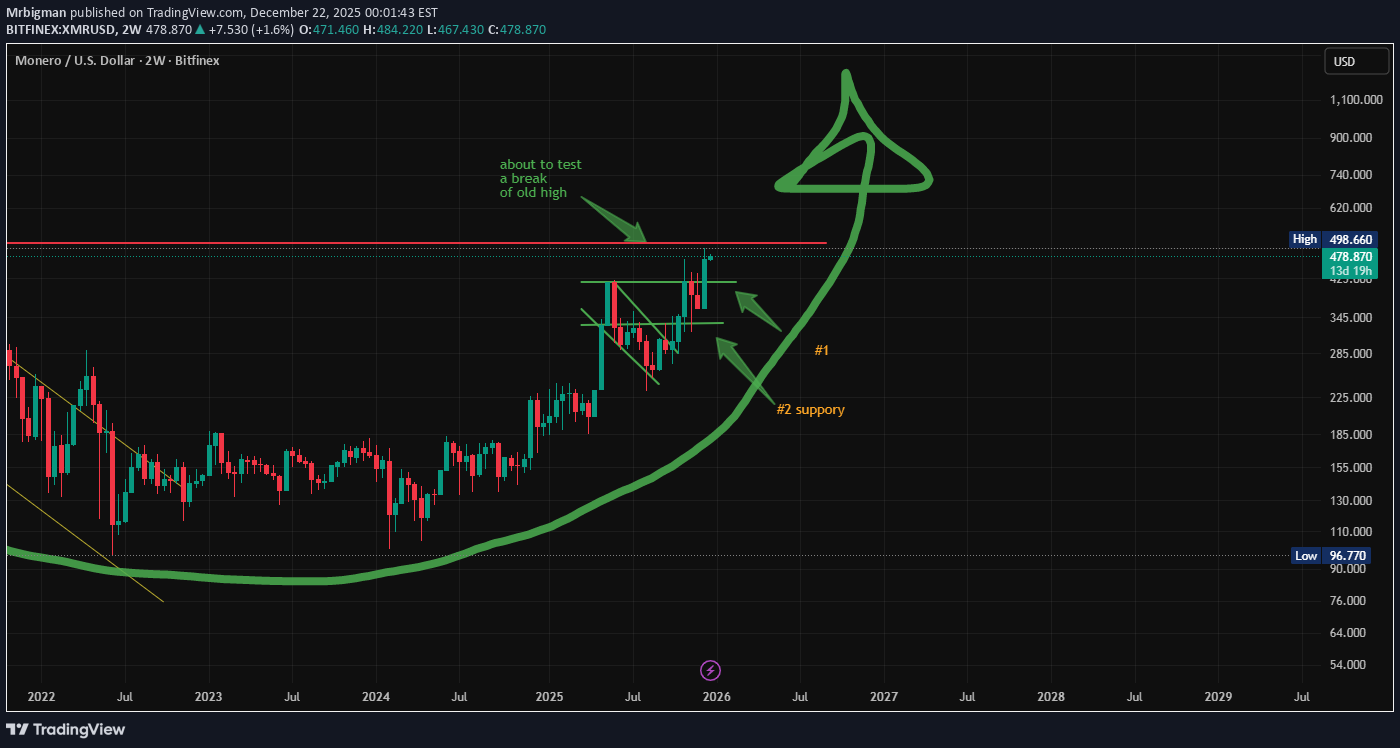
انتظار دارم رالی کوچک فعلی قیمت، طبق الگوی میلههای سبز، حتی بیشتر از این نیز ادامه پیدا کند. قیمت در آستانه شکست الگوی مثلث بزرگی است، که من آن را شبیه به الگوی طلا میبینم. تحلیل روزانه صعودی است.
XMRUSD - Privacy Rally Explodes +143% YTD
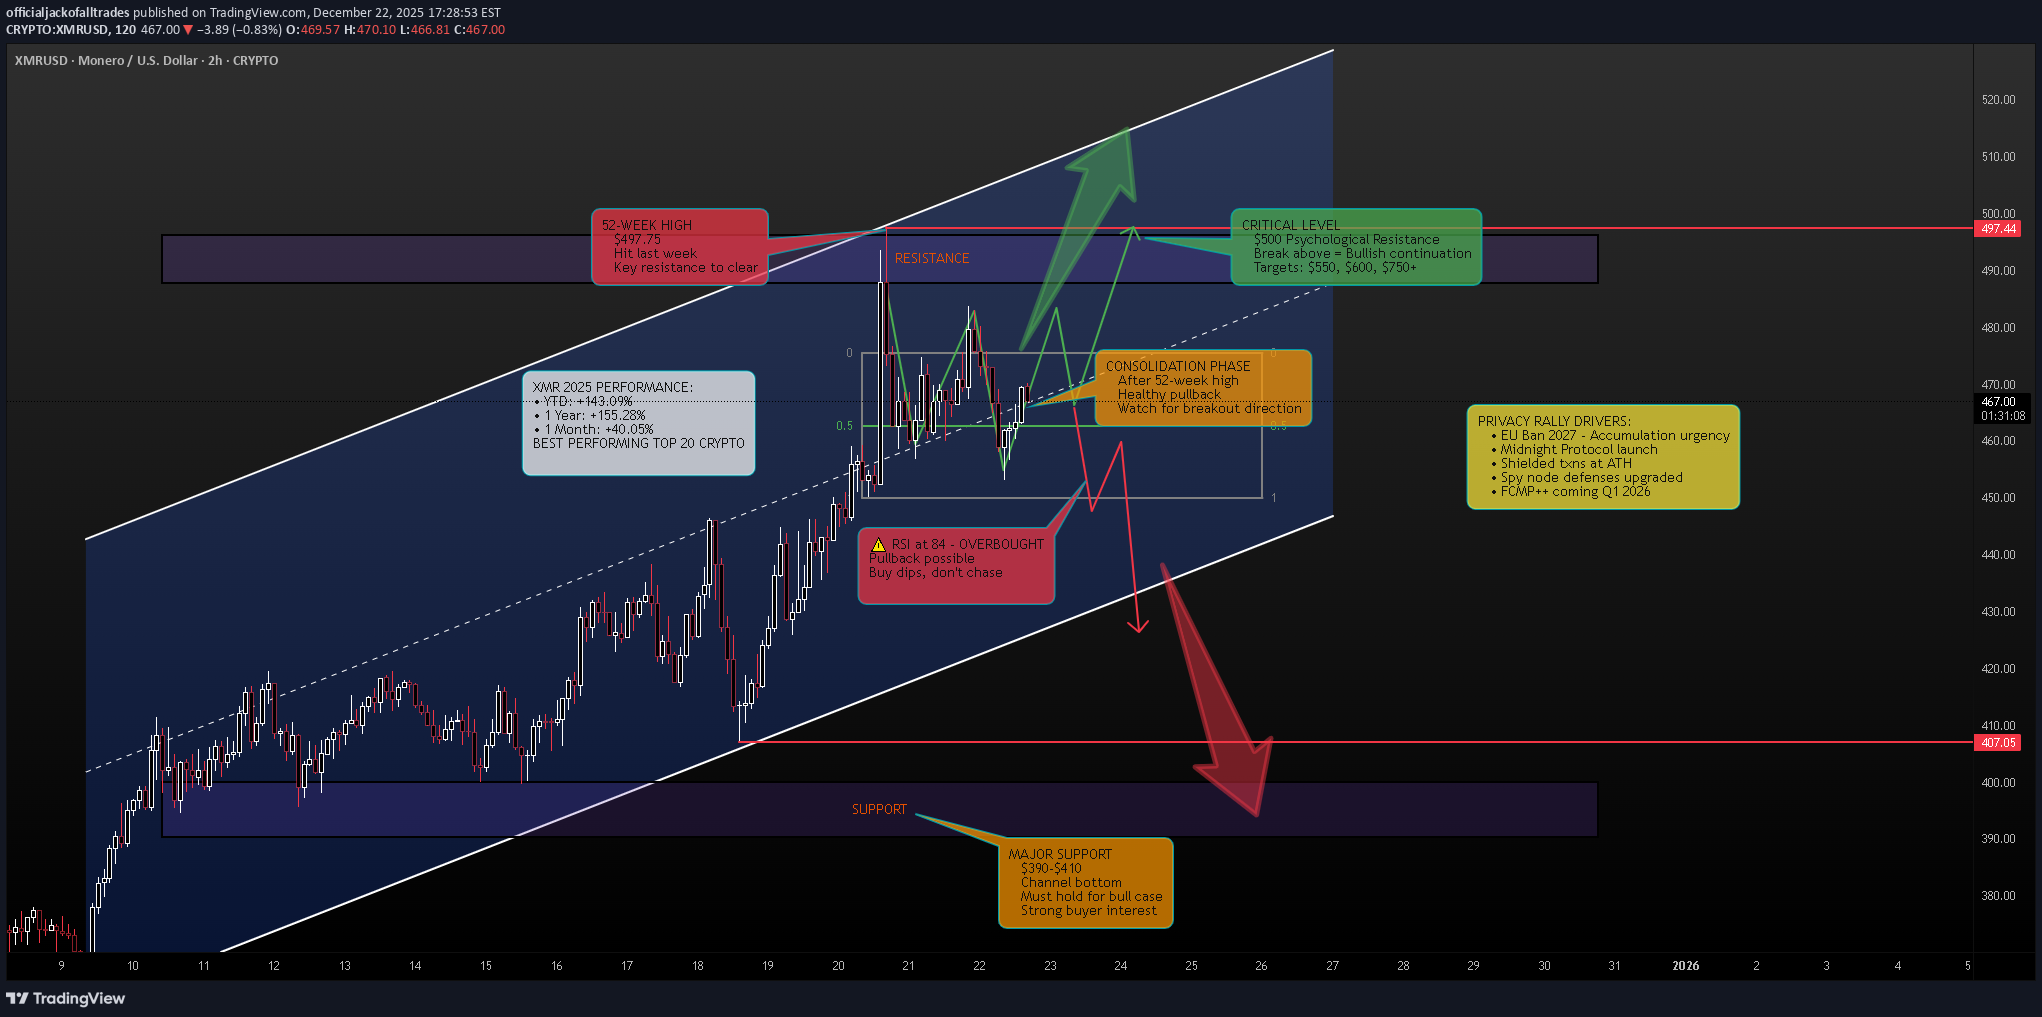
Executive Summary XMRUSD is trading at approximately $469.71 after an extraordinary year that has seen the privacy coin surge +143% YTD and +155% over the past 12 months. Monero recently hit a 52-week high of $497.75 and is now consolidating just below the critical $500 psychological resistance. The privacy narrative is on fire - Cardano's Midnight protocol launch, rising surveillance concerns, and the EU's 2027 privacy coin ban have created a perfect storm of demand. However, with RSI at 84 (overbought) and price near yearly highs, the question is: breakout to $1,000+ or pullback to consolidate gains? BIAS: BULLISH - But Overbought Caution Required The trend is undeniably bullish. The fundamentals support continued upside. But technicals warn of potential short-term pullback before the next leg higher. Current Market Context - December 22, 2025 Monero's performance has been nothing short of spectacular: Current Price: $469.71 (-0.25% on the day) Day's Range: $453.05 - $483.69 52-Week Range: $183.02 - $497.75 52-Week High: $497.75 (hit last week) Market Cap: $8.67 billion 24h Trading Volume: $171.27 million Performance Metrics - ALL GREEN: 1 Week: +14.90% 1 Month: +40.05% 3 Months: +62.54% 6 Months: +49.34% YTD: +143.09% 1 Year: +155.28% This is the BEST performing major cryptocurrency of 2025. Monero has massively outperformed Bitcoin, Ethereum, and virtually every other top 20 coin. THE PRIVACY NARRATIVE - Why XMR Is Exploding 1. EU Privacy Coin Ban (2027) - Bullish Paradox The European Union confirmed plans to prohibit exchanges from listing privacy coins like Monero starting in 2027, citing anti-money laundering concerns. This follows increased scrutiny after high-profile hacks and ransomware attacks. The Paradox: Short-term BULLISH: Users accumulating XMR pre-ban Creates urgency to acquire before restrictions Validates Monero's core value proposition - if governments want to ban it, it must work Long-term risk: Liquidity could dry up if major exchanges delist Monero's fungibility remains key defense against regulatory sidelining 2. Midnight Protocol Sparks Privacy Rally (Dec 20, 2025) Cardano's Midnight protocol launched NIGHT, a privacy token using zero-knowledge proofs. While not directly tied to Monero, the project reignited interest in privacy technology across the entire sector. XMR rose 18% weekly alongside Zcash Privacy tech is back in focus Rising concerns over digital surveillance driving demand Monero benefits from sector momentum Competition from newer privacy solutions exists, but XMR remains the gold standard 3. Technical Breakout Gains Traction (Dec 22, 2025) XMR surged past its 50-day EMA ($449) Shielded transaction volume hitting ALL-TIME HIGHS Analysts note bullish Wyckoff accumulation patterns Rising open interest (+10% weekly) suggests leveraged bets on continued privacy demand Added to CoinDesk 80 Index - reflecting growing market presence 4. Institutional Interest Growing XMR added to CoinDesk 80 Index Increased futures open interest Growing market presence despite regulatory headwinds Privacy as a feature becoming more valued, not less Development Updates - Bullish Fundamentals Monero developers have been extremely active in late 2025: Security Patches (November 2025): Ledger hardware wallet vulnerability patched (view-key export bug) CLI v0.18.4.4 update addressed critical edge case Strengthens trust in hardware wallet integrations Spy Node Defense - "Fluorine Fermi" Upgrade (October 2025): IP subnet filtering introduced to counter surveillance Disrupts tactics used by firms like Chainalysis Complements existing Dandelion++ protections Directly reinforces untraceable transactions RPC Fuzzing Milestone (November 2025): Achieved 100% fuzzing coverage for RPC endpoints Funded by MagicGrants Reduces attack vectors for hackers Hardens nodes against exploits FCMP++ Scaling Prep (November 2025): Full-Chain Membership Proofs alpha testing finalized Beta stressnet expected Q1 2026 Could enable lighter nodes and better scalability Aims to solidify Monero as most private Layer 1 2026 Roadmap - Major Upgrades Coming FCMP++ Beta Stressnet (Q1 2026) - Scaling decisions finalized Bulletproofs++ (2026) - 30% smaller transactions, 40% faster verification Seraphis & Jamtis (2026) - Enhanced anonymity protocols GetMonero.org Redesign (2026) - Improved user experience Technical Structure Analysis Price Action Overview - 2 Hour Timeframe The chart shows a textbook bullish structure: Ascending Channel Pattern: Clear ascending channel established over past weeks Higher highs and higher lows consistently forming Channel support: Rising trendline from lows Channel resistance: Parallel line at highs Price currently in upper half of channel Recent Price Action: Price hit resistance zone near $490-$500 Pulled back and now consolidating Currently in a smaller consolidation range ($455-$490) Fibonacci retracement levels visible (0.5 and 0.6 levels) Testing mid-channel support Key Observations: 52-week high of $497.75 represents immediate resistance $500 psychological level is THE level to watch Support zone at $407-$410 area (channel bottom) Strong uptrend intact - no signs of reversal yet Consolidation after 52-week high is healthy, not bearish Key Support and Resistance Levels Resistance Levels: $483-$490 - Immediate resistance (recent highs) $497.75 - 52-week high $500 - CRITICAL psychological resistance $550 - Next major resistance if $500 breaks $600 - Secondary target $1,000 - Major psychological target (community expectation) Support Levels: $453-$460 - Immediate support (day's low area) $449 - 50-day EMA (key moving average) $430-$440 - Secondary support $407-$410 - MAJOR SUPPORT ZONE (channel bottom) $380-$390 - Deep support $350 - Extended support if correction deepens Moving Average Analysis Price trading well above 50-day EMA ($449) All major moving averages sloping upward Golden cross patterns on multiple timeframes MAs providing dynamic support on pullbacks Trend structure extremely bullish RSI Analysis - OVERBOUGHT WARNING RSI currently at 84 - OVERBOUGHT territory This is the primary caution signal Overbought RSI doesn't mean immediate reversal In strong trends, RSI can stay overbought for extended periods However, pullbacks from overbought levels are common Watch for RSI divergence as potential warning sign Volume Analysis 24h volume: $171.27 million Volume supporting the uptrend Shielded transaction volume at ALL-TIME HIGHS Open interest rising (+10% weekly) Healthy volume profile for continuation Community Sentiment - Extremely Bullish Bull Case - $1,000+ Targets olgerd_butko : "Monero screams insta teleportation above 1k. Privacy by default. No hype. Just real facts." SoonTzu : "Monero has only 0.2% of total crypto value. With XMR supply matching BTC's, $90k BTC implies massive XMR upside." - This comparison suggests theoretical $1,500+ XMR price if adoption parity occurs. Bear Case - Regulatory Concerns @Nicat_eth : "Monero edged lower as exchange delistings and privacy scrutiny intensify." Bearish pressure stems from shrinking liquidity on some exchanges, though price action has defied this concern. Regulatory Landscape - Double-Edged Sword Delistings and Restrictions: Kraken halted XMR for UK users (late 2024) Kraken halted XMR for EEA users (November 2025) Exodus wallet ended XMR support (August 2025) EU ban coming in 2027 Why This Is Actually Bullish (Short-Term): Validates Monero's privacy effectiveness Creates urgency to accumulate before restrictions Proves the technology works as intended Decentralized exchanges and P2P trading remain available Monero's fungibility makes it resistant to blacklisting SCENARIO ANALYSIS BULLISH SCENARIO - Breakout Above $500 Trigger Conditions: Daily close above $500 with volume RSI holds above 70 without major divergence Continued privacy narrative momentum Bitcoin remains stable or bullish Ascending channel breakout to upside Price Targets if Bullish: Target 1: $550 - First resistance above $500 Target 2: $600 - Secondary target Target 3: $750 - Extended target Moon Target: $1,000+ (community expectation) Bullish Catalysts: FCMP++ beta stressnet success (Q1 2026) Continued privacy rally momentum EU ban fears driving accumulation Shielded transactions continuing to hit ATHs Altcoin season rotation Bulletproofs++ and Seraphis upgrades BEARISH SCENARIO - Pullback to Support Trigger Conditions: Rejection at $500 with bearish candle RSI divergence forms (lower highs on RSI, higher highs on price) Break below ascending channel support Broader crypto market weakness Major exchange delisting announcement Price Targets if Bearish: Target 1: $449 - 50-day EMA retest Target 2: $430-$440 - Secondary support Target 3: $407-$410 - Channel bottom / major support Extended: $350-$380 if channel breaks Bearish Risks: RSI at 84 - overbought Near 52-week high - profit-taking likely Regulatory headlines could spook market Thin liquidity on some exchanges Broader crypto correction risk NEUTRAL SCENARIO - Consolidation Most likely short-term outcome: Price consolidates between $450-$490 RSI cools off from overbought levels Builds base for next leg higher Healthy consolidation after massive rally Watch for breakout direction MY ASSESSMENT - BULLISH WITH CAUTION The weight of evidence strongly favors bulls: +143% YTD performance speaks for itself Privacy narrative is the strongest it's been in years Development activity is robust Shielded transactions at ATH Community sentiment extremely bullish Ascending channel intact All timeframes showing bullish structure However, caution is warranted: RSI at 84 is overbought Near 52-week high - natural resistance $500 is major psychological barrier Some profit-taking expected Regulatory headlines could cause volatility My Stance: BULLISH - Buy Dips Strategy I believe XMR will eventually break $500 and continue higher. The fundamentals and narrative support it. However, I would not chase at current levels with RSI at 84. Instead: Wait for pullback to $449-$460 area for better entry Or wait for confirmed breakout above $500 with volume Avoid buying in the middle of the range Trade Framework Scenario 1: Breakout Trade Above $500 Entry Conditions: Daily candle closes above $500 Volume exceeds recent average RSI holds above 65 (not diverging) Trade Parameters: Entry: $505-$515 on confirmed breakout Stop Loss: $475 below recent support Target 1: $550 (Risk-Reward ~1:1) Target 2: $600 (Risk-Reward ~1:2) Target 3: $750 (Extended) Scenario 2: Buy the Dip at Support Entry Conditions: Price pulls back to $449-$460 zone RSI cools to 50-60 range Bullish rejection candle at support Ascending channel support holds Trade Parameters: Entry: $450-$460 on support test Stop Loss: $420 below channel support Target 1: $490-$500 (Risk-Reward ~1:1.5) Target 2: $550 (Risk-Reward ~1:3) Target 3: $600 (Extended) Scenario 3: Channel Bottom Buy Entry Conditions: Price tests $407-$410 major support zone Strong bounce with volume RSI oversold or near oversold Trade Parameters: Entry: $410-$420 at channel bottom Stop Loss: $385 below support zone Target 1: $460-$470 (Risk-Reward ~1:2) Target 2: $500 (Risk-Reward ~1:3.5) Target 3: $550+ (Extended) Risk Management Guidelines Position sizing: 2-3% max risk per trade Respect overbought RSI - don't chase Use hard stops - privacy coins can be volatile Scale into positions rather than all-in entries Take partial profits at each target (33% each) Move stop to breakeven after first target Monitor regulatory news closely Be aware of lower liquidity on some exchanges Invalidation Levels Bullish thesis invalidated if: Price closes below $407 (channel bottom) Ascending channel breaks down RSI divergence confirms with lower price Major exchange delisting causes panic Bitcoin crashes below $85,000 Bearish thesis invalidated if: Price closes above $500 with volume RSI makes new highs with price Shielded transactions continue hitting ATHs Privacy narrative accelerates further Conclusion XMRUSD is the standout performer of 2025 with +143% YTD gains. The privacy narrative is firing on all cylinders - EU ban fears, Midnight protocol launch, surveillance concerns, and development upgrades have created a perfect storm for Monero. The Numbers: YTD Performance: +143.09% 1-Year Performance: +155.28% 52-Week High: $497.75 Current Price: $469.71 RSI: 84 (Overbought) Market Cap: $8.67 billion Key Levels: $500 - CRITICAL resistance / breakout level $497.75 - 52-week high $449 - 50-day EMA support $407-$410 - Major support zone (channel bottom) The Setup: Monero is consolidating just below its 52-week high after an incredible rally. The trend is bullish, fundamentals are strong, and the privacy narrative is the best it's been in years. However, RSI at 84 warns of potential short-term pullback. Strategy: Don't chase at current levels Buy dips to $449-$460 support Or buy confirmed breakout above $500 Targets: $550, $600, $750+ Stop below $420 or channel support The path of least resistance is higher. Privacy is becoming more valuable, not less. Monero's technology is proven, development is active, and the community is committed. The EU ban paradoxically validates everything Monero stands for. $1,000 XMR is not a meme - it's a matter of when, not if. This is not financial advice. Always conduct independent research and manage risk appropriately.

Monero Confirmed Breakout
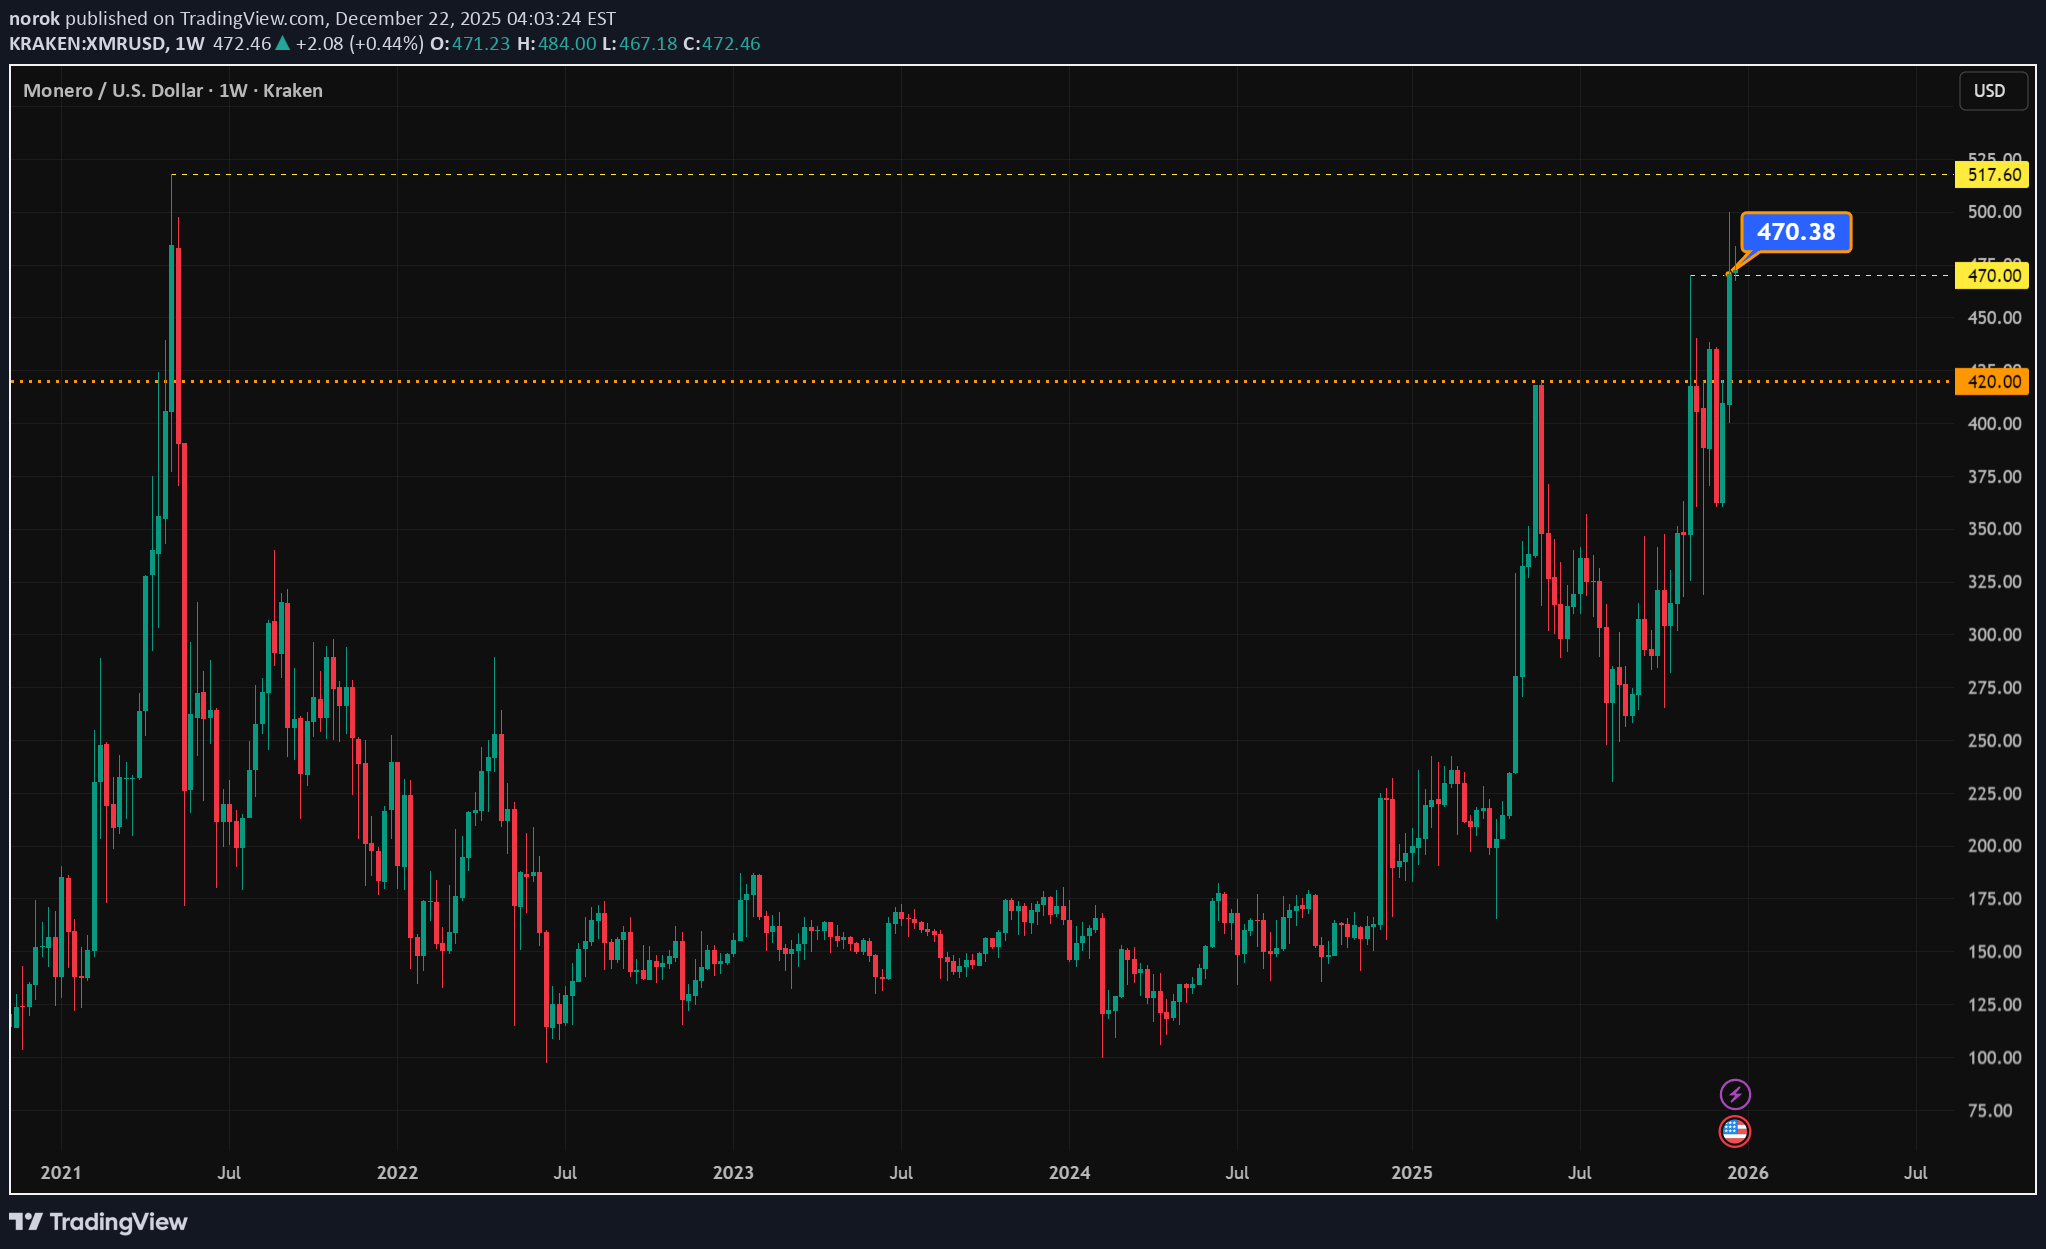
Monero XMRUSD اوج محلی را در 470 با بسته شدن هفتگی bar از 470.38 شکسته است. حتی اگر 0.38 باشد، باز هم این یک قانون برای تایید شکست است. مقاومت بعدی در تمام زمان ها در 517.60 بود. با توجه به تأیید شکست و حرکت، بیشترین احتمال وجود دارد که قیمت ATH را آزمایش کند و سپس دید که آیا آن bar هفتگی بسته می شود تا آن را تأیید کنیم. چقدر می توان Monero برود؟ من فرض نمی کنم که به طور دقیق با تاپ ها تماس بگیرم. با توجه به پیشرفت ATH ها، به احتمال زیاد بالاترین مقدار بعدی حدود 593 بود. با استفاده از پیش بینی نوسانات تاریخی 3 ساله، هدف می تواند 793 باشد. هشدار: چنین افزایش سریع قیمت به معنای نوسانات بالا ذاتی است و نگاهی به تاریخچه طولانی مدت مونرو نشان می دهد که یک بازگشت چشمگیر در نهایت بسیار محتمل است. در این مرحله انجام این کار بسیار دشوار است. همانطور که گفته شد - من همچنان معتقدم که Monero بهترین شرط نامتقارن در ارزهای دیجیتال در حال حاضر است.

تحلیل فوری XMR: آیا قیمت به اوج تاریخی میرسد یا عقبنشینی میکنیم؟
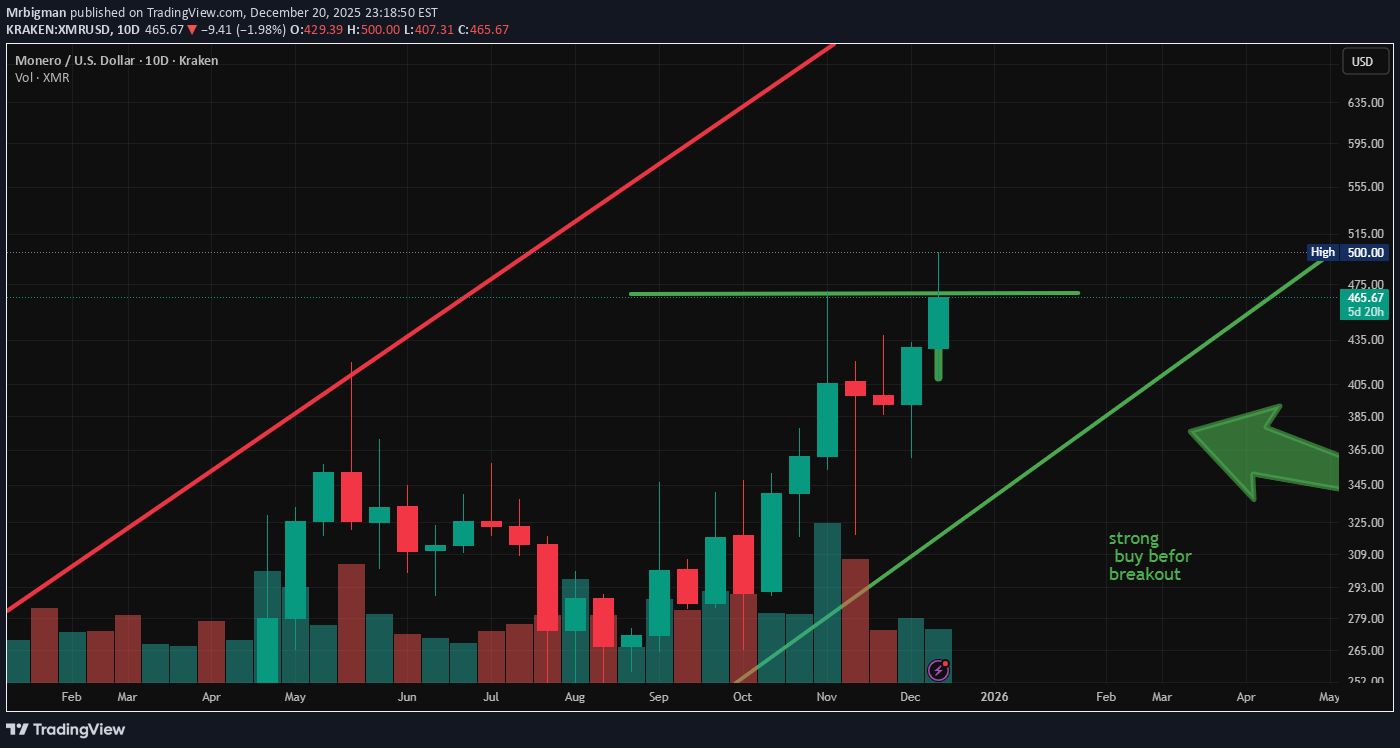
بهروزرسانی سریع ما به وضوح به دنبال شکستهایی هستیم که اکنون اتفاق میافتد، اما روز بعد تأیید میکنیم که آیا مجدداً دنبال میشویم یا به ath فشار میدهیم، من بهعنوان soon بهروزرسانی میکنم که از بالاترین سطح قدیمی عبور کنیم. تعصب من این است که فشار جدید به ath می رسد ما در حال صعود بدون هیچ گونه نوسان دیوانه وار آهسته و پیوسته هستیم که خوب به نظر می رسد
مونرو (XMR) آماده جهش بزرگ: رمز ارز جدید در مسیر صعود نجومی!
xmr به دنبال نقره در ماکرو و طلا در 4h است. ما به تازگی شاهد شکستن xrm به بالاترین سطح جدید در این سال بودیم! ..در همین لحظه ما شاهد یک استراحت و تست مجدد کلاسیک هستیم..حالا اگر در زمان کمتر مطابقت داشته باشیم، در کشف قیمت و رفتن به کریسمس های جدید در بالاترین حد خود بود. هدف اول و سپس استراحت موقت @ 3200.00 دوم میانی 5 هزار ... اهداف فقط برای یک شکست تایید شده در زمان کوچکتر از ماه معتبر هستند. آماده باشید من بلافاصله پس از انتشار xrm شما را به روز می کنم!
سلب مسئولیت
هر محتوا و مطالب مندرج در سایت و کانالهای رسمی ارتباطی سهمتو، جمعبندی نظرات و تحلیلهای شخصی و غیر تعهد آور بوده و هیچگونه توصیهای مبنی بر خرید، فروش، ورود و یا خروج از بازارهای مالی نمی باشد. همچنین کلیه اخبار و تحلیلهای مندرج در سایت و کانالها، صرفا بازنشر اطلاعات از منابع رسمی و غیر رسمی داخلی و خارجی است و بدیهی است استفاده کنندگان محتوای مذکور، مسئول پیگیری و حصول اطمینان از اصالت و درستی مطالب هستند. از این رو ضمن سلب مسئولیت اعلام میدارد مسئولیت هرنوع تصمیم گیری و اقدام و سود و زیان احتمالی در بازار سرمایه و ارز دیجیتال، با شخص معامله گر است.