
SHIB
شیبا اینو
| تریدر | نوع سیگنال | حد سود/ضرر | زمان انتشار | مشاهده پیام |
|---|---|---|---|---|
 zmoney78رتبه: 2558 | خرید | حد سود: ۰٫۰۰۰۰۳۳۷۶ حد ضرر: تعیین نشده | ۱۴۰۴/۸/۱۶ | |
 mrenigmaرتبه: 4210 | خرید | حد سود: ۰٫۰۰۰۰۱۲۵۷ حد ضرر: تعیین نشده | ۱۴۰۴/۸/۱۷ | |
 SwallowAcademyرتبه: 33545 | خرید | حد سود: ۰٫۰۰۰۰۱۲۱۵ حد ضرر: تعیین نشده | ۱۴۰۴/۸/۲۱ | |
 NEowave1998رتبه: 33698 | خرید | حد سود: تعیین نشده حد ضرر: تعیین نشده | ۱۴۰۴/۸/۱۳ | |
 MMBTtraderرتبه: 34447 | خرید | حد سود: ۰٫۰۰۰۰۱۶ حد ضرر: تعیین نشده | ۱۴۰۴/۸/۱۹ |
معرفی شیبا اینو
نمودار قیمت شیبا اینو
سود ۳ ماهه :
خلاصه سیگنالهای شیبا اینو
سیگنالهای شیبا اینو
فیلتر
مرتب سازی پیام براساس
نوع پیام
نوع تریدر
فیلتر زمان

NavidBasatzadeh
سقوط احتمالی شیبا اینو: آیا کف کانال نزولی در دسترس است؟
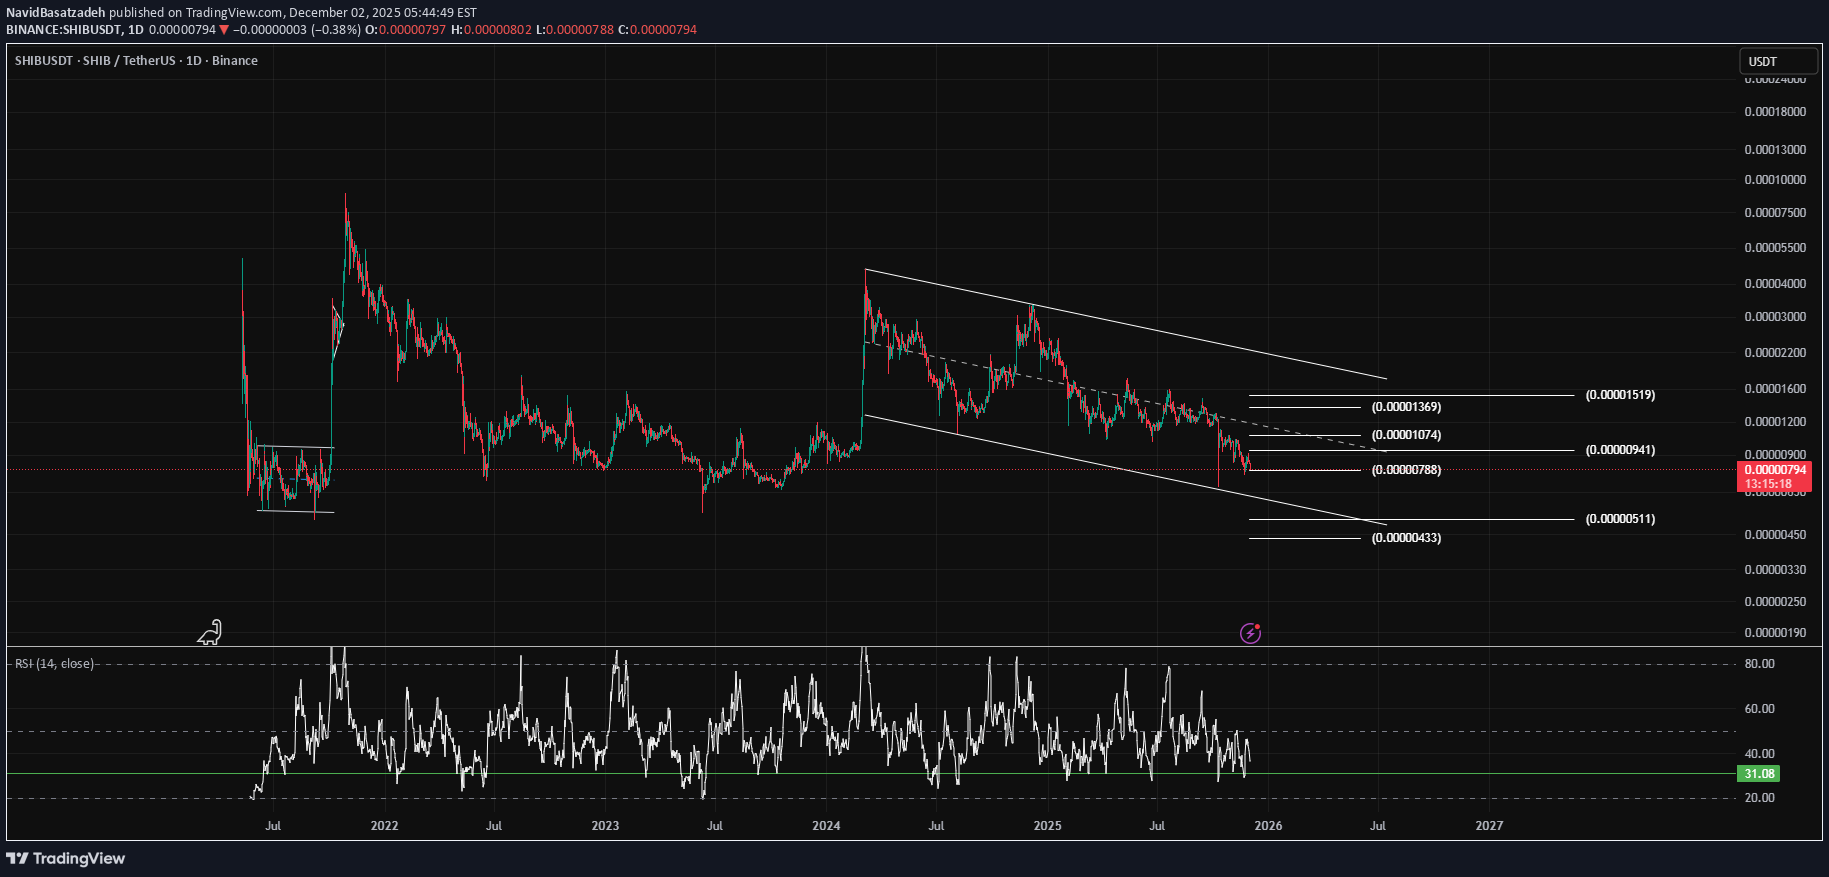
به نظر میرسد که روند نزولی ادامه داشت و احتمال رسیدن به کف کانال نزولی وجود دارد.
NavidBasatzadeh
تحلیل روزانه شیبا: آیا کف کانال نزولی در انتظار است؟
به نظر میرسد که روند نزولی ادامه یافت و احتمال رسیدن به کف کانال نزولی وجود دارد.
NavidBasatzadeh
شیبا در مسیر نزولی: آیا کف کانال حمایتی فرامیرسد؟
به نظر میرسد که روند نزولی ادامه یابد و احتمال رسیدن به کف کانال نزولی وجود دارد.
NavidBasatzadeh
شيبا در تایم روزانه: آیا سقوط ادامه دارد و کف کانال نزولی لمس خواهد شد؟
به نظر میرسد که روند نزولی ادامه داشته باشد و احتمال رسیدن به کف کانال نزولی وجود دارد.
NavidBasatzadeh
احتمال سقوط بیشتر شیبا: کف کانال نزولی کجاست؟
به نظر میرسد روند نزولی ادامه یابد و احتمال دارد به کف کانال نزولی برسد.
NavidBasatzadeh
احتمال سقوط بیشتر شیبا اینو؛ آیا کف کانال نزولی در انتظار است؟
به نظر میرسد که روند نزولی ادامه داشت و احتمال رسیدن به کف کانال نزولی وجود دارد.
NavidBasatzadeh
احتمال سقوط قیمت شیبا اینو به کف کانال نزولی در تایم روزانه!
به نظر میرسد روند نزولی ادامه یابد و احتمال رسیدن به کف کانال نزولی وجود دارد.
NavidBasatzadeh
احتمال سقوط بیشتر شیبا اینو: آیا کف کانال نزولی در انتظار است؟
به نظر میرسد روند نزولی ادامه یابد و احتمال رسیدن به کف کانال نزولی وجود دارد.

کجا شیبا اینو بخریم؟ راهنمای جامع بهترین صرافیها برای خرید شیبا
---------------------------------------------------------------------------------------

EhsanZeydabadi
تحلیل SHIB: آیا این اصلاح ادامه دارد؟ نقاط ورود طلایی برای خرید و فروش
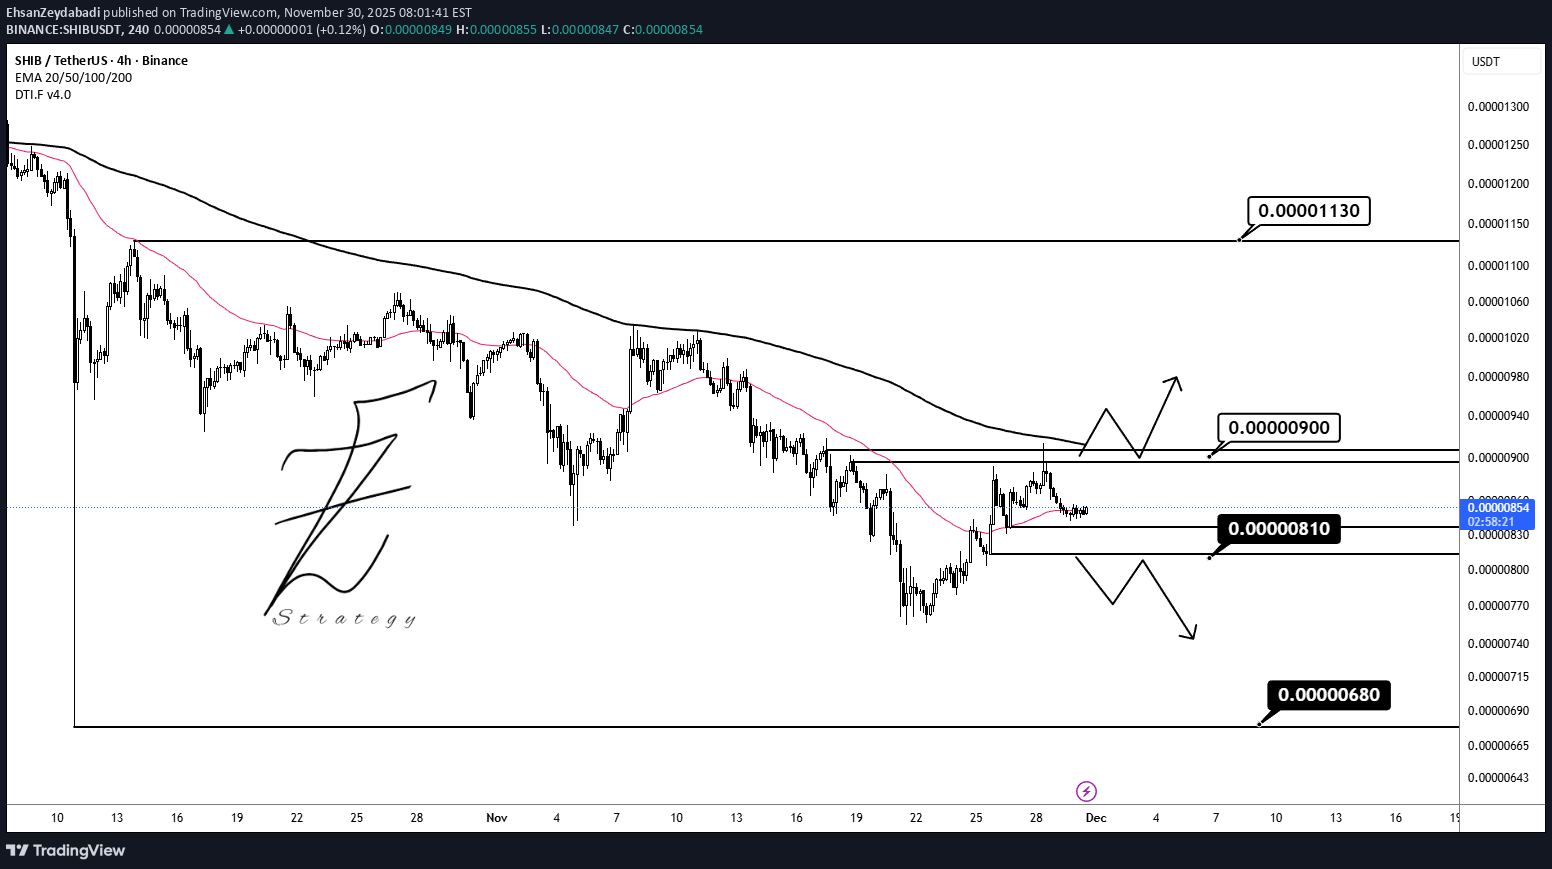
ما در یک اصلاح در روند فروش بزرگ (Big Short) قرار داریم، اما انتظار میرود که این فروش ناموفق باشد و قیمت به سطوح بالاتری ادامه دهد. من منتظر ورود به معامله هستم؛ در صورت شکست سطح ۰.۰۰۰۰۹۰۰ برای موقعیت خرید (Buy) و شکست سطح ۰.۰۰۰۰۸۱۰ برای پوزیشن فروش (Short). PEPEUSD PEPEUSDT
شیبا اینو چیست؟
معرفی شیبا اینو
قیمت شیبا اینو
آیا شیبا اینو برای سرمایهگذاری مناسب است ؟
سلب مسئولیت
هر محتوا و مطالب مندرج در سایت و کانالهای رسمی ارتباطی سهمتو، جمعبندی نظرات و تحلیلهای شخصی و غیر تعهد آور بوده و هیچگونه توصیهای مبنی بر خرید، فروش، ورود و یا خروج از بازارهای مالی نمی باشد. همچنین کلیه اخبار و تحلیلهای مندرج در سایت و کانالها، صرفا بازنشر اطلاعات از منابع رسمی و غیر رسمی داخلی و خارجی است و بدیهی است استفاده کنندگان محتوای مذکور، مسئول پیگیری و حصول اطمینان از اصالت و درستی مطالب هستند. از این رو ضمن سلب مسئولیت اعلام میدارد مسئولیت هرنوع تصمیم گیری و اقدام و سود و زیان احتمالی در بازار سرمایه و ارز دیجیتال، با شخص معامله گر است.