ELDORADOFX
@t_ELDORADOFX

What symbols does the trader recommend buying?
Purchase History
پیام های تریدر
Filter
تحلیل بیت کوین امروز: آیا BTC به مقاومت 105 هزار دلاری میرسد؟ (پیشبینی سشن آسیا)
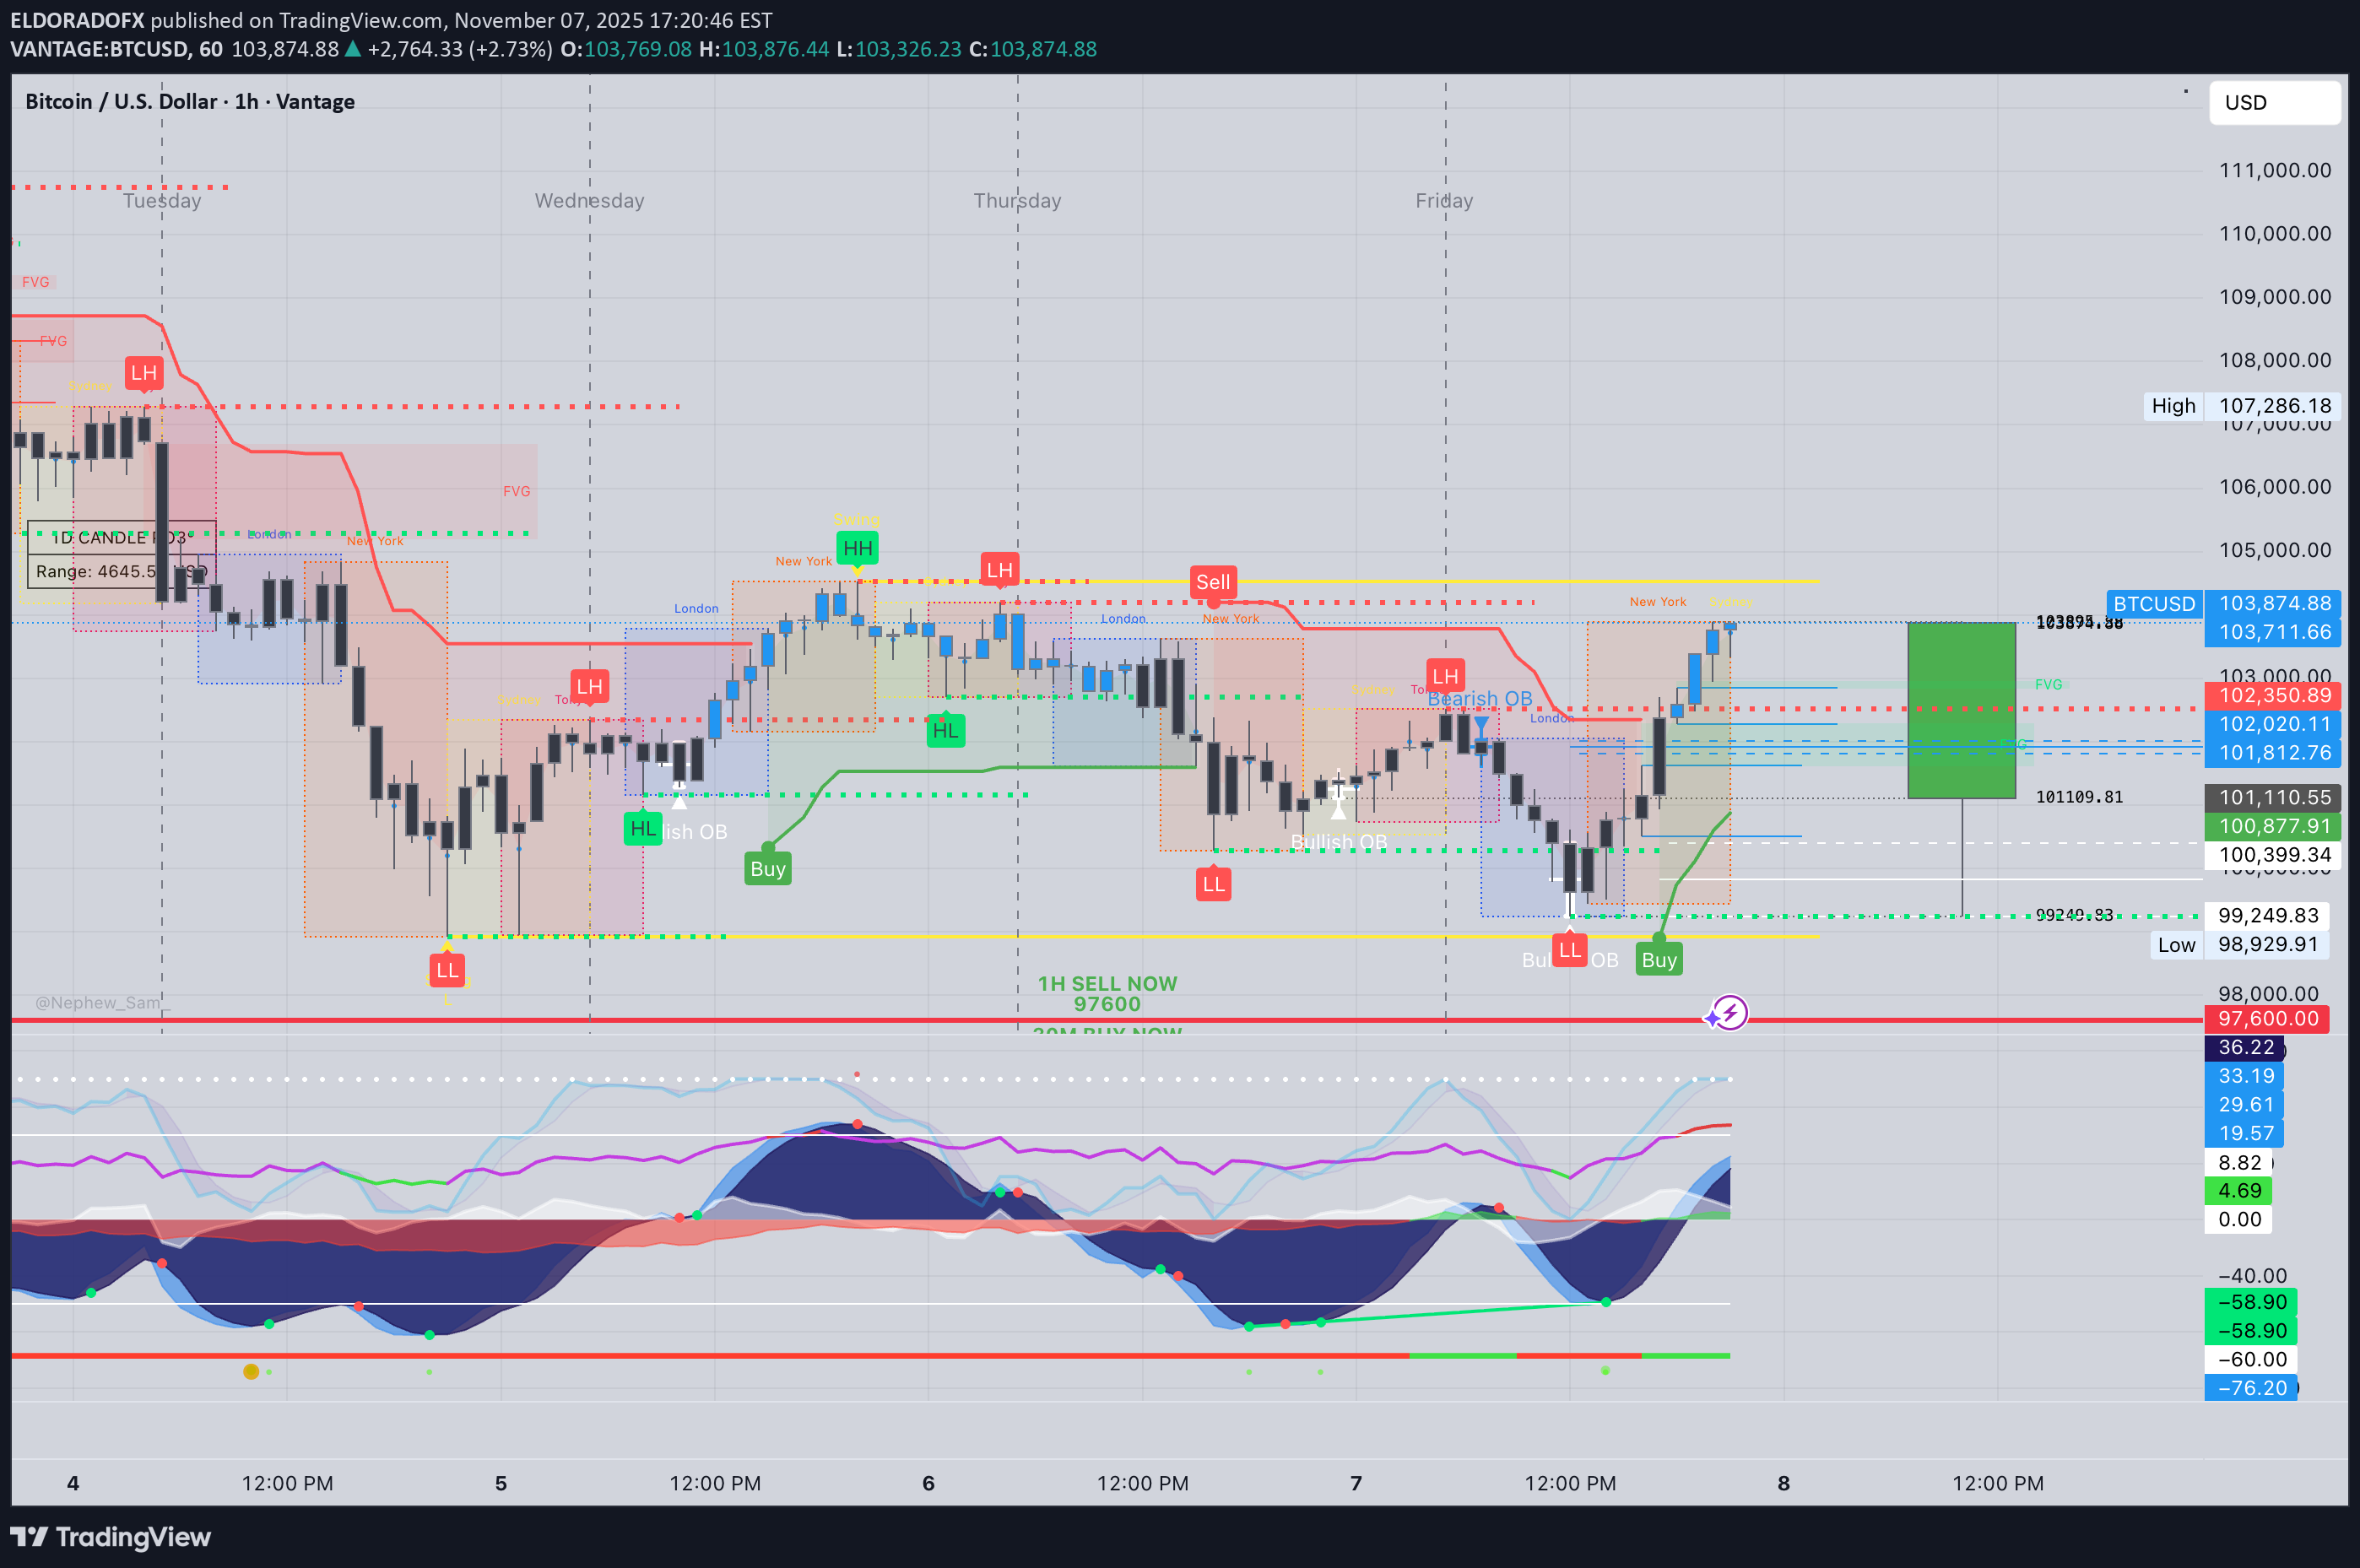
1. Market Overview BTCUSD is trading around $103,800, posting a strong rebound from the $99,200 liquidity sweep earlier in the week. The bullish momentum is driven by the reclaim of short-term structure and EMA crossovers on intraday charts. While the recovery is technically healthy, BTC now approaches critical resistance between $104,800–$105,400, where rejection or liquidity grabs could occur before continuation. ⸻ 2. Technical Breakdown 🔹 Daily (D1): •The daily structure shows a bullish CHoCH from the 99K demand sweep. •RSI has recovered from oversold (now 41.2), signaling early trend recovery. •MACD histogram tightening — selling momentum fading. •Price is still below the 100EMA (~108K), so overall macro bias remains neutral until 105K–108K is cleared. 🔹 H1: •Clear BOS confirmed with a sequence of higher highs and higher lows. •EMAs aligned bullish (20 > 50 > 200). •RSI near 66, showing strong intraday bullish strength. •MACD positive, confirming momentum favoring the upside. 🔹 15M–5M: •Strong intraday trend channel formed with consistent BOS toward 103,800. •RSI approaching 70 — minor exhaustion likely. •Pullback to 102,200–101,900 expected before next impulsive wave. ⸻ 3. Fibonacci Analysis (Last Swing: 99,249 → 103,895) LevelPrice (USD)Note 38.2%102,200First retracement area 50.0%101,570Mid-zone equilibrium 61.8%100,940Strong support confluence 🎯 Golden Zone: 102,200 – 100,940 → Potential re-entry area for continuation buys. ⸻ 4. High-Probability Trade Scenarios 📈 Bullish Continuation Setup (Main Bias) •Entry Zone: 102,200 – 100,940 (Fibonacci Golden Zone) •TPs: 103,800 → 104,800 → 105,400 → 106,000 •SL: Below 100,600 •Confirmation: Bullish engulfing candle or RSI bounce from 50–55 •Rationale: Break of structure + bullish EMA alignment + increasing volume. 💥 Breakout BUY Setup •Trigger: 1H close above 104,000 •Retest Zone: 103,800–103,600 •TPs: 104,800 → 105,400 → 106,500 •SL: Below 103,200 📉 Bearish Countertrend Setup •Entry Zone: 104,800 – 105,400 (Major resistance) •TPs: 103,800 → 103,000 → 102,200 •SL: Above 105,600 •Confirmation: RSI divergence or bearish engulfing candle on H1/H4 •Rationale: Liquidity trap possible at 105K; short-term overextension. ⸻ 5. Fundamental Watch •Weekend sessions = low liquidity → prone to manipulation and stop hunts. •DXY holding above 105, limiting BTC upside in the medium term. •No major US macro data releases until early next week (CPI & PPI). •Expect Asian session volatility spikes between 1 AM–5 AM UTC. ⸻ 6. Key Technical Levels TypeLevels (USD) Resistance104,000 / 104,800 / 105,400 / 106,000 Support103,000 / 102,200 / 100,940 / 99,200 Golden Zone102,200 – 100,940 Break Buy Trigger> 104,000 Break Sell Trigger< 101,000 ⸻ 7. Analyst Summary BTC shows a clean short-term bullish reversal from the 99K base, supported by strong momentum and structure recovery. However, traders should watch closely the 104,800–105,400 zone — a key liquidity cluster where potential profit-taking or rejection could occur. Pullbacks into 102,200–100,940 remain ideal buy-the-dip zones, targeting 105K+ extension. A confirmed H1 close below 101K would invalidate this bullish bias and reintroduce downside risk. ⸻ 8. Final Bias Summary ✅ Primary Bias: Bullish above 102K (Buy dips toward 102,200–100,940) ⚠️ Secondary Bias: Bearish only if rejection forms at 105,400 or break below 101K ⸻ 🥇 ElDoradoFx PREMIUM 3.0 – PERFORMANCE 07/11/2025 🥇 📅 Precision. Profit. Live Execution. ━━━━━━━━━━━━━━━ 🪙 XAU/USD (GOLD) 🔻 SELL +60 PIPS 🟢 BUY +40 PIPS 🟢 BUY +90 PIPS ❌ BUY -40 PIPS (SL) 🟢 BUY +120 PIPS --- ▶ LIVE TRADING SESSION RESULTS 💥 BUY +100 PIPS 💥 BUY +125 PIPS 💥 BUY +150 PIPS 🧠 Our live sessions continue to deliver consistent profits — traders learned in real-time how to identify clean entries, scale in safely, and secure profits like pros. ━━━━━━━━━━━━━━━ 💰 TOTAL PIPS GAIN: +645 PIPS 📊 8 Trades → 7 Wins | 1 SL 🎯 Accuracy: 87% ━━━━━━━━━━━━━━━ 🔥 Another powerful day for ElDoradoFx Premium 3.0 — combining analysis, education, and execution all in one live environment. 📈 If you’re not joining the live sessions yet, you’re missing real-time profitable setups every day. 👏 Congratulations if you profited! ✅✅✅🚀🚀🚀 — ElDoradoFx PREMIUM 3.0 Team 💼📊
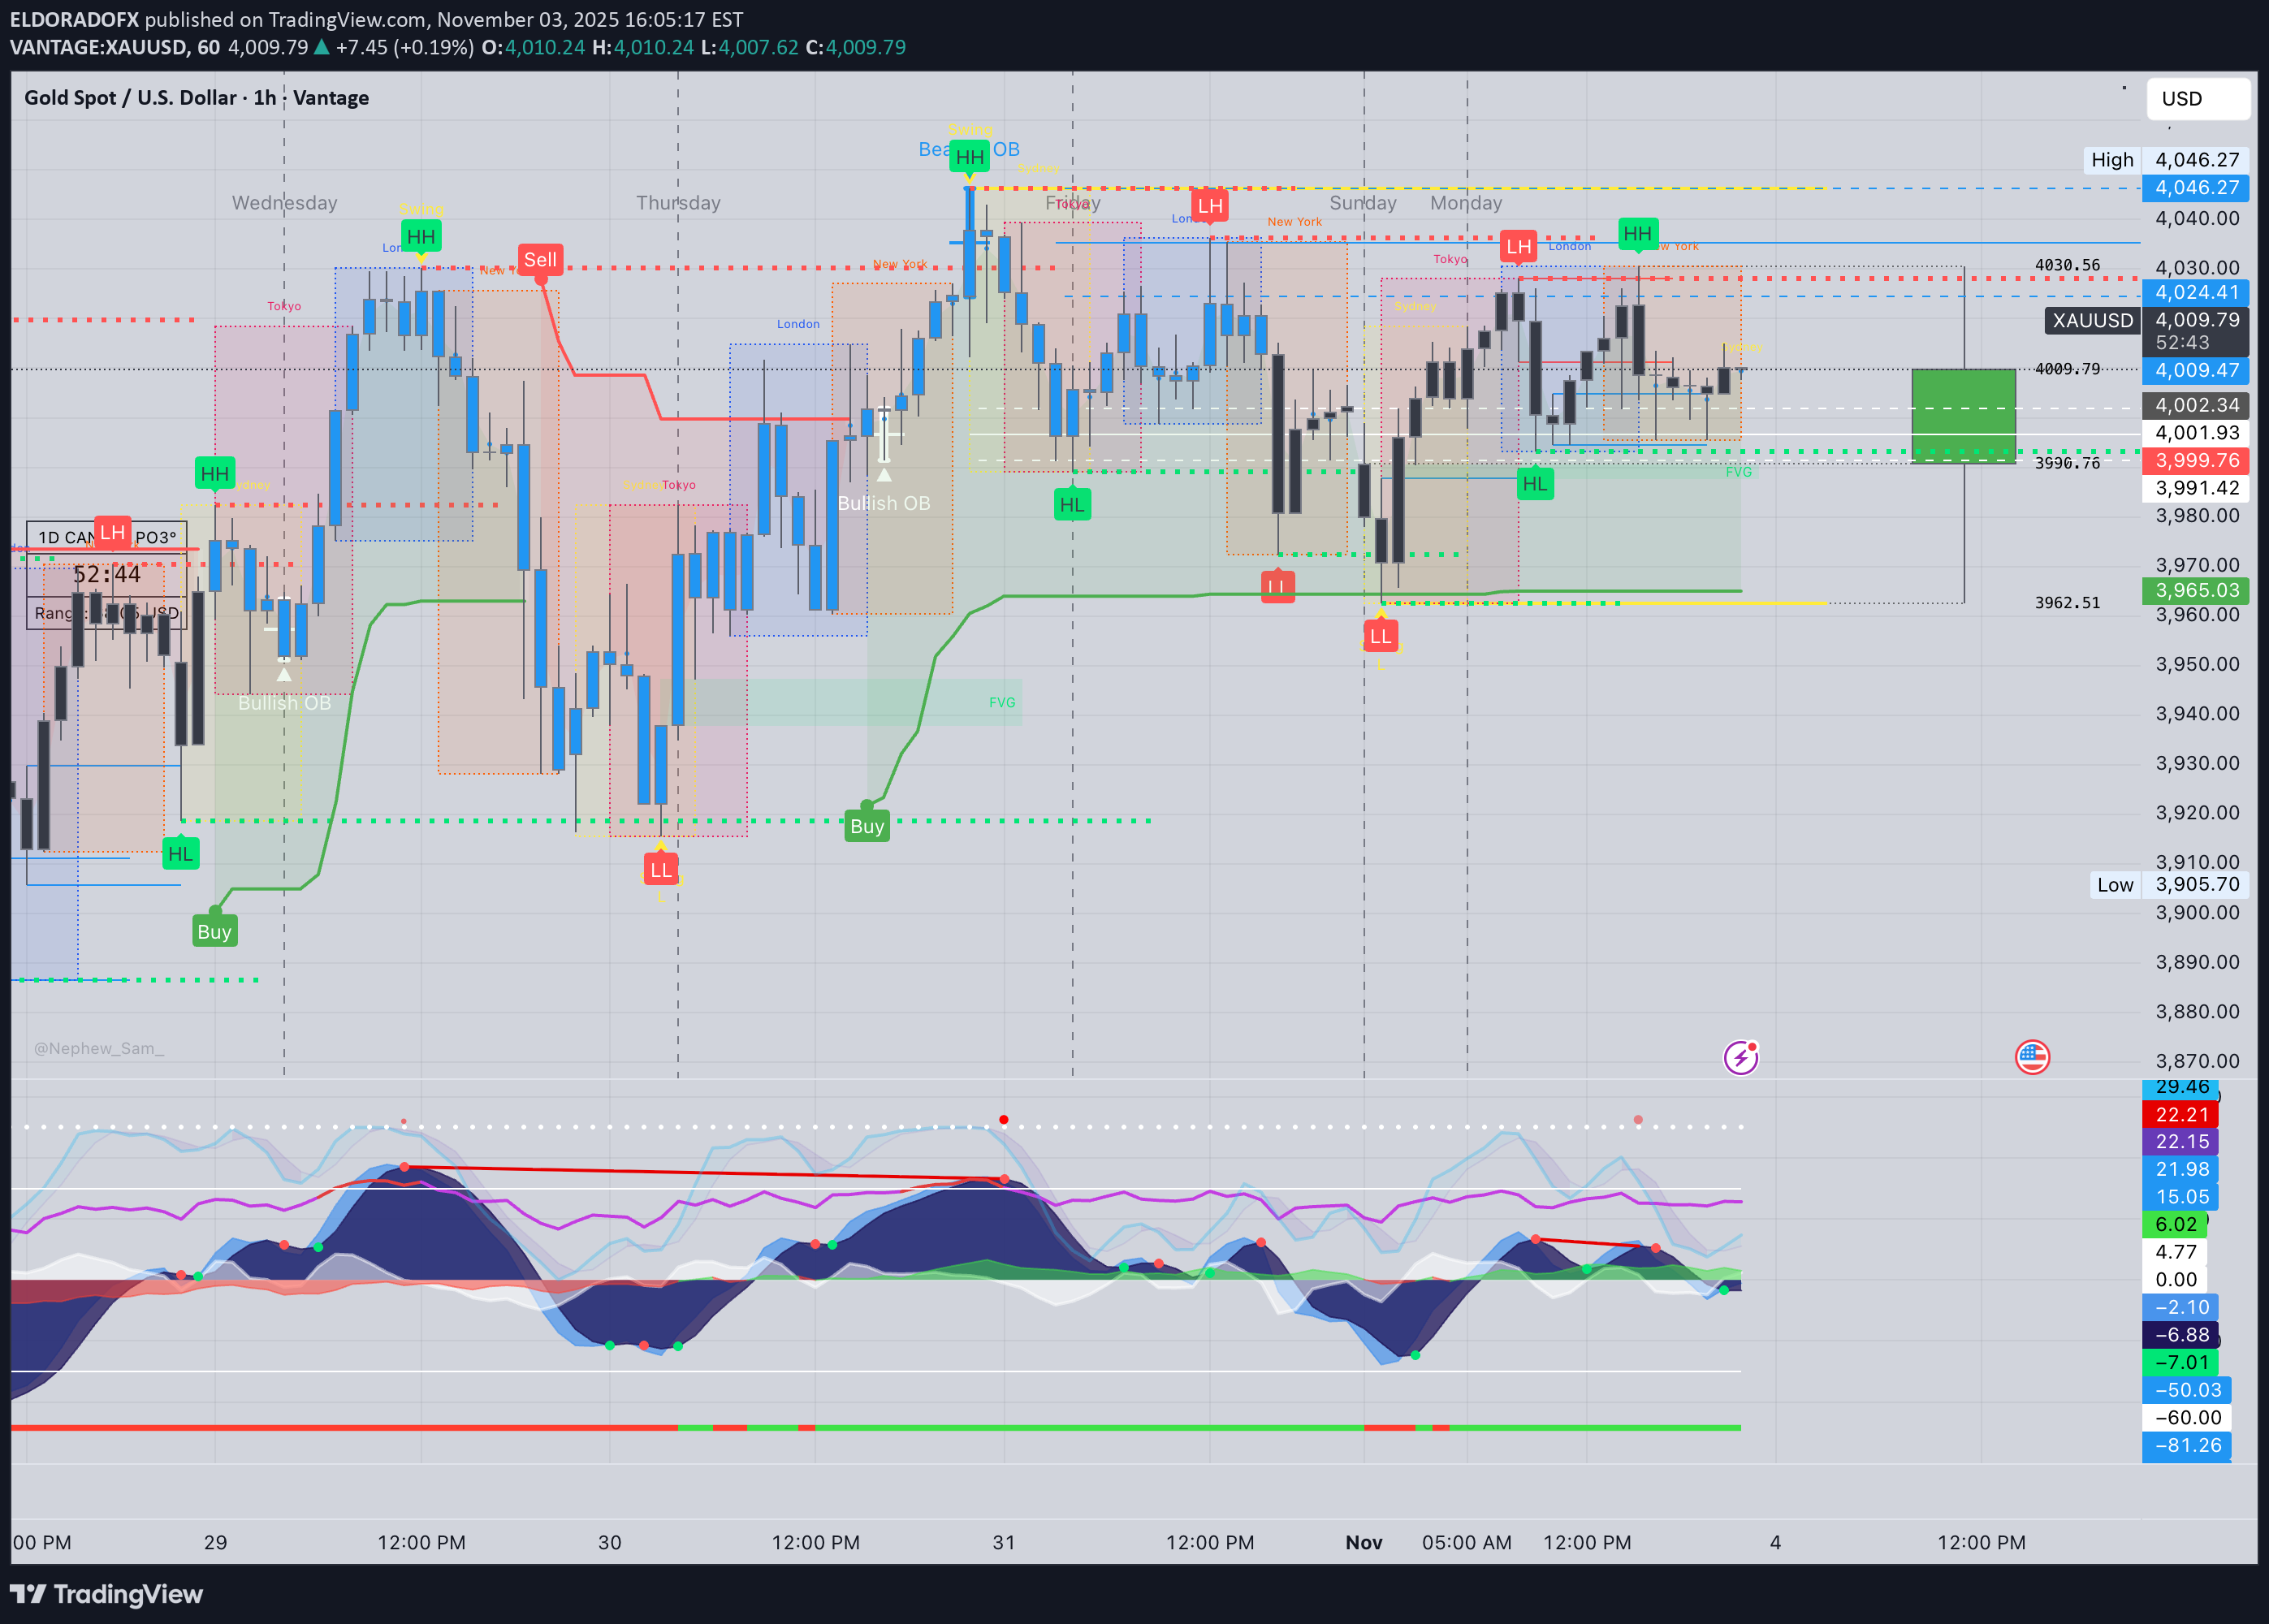
تحلیل طلا: طلای داغ در مسیر 4046 دلار؛ منطقه طلایی 3990 دلار را از دست ندهید!
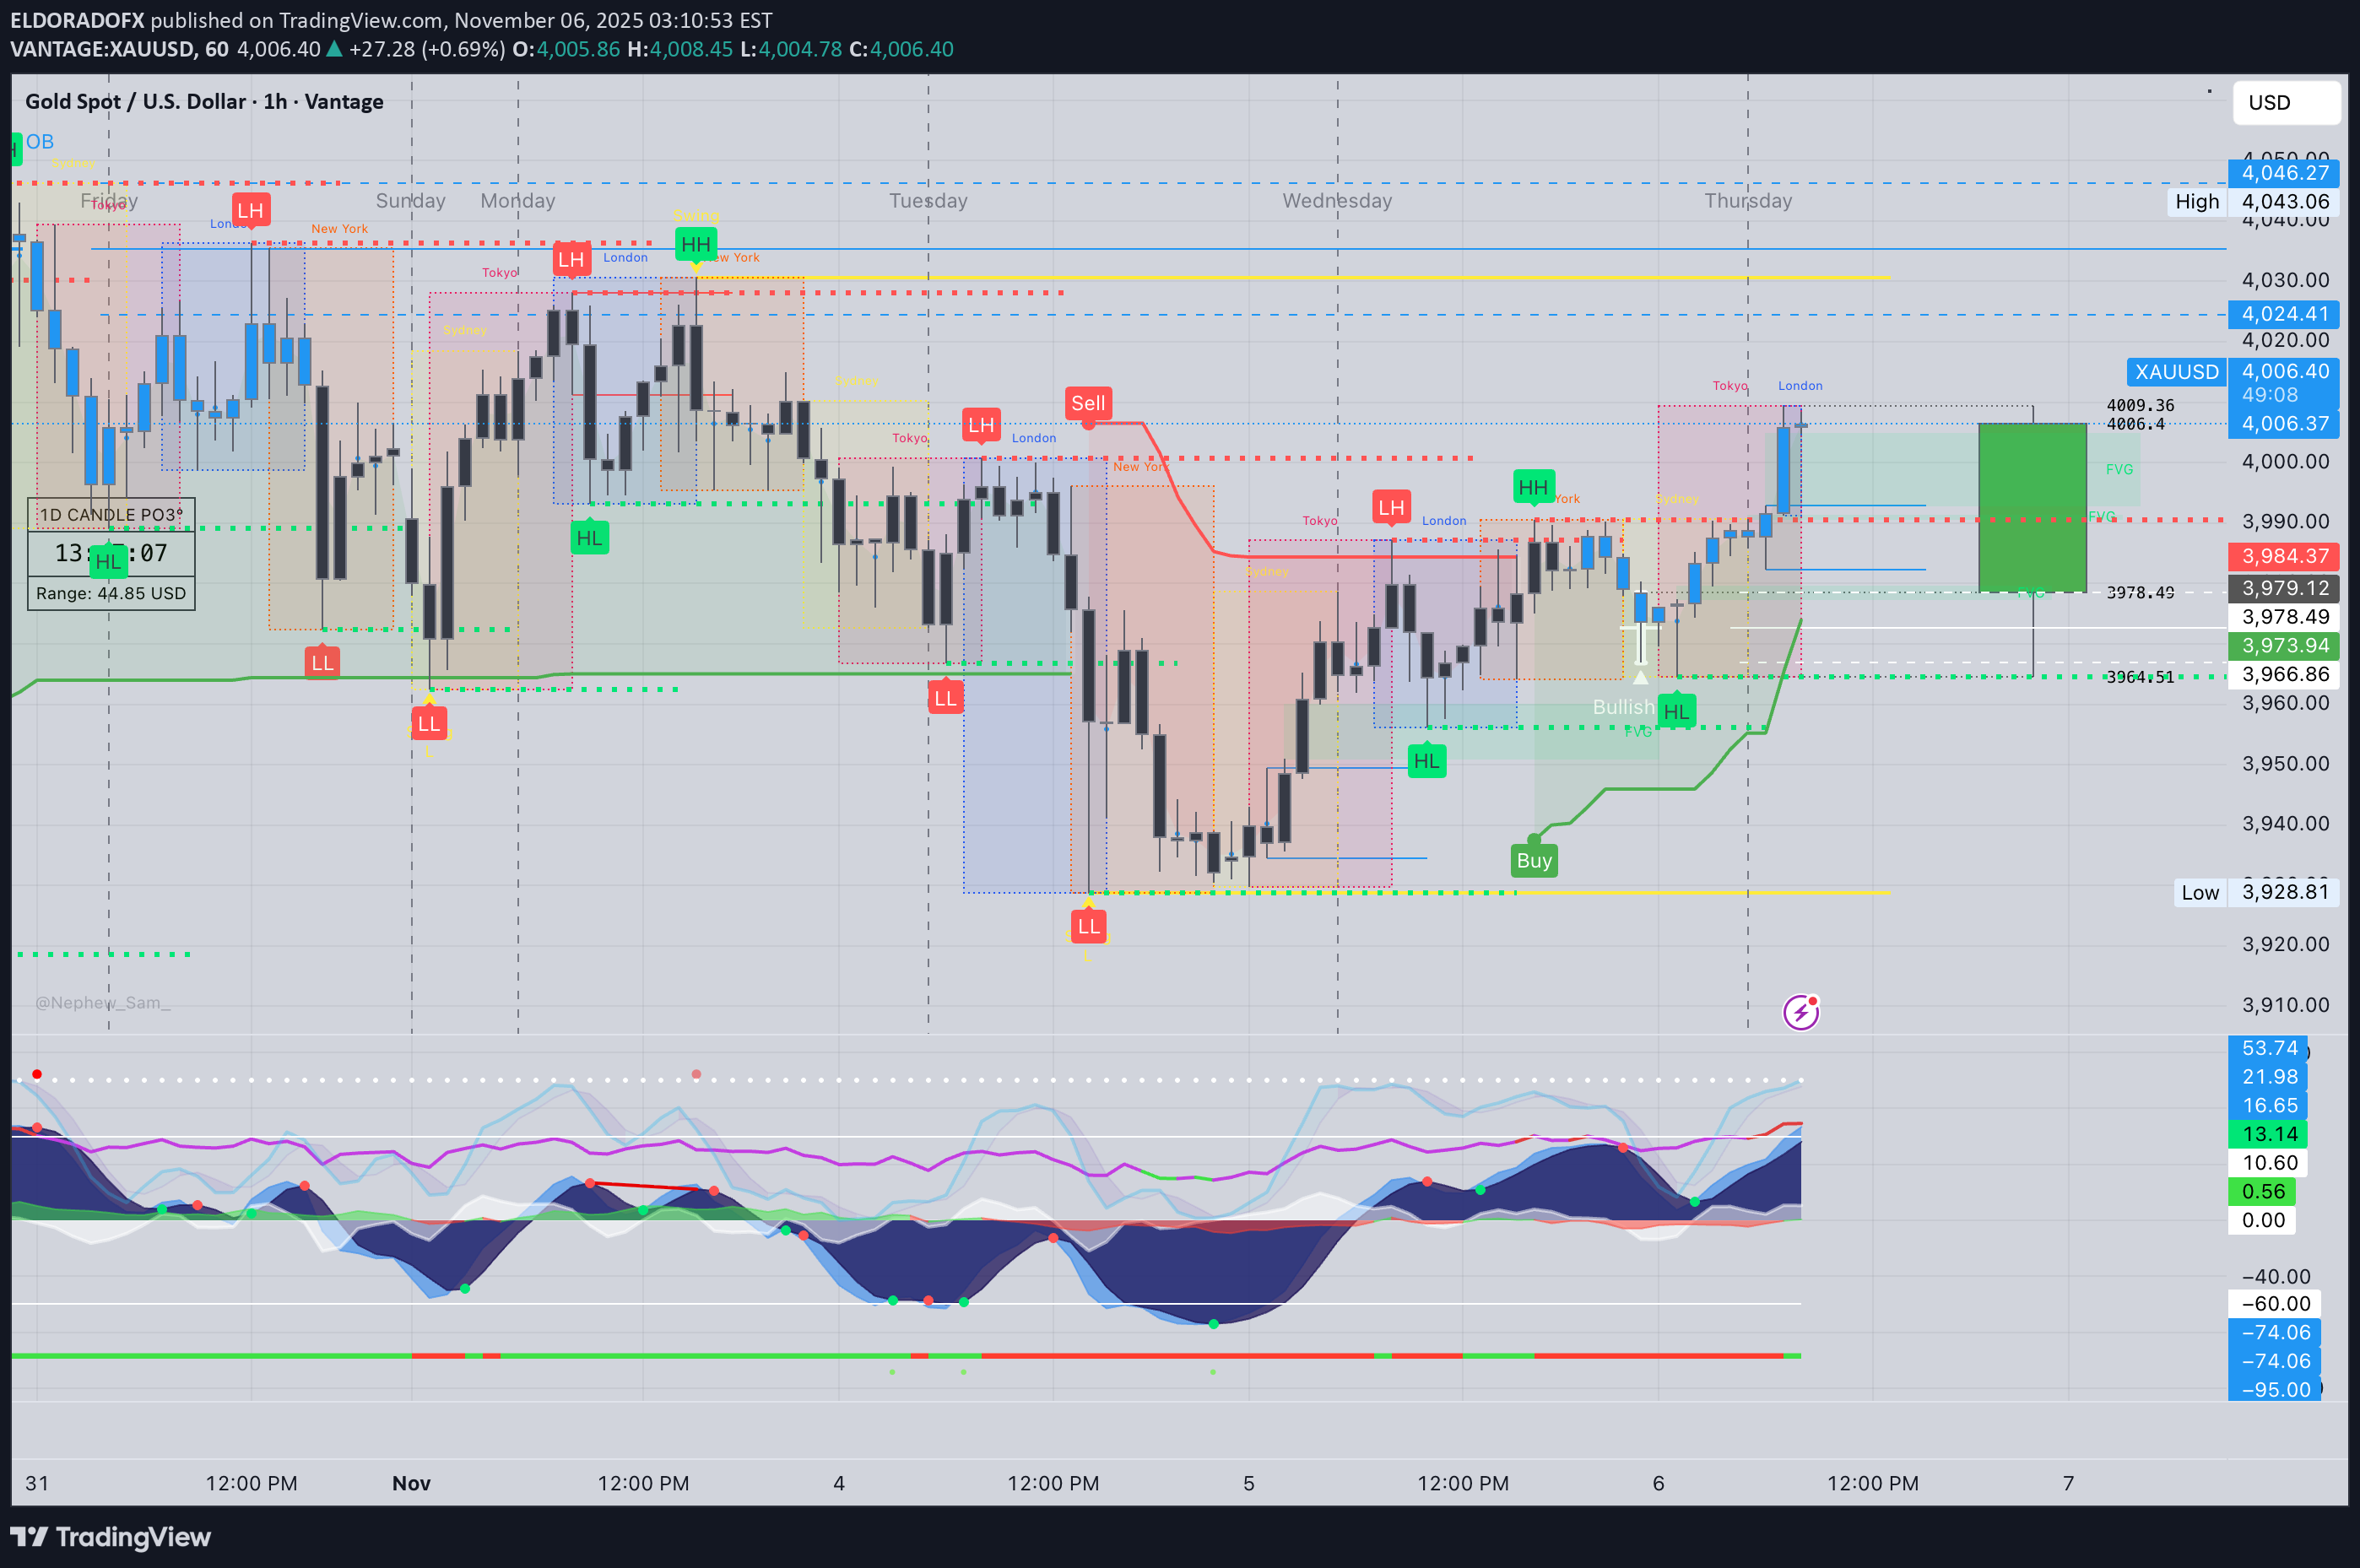
1️⃣ Market Overview Gold extends its bullish move into the London session after breaking above $3,995–$4,000, confirming short-term momentum shift from consolidation to continuation. The metal currently trades near $4,005, where sellers are reacting at a key H1 supply zone aligned with a descending trendline from previous highs. Overall sentiment remains cautiously bullish, with potential pullbacks expected before continuation toward $4,026–$4,046. ⸻ 2️⃣ Technical Breakdown 📆 D1 (Daily): Price sustains above the 100EMA and remains in an ongoing bullish recovery phase. RSI ≈ 52, showing neutral-to-bullish structure. A confirmed daily close above $4,012 would strengthen the path to $4,026–$4,046 next. ⏰ H1 (Hourly): Strong breakout candle above $3,995 with MACD turning positive. Current resistance seen around $4,010–$4,015. RSI near 68 signals slight overextension, hinting that a minor pullback could occur before another push upward. 🕒 15M–5M (Intraday): Price broke through descending structure and is now forming rejections near $4,010. Short-term support sits between $3,985–$3,975, coinciding with EMAs and structure demand. Expect a possible retest of this area for continuation if buyers remain in control. ⸻ 3️⃣ Fibonacci Analysis (Last swing $3,960 → $4,010) •38.2% = $3,990 •50.0% = $3,985 •61.8% = $3,979 🎯 Golden Zone: $3,990 – $3,979 → Potential bullish continuation area. ⸻ 4️⃣ Fundamental Watch •The US Dollar Index (DXY) is holding below 106, favoring gold’s strength. •US Jobless Claims and Fed speeches later today may inject volatility during the NY session. •London is likely to trade inside the $3,985–$4,010 band until new catalysts emerge. ⸻ 5️⃣ Analyst Summary Gold maintains an intraday bullish bias while trading above $3,975. The ideal scenario is a pullback toward $3,990–$3,979 (Golden Zone) before the next impulsive move up. A sustained break above $4,015 would confirm fresh momentum targeting $4,026 → $4,046, while failure to hold above $3,975 could shift bias back toward $3,960. ⸻ 6️⃣ Final Bias Summary 📈 Primary Bias: Bullish continuation above $3,975 📉 Bearish Invalidity: Below $3,970 🎯 Upside Targets: $4,026 → $4,046 → $4,075 ⚠️ Key Zone to Watch: $3,990 – $3,979 (Golden Zone retest area) ⸻ — ElDoradoFx PREMIUM 3.0 Team 🚀
پیشبینی طلا (XAUUSD): نوسانات بازار آسیا و سطوح حیاتی حمایت و مقاومت
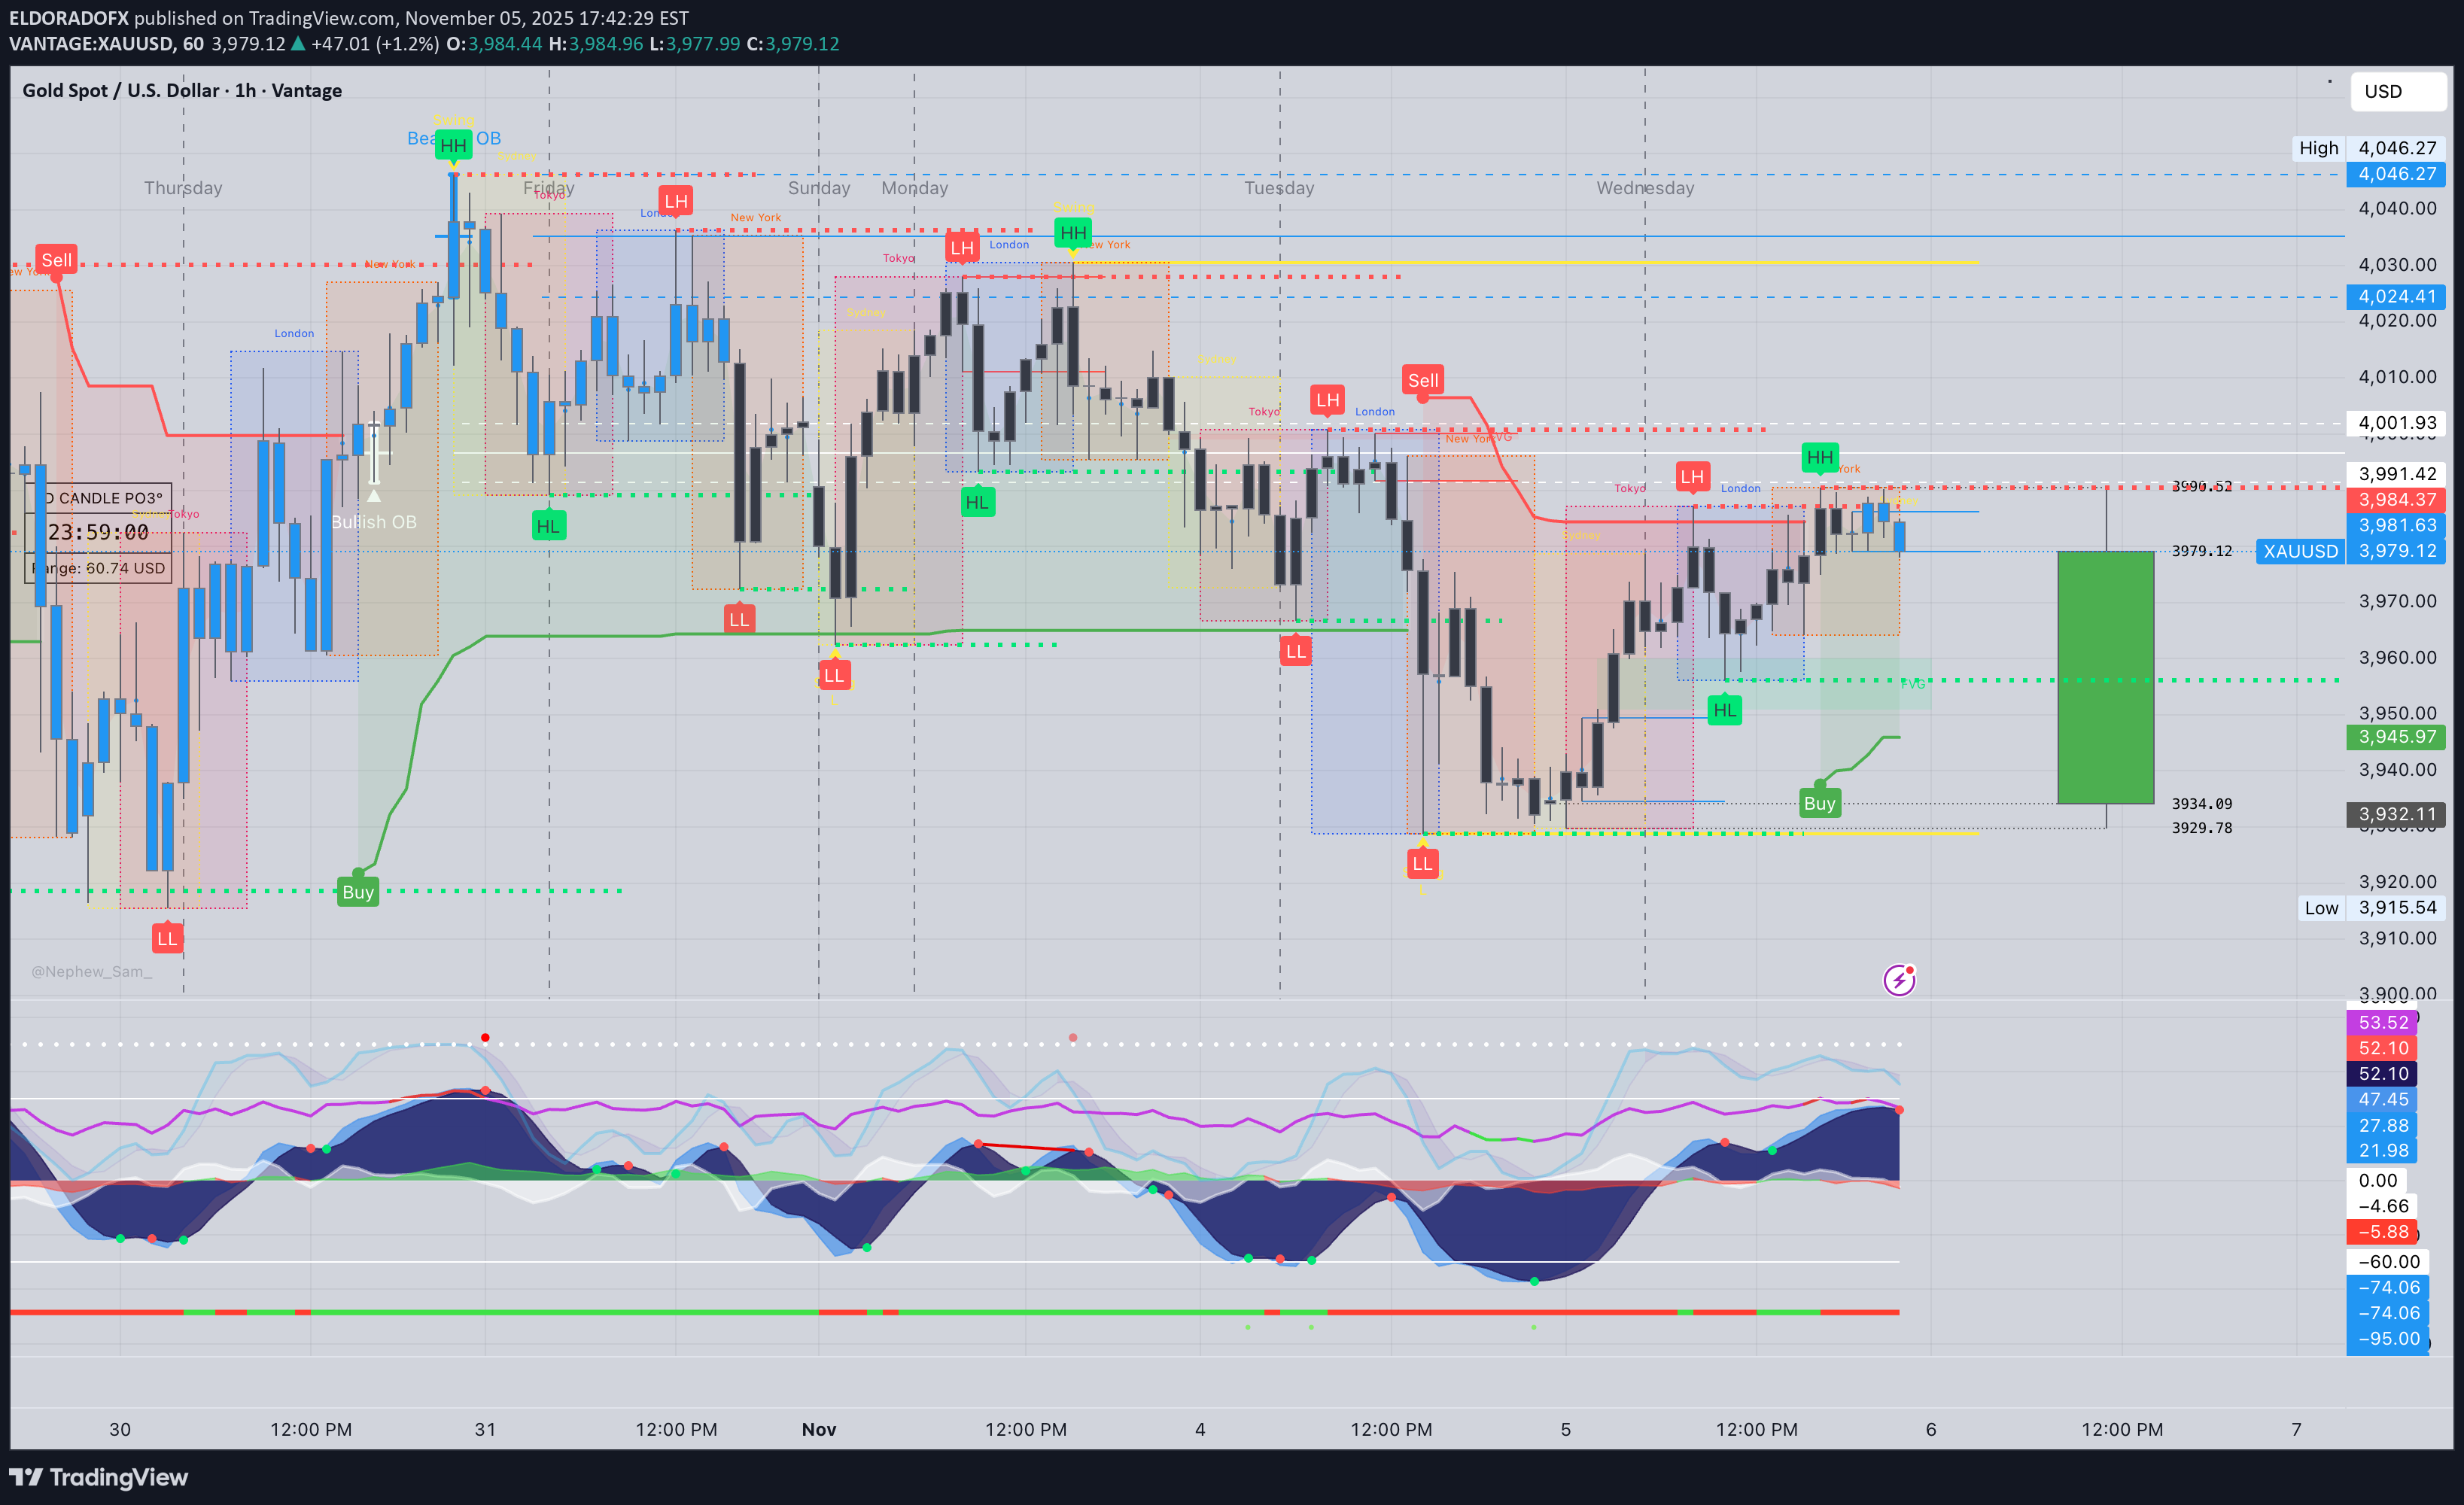
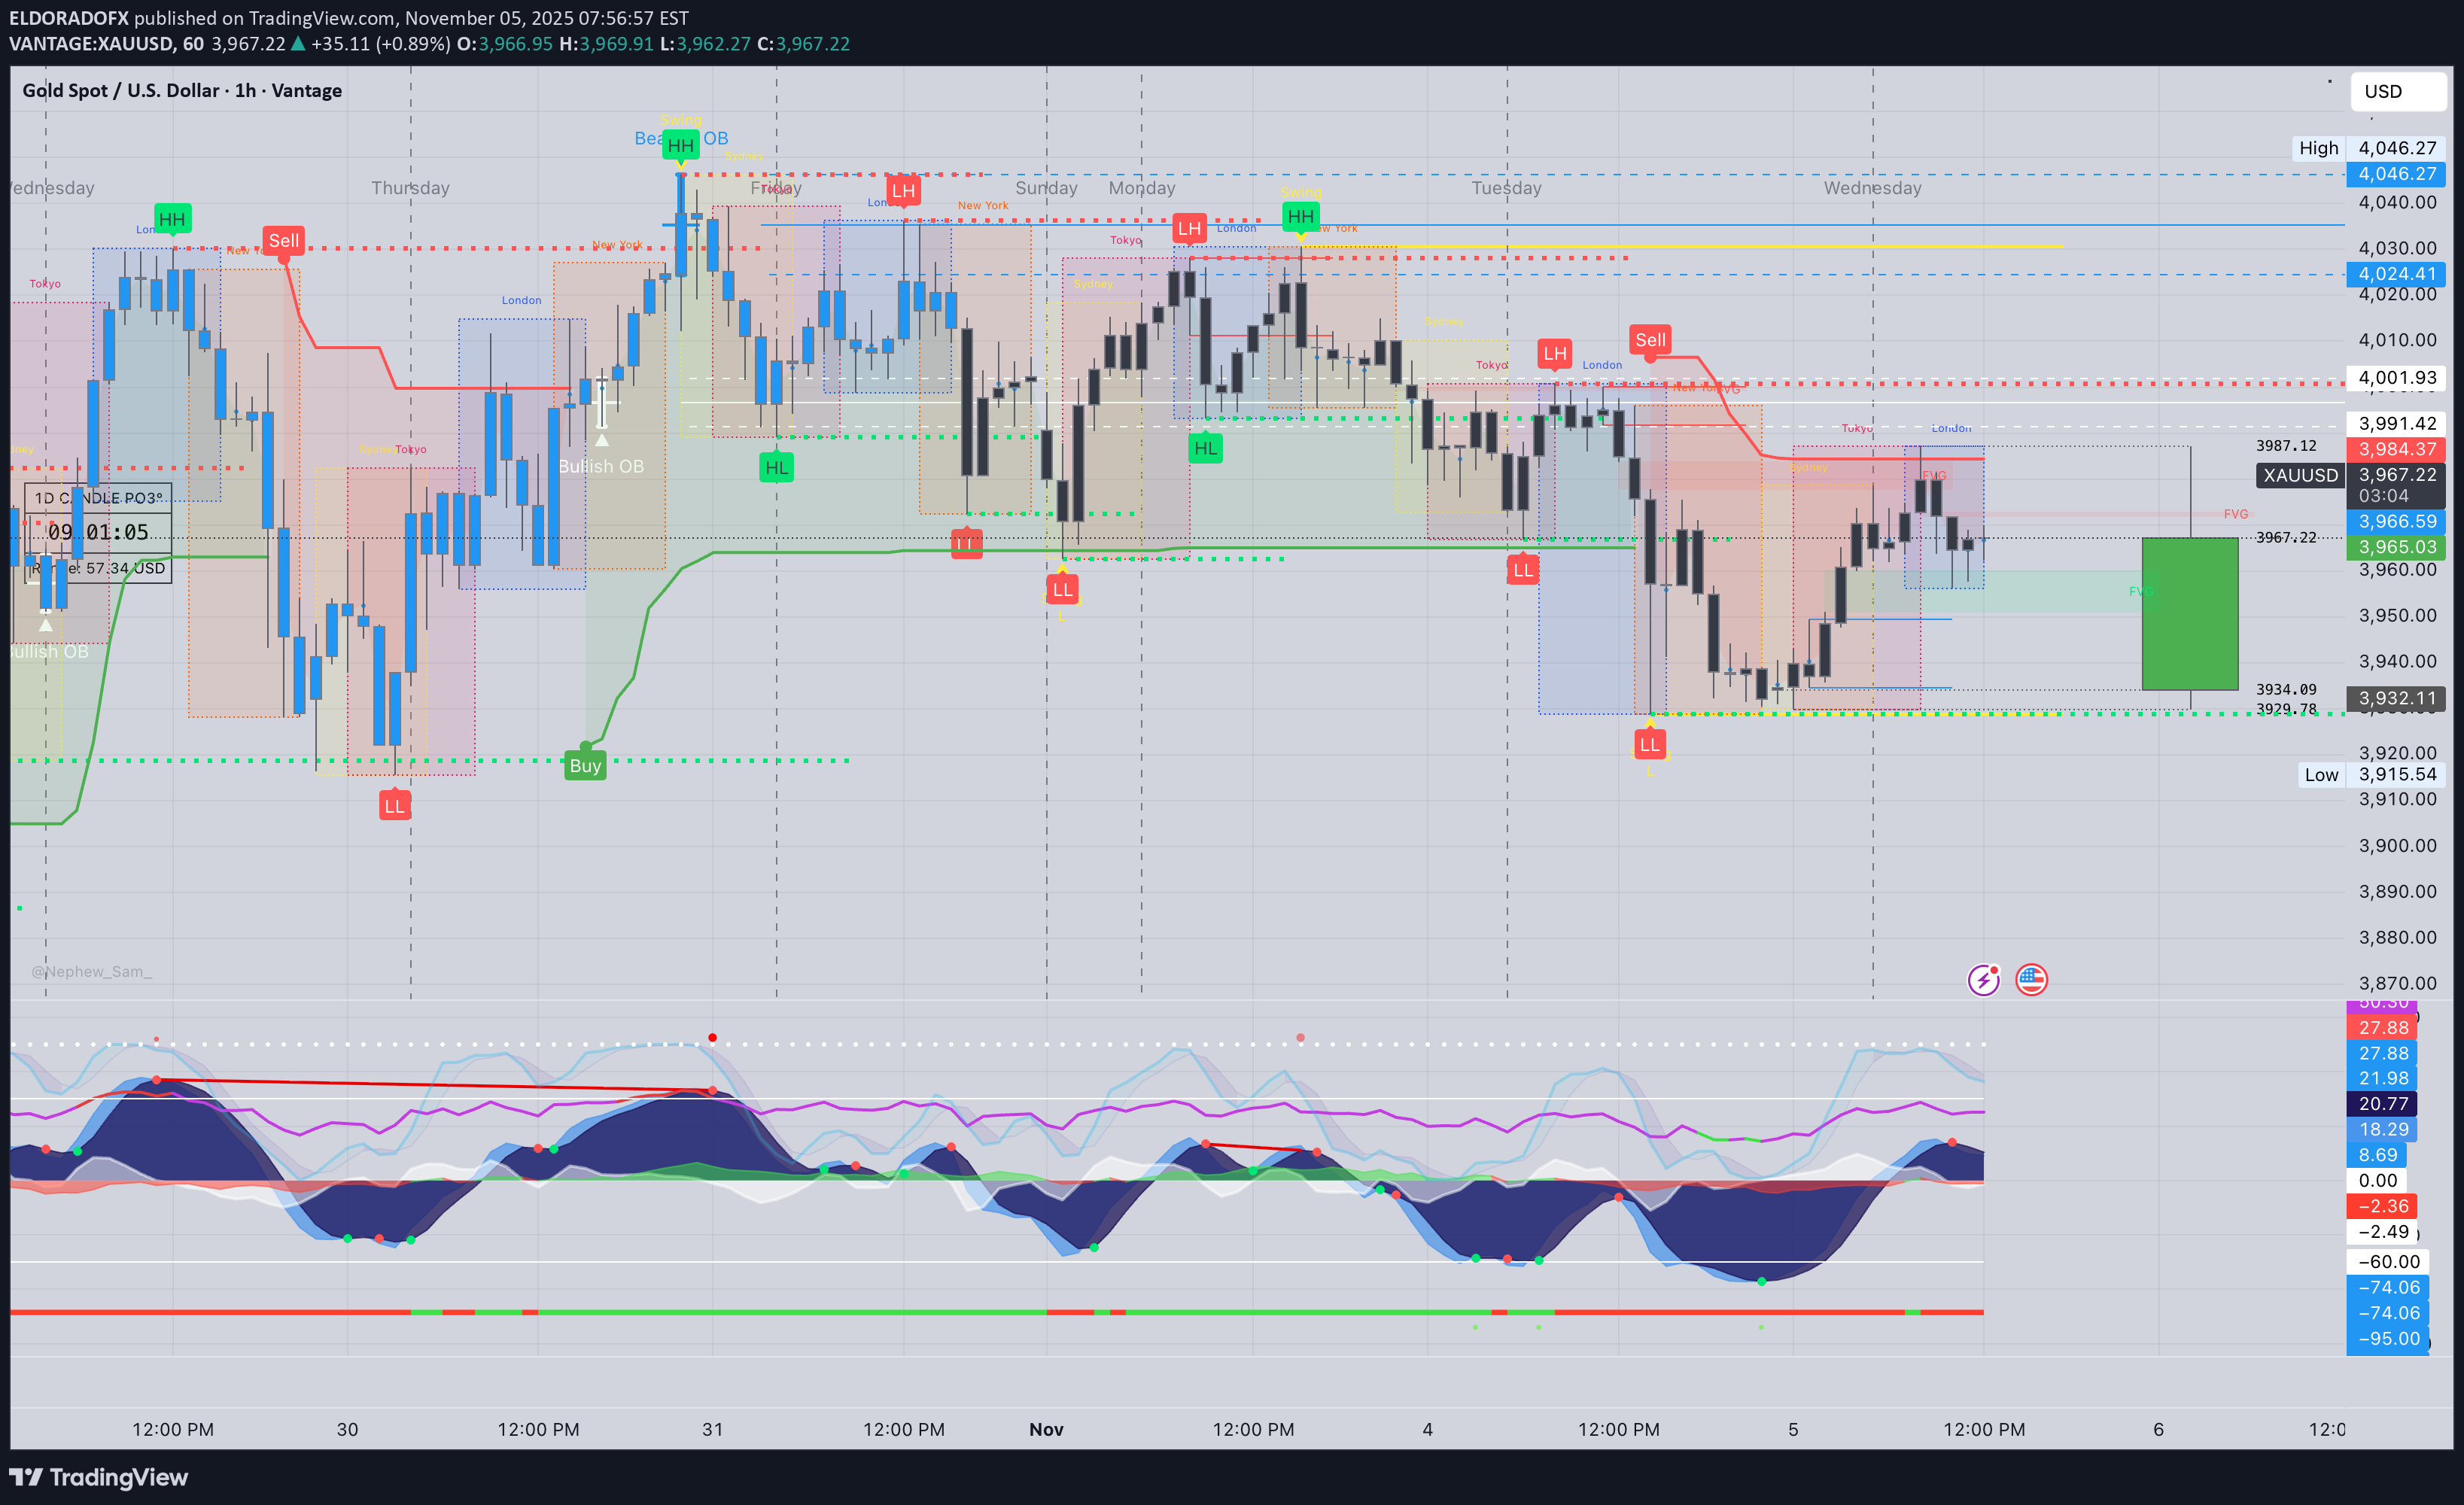
1️⃣ Market Overview Gold begins the Asia session around $3,979, showing mild weakness after repeated rejections from the $3,985–$3,990 supply zone. The metal remains trapped within a descending channel formed from the $4,046 swing high, but buyers are still defending the ascending trendline from $3,928. This setup suggests the market is coiling ahead of a potential breakout, likely during the Asia–London overlap. ⸻ 2️⃣ Technical Breakdown 🔹 Daily (D1) Gold maintains a neutral stance, holding above the 100 EMA ($3,870) but still below the 10 EMA ($3,995). RSI sits near 49, showing equilibrium between buyers and sellers. A daily close above $3,990 could reignite bullish pressure toward $4,015–$4,046, while a drop under $3,955 would open downside continuation toward $3,930–$3,915. 🔹 1H Chart The 1H structure remains bearish-to-neutral, with lower highs under the descending trendline. MACD momentum is flattening, while RSI near 46 signals loss of bullish drive. Intraday support aligns at $3,973–$3,960, with resistance between $3,985–$3,990. 🔹 15M–5M The short-term structure shows a minor BOS (Break of Structure) below trendline support. Repeated wicks around $3,978–$3,975 indicate growing selling pressure. MACD turning red and RSI rolling over from 55 confirm the fading momentum before Asia volatility pickup. ⸻ 3️⃣ Fibonacci Analysis (Last swing: 3,928 → 3,990) •38.2% = 3,966 •50.0% = 3,959 •61.8% = 3,952 🎯 Golden Zone: 3,966 – 3,952 This is a potential intraday demand zone for countertrend bounces if confirmed with volume. ⸻ 4️⃣ High-Probability Trade Scenarios 📈 BUY SCENARIO (Countertrend Rebound) •Entry Zone: 3,966 – 3,952 (Fibonacci Golden Zone) •Targets: 3,975 → 3,985 → 3,990 → 4,010 •Stop Loss: Below 3,947 •Confirmation: Bullish CHoCH or engulfing pattern on 5M–15M within zone. 📉 SELL SCENARIO (Main Bias) •Entry Zone: 3,985 – 3,990 (Supply + trendline resistance) •Targets: 3,975 → 3,960 → 3,940 •Stop Loss: Above 4,000 •Confirmation: Rejection candle or RSI divergence >65. 💥 Breakout SELL Setup •Trigger: Break & close below 3,970 •Retest Zone: 3,973–3,975 •Targets: 3,955 → 3,940 → 3,915 •Stop Loss: Above 3,985 ⸻ 5️⃣ Fundamental Watch •Asian session: Low liquidity, but early positioning ahead of US Jobless Claims may start to build. •DXY holding above 106 maintains short-term downside pressure on gold. •Fed members’ comments later today could inject volatility into metals. ⸻ 6️⃣ Key Technical Levels •Resistance: 3,985 / 3,990 / 4,010 / 4,026 •Support: 3,973 / 3,960 / 3,952 / 3,940 •Golden Zone: 3,966 – 3,952 •Break Sell Trigger: < 3,970 •Break Buy Trigger: > 4,000 ⸻ 7️⃣ Analyst Summary Gold is consolidating inside a tight compression wedge, with bears defending the 3,985–3,990 area. As long as 3,970 holds, price remains in equilibrium. However, a confirmed breakdown below 3,970 could accelerate bearish continuation toward 3,955–3,940. Conversely, only a clean break above 4,000 would confirm short-term bullish reversal. ⸻ 8️⃣ Final Bias Summary 📉 Primary Bias: Bearish below 3,985 → targeting 3,960 – 3,940. 📈 Alternative Bias: Bullish breakout above 4,000 → targeting 4,015 – 4,046. ⸻ 🥇 ElDoradoFx PREMIUM 3.0 – PERFORMANCE 05/11/2025 🥇 📊 Flawless precision | GOLD & BTC domination. ━━━━━━━━━━━━━━━ 🪙 XAU/USD (GOLD) 🔻 SELL +40 PIPS 🟢 BUY LIMIT +20 PIPS 🟢 BUY LIMIT +60 PIPS 🔻 SELL +60 PIPS 🟢 BUY +40 PIPS 🟢 BUY +260 PIPS 🔻 SELL +80 PIPS 🟢 BUY +110 PIPS 💰 GOLD TOTAL: +670 PIPS ━━━━━━━━━━━━━━━ 📱 BTC/USD TRADES 🚀 SELL +900 PIPS 💸 BTC TOTAL: +900 PIPS ━━━━━━━━━━━━━━━ 📊 COMBINED DAILY PROFIT: +1,570 PIPS ✅ 9 Trades → 9 Wins | 0 SL | 0 BE 🎯 Accuracy: 100% ━━━━━━━━━━━━━━━ 🔥 Both GOLD and BTC delivered textbook setups today — high accuracy, clear structure, and strong risk control. 👏 Congratulations if you profited! ✅✅✅🚀🚀🚀
تحلیل طلای امروز: آیا طلا به ۴۰۰۰ دلار میرسد؟ (راهنمای معاملاتی جلسه آمریکا)
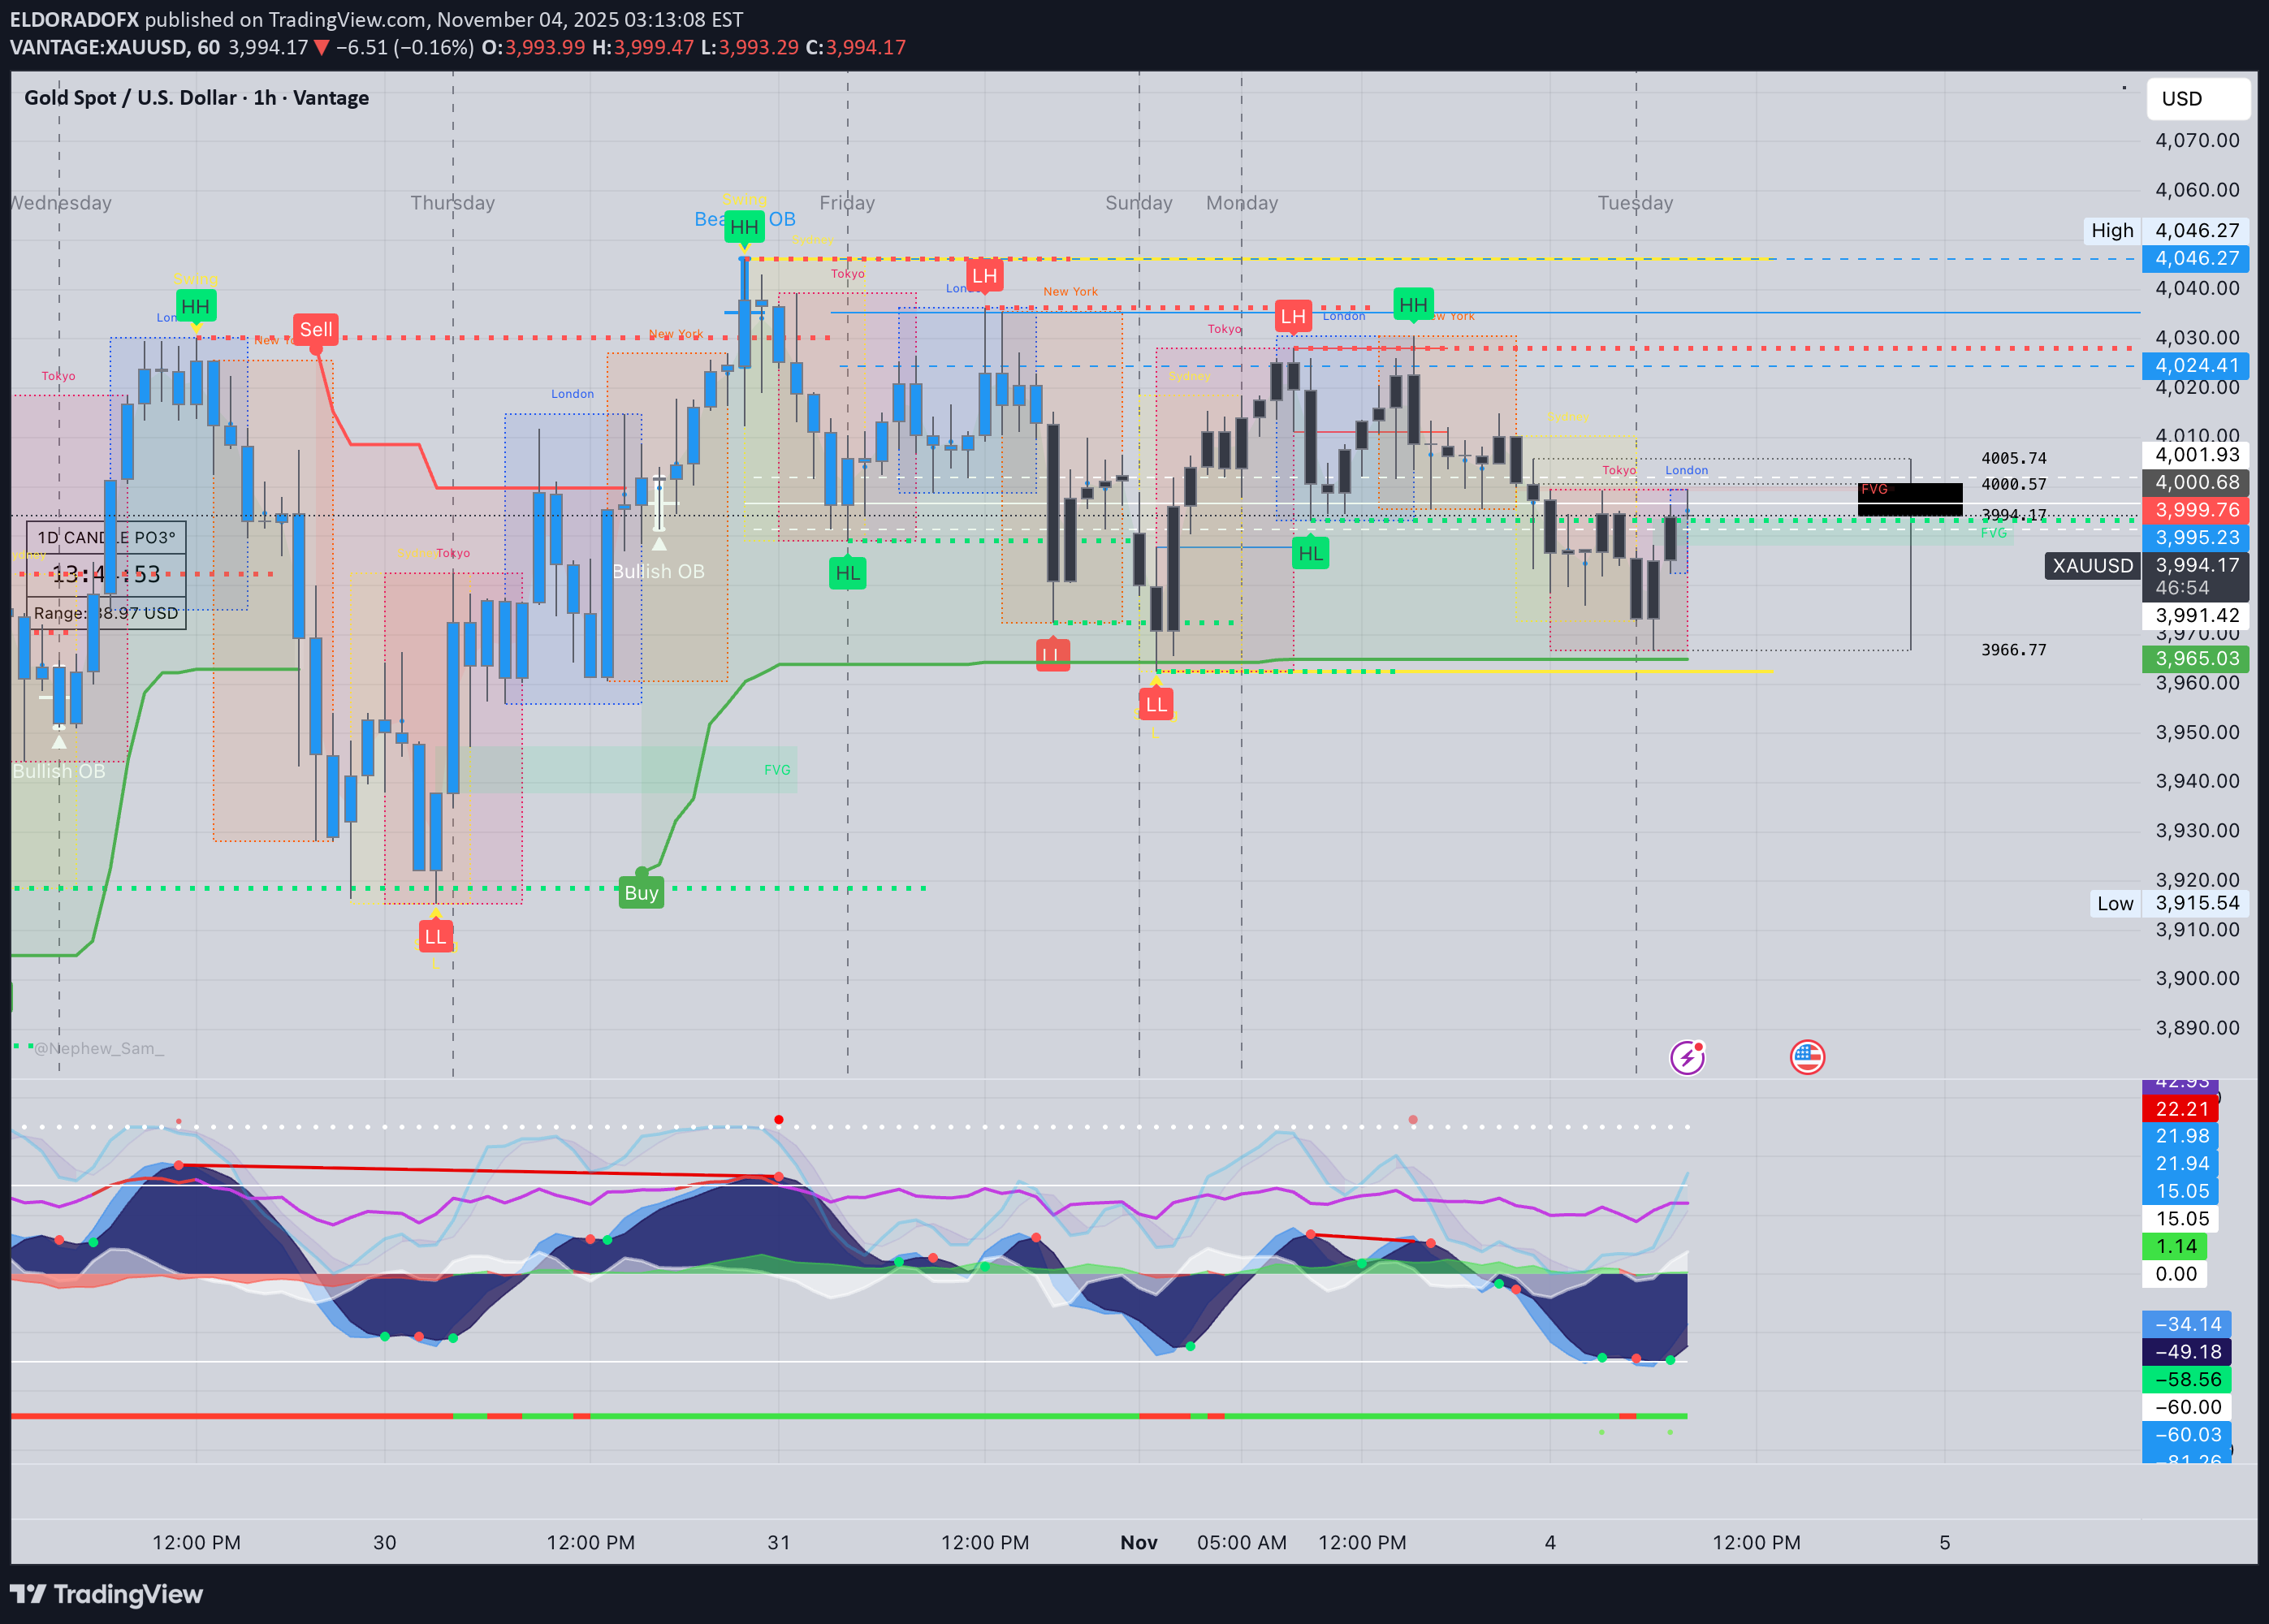
1️⃣ Market Overview Gold holds steady around $3,965, consolidating after yesterday’s rebound from $3,932 lows. The US session opens ahead of ADP Employment and ISM Services PMI, which are likely to drive volatility. The current price remains in a mid-term corrective phase after the sharp rally to $4,100, and sentiment leans mildly bullish as long as the $3,950 support remains intact. ⸻ 2️⃣ Technical Breakdown • Daily (D1): Gold continues its pullback after the rejection from $4,100, forming higher lows above $3,870 (100 EMA). RSI at 48 shows neutral-to-slight bullish momentum; no bearish divergence visible. • H1: Structure is consolidative between $3,950 – $3,975 with resistance at 200 EMA and ascending trendline support beneath. Bulls are defending the trendline successfully so far. • 15M–5M: Short-term compression forming a potential bullish breakout setup. MACD shows a flattening histogram with early signs of momentum reactivation to the upside. ⸻ 3️⃣ Fibonacci Analysis Last Swing: 3,987 → 3,928 •38.2% → 3,950 •50.0% → 3,957 •61.8% → 3,965 🎯 Golden Zone: 3,950 – 3,965 (active reaction area aligning with trendline & 100 EMA on 15M). ⸻ 4️⃣ High-Probability Trade Scenarios 📈 Buy Scenario (Main Bias) •Entry Zone: 3,950 – 3,965 (within the Golden Zone). •Targets: 3,975 → 3,990 → 4,010 → 4,045 •Stop Loss: Below 3,940 •Confirmation: 15M bullish engulfing, RSI > 60, and MACD crossover to positive. 💥 Breakout Buy Setup •Trigger: Break and close above 3,975 •Retest Zone: 3,970 – 3,972 •Targets: 3,990 → 4,015 → 4,045 → 4,060 •Stop Loss: Below 3,960 ⸻ 📉 Sell Scenario (Countertrend) •Entry Zone: 3,975 – 3,990 (supply zone near 200 EMA). •Targets: 3,955 → 3,940 → 3,925 •Stop Loss: Above 3,995 •Confirmation: Bearish rejection candle or RSI divergence under 55. ⚡ Break & Retest Sell Setup •Trigger: Break below 3,940 •Retest Zone: 3,945 – 3,950 •Targets: 3,925 → 3,905 → 3,880 •Stop Loss: Above 3,960 ⸻ 5️⃣ Fundamental Watch •US ADP Non-Farm Employment Change – early indicator of Friday’s NFP. •ISM Services PMI – potential volatility driver for DXY and XAUUSD correlation. •Fed commentary and yield direction may influence session bias. ⚠️ High volatility expected during releases – avoid over-leveraging. ⸻ 6️⃣ Key Technical Levels TypeLevel (USD)Notes Resistance 13,975200 EMA + structure high Resistance 23,990Key supply & fib extension Support 13,955Intraday support Support 23,940Breakout validation point Trendline Support3,950Golden Zone confluence Breakout Triggers>3,975 / <3,940Defines session direction ⸻ 7️⃣ Analyst Summary Gold is currently compressing within the Golden Zone ahead of US data. Market bias remains bullish above 3,950, with the possibility of a breakout toward 4,000–4,015 if resistance breaks cleanly. A failure to hold above 3,950 will shift momentum short-term bearish toward 3,925 and below. ⸻ 8️⃣ Final Bias Summary 📊 BULLISH while above 3,950, targeting 3,990 – 4,015 🔻 BEARISH only if price breaks below 3,940, targeting 3,925 – 3,905 — ElDoradoFx PREMIUM 3.0 Team 🚀 ⸻
تحلیل طلای امروز: آماده سقوط به زیر 3900! (سیگنال فروش قدرتمند)
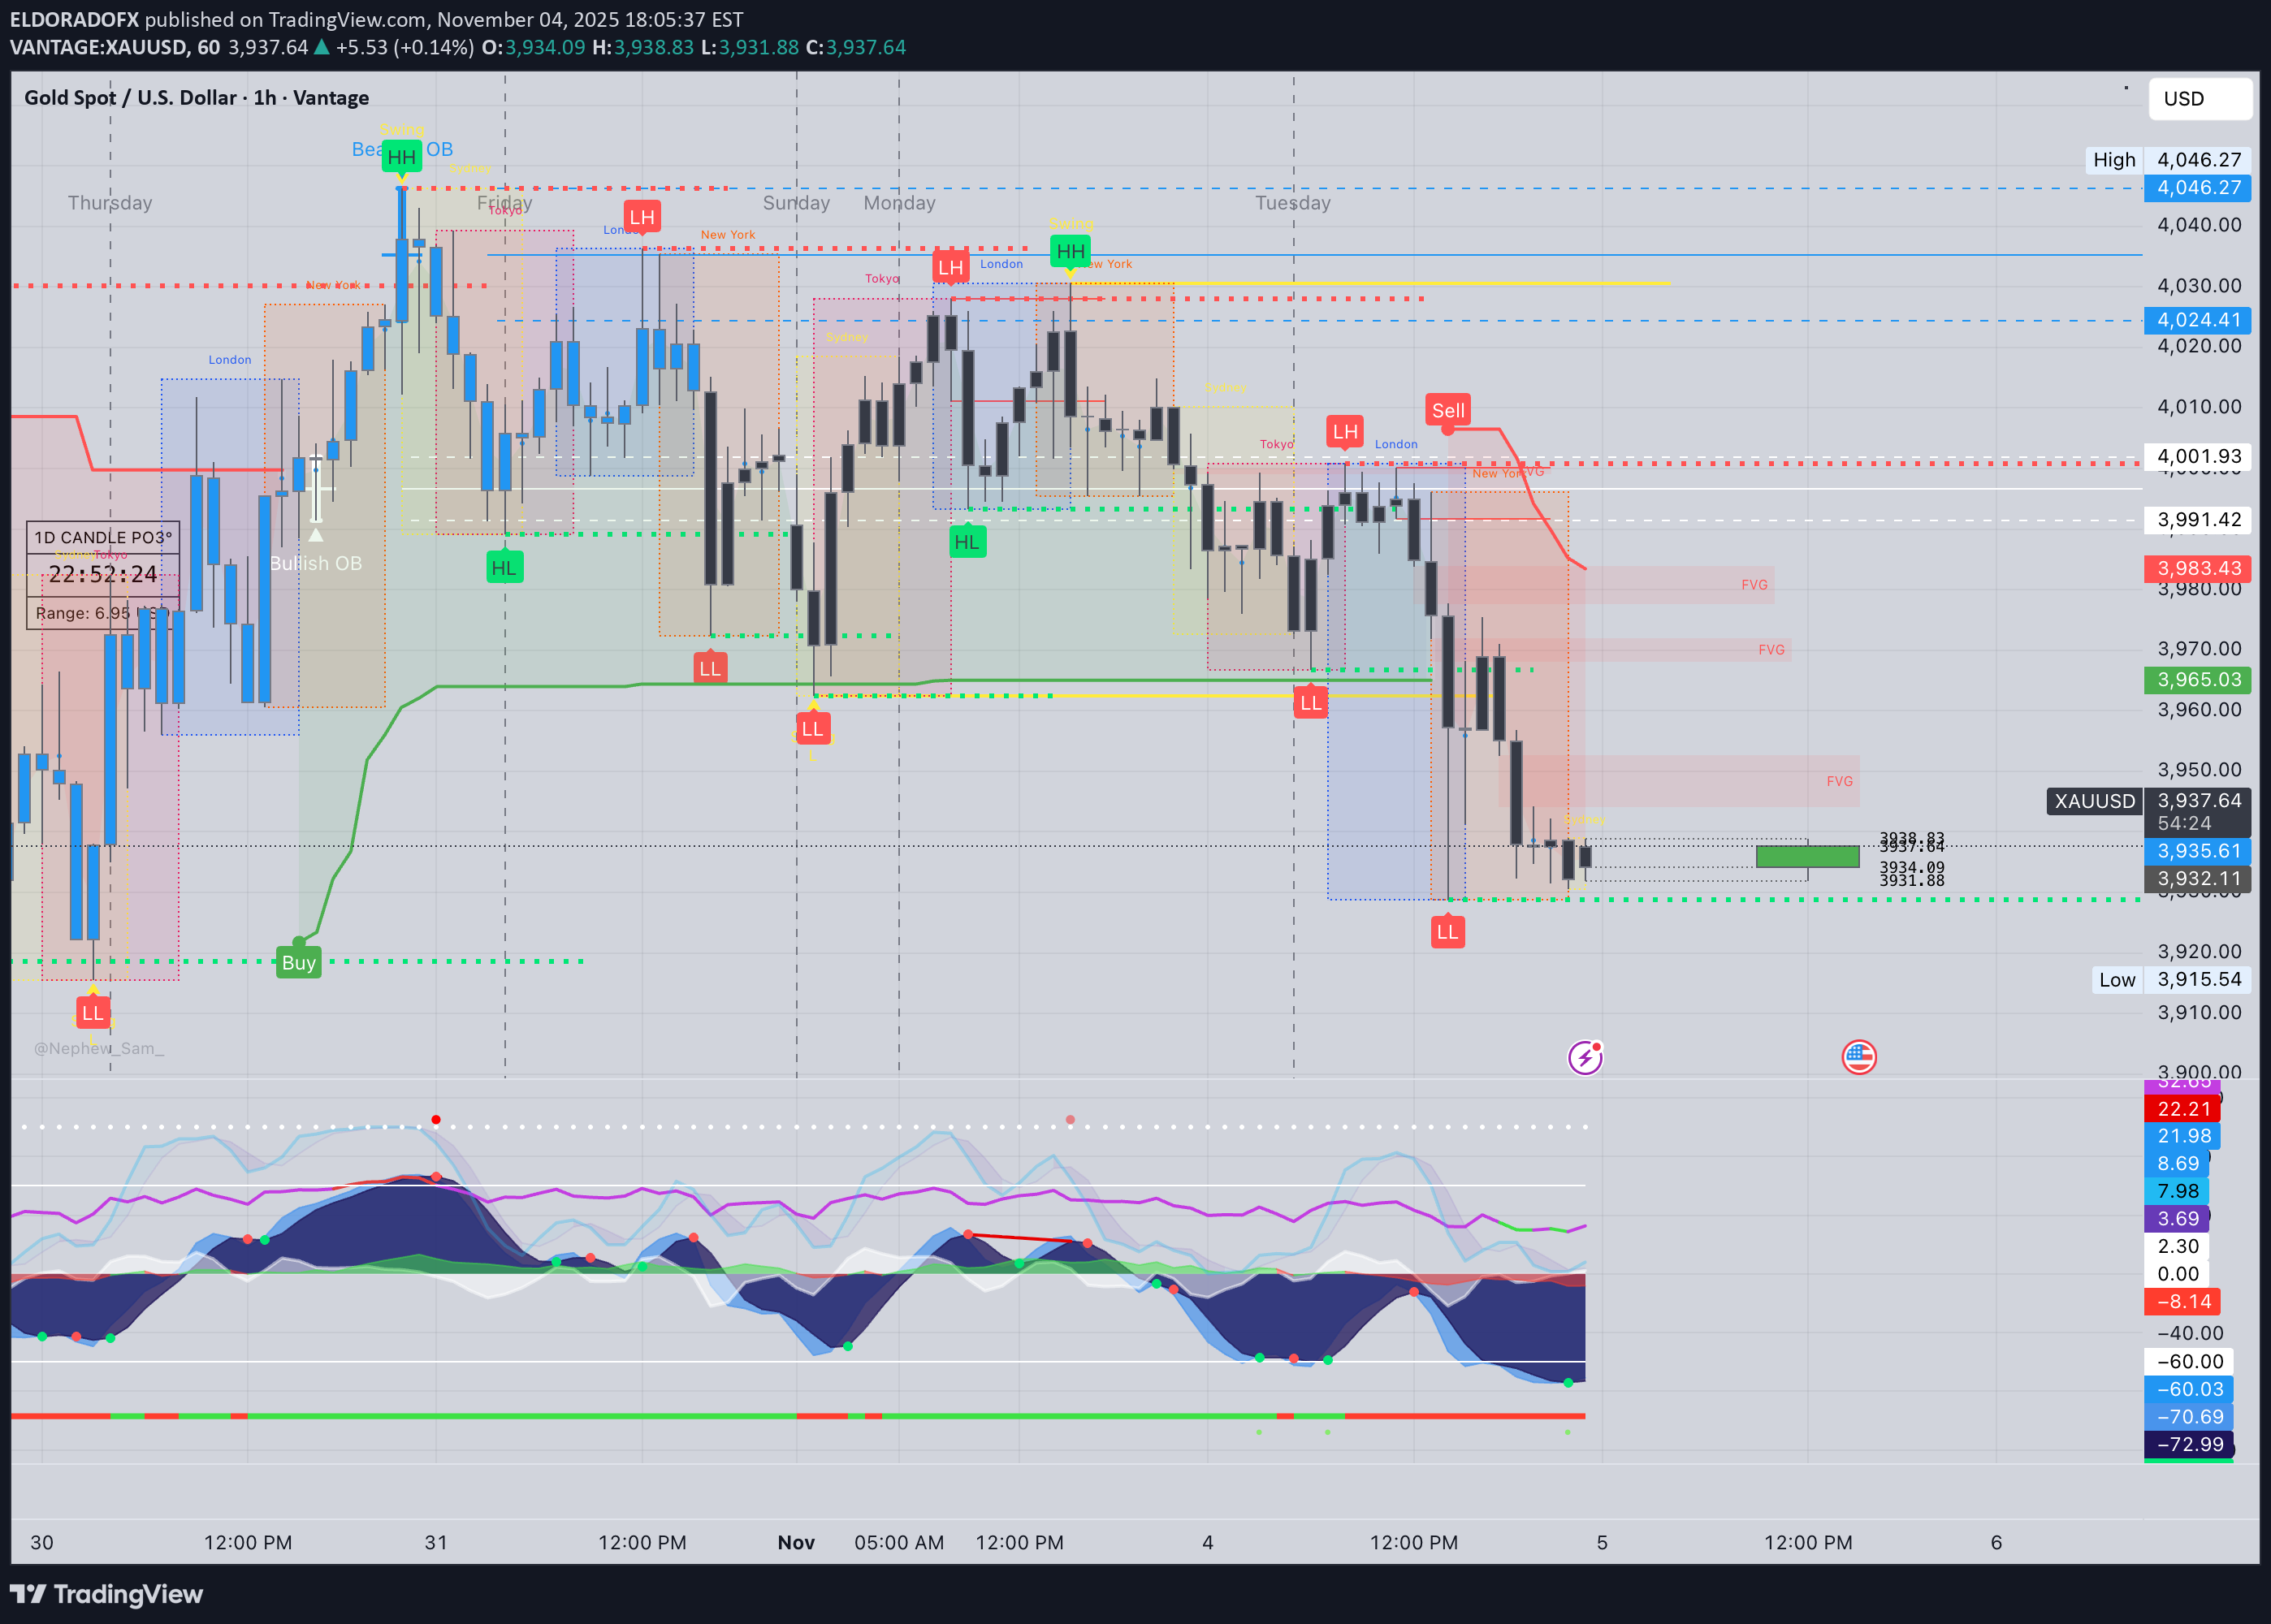
Gold closed the US session bearish at 3,932, extending its downside move under the descending trendline and rejecting from the key supply area at 3,953–3,960. The structure, momentum, and RSI alignment all confirm a continuation bias to the downside — the market remains in a controlled sell-off phase unless bulls reclaim 3,954 with volume. ⸻ 📊 Technical Outlook 🔹 D1: Gold is in the second leg of a corrective pullback after peaking at 4,046. The RSI at 46 and fading MACD histogram show room for continuation toward the 100EMA near 3,870. 🔹 H1: Price has consistently printed lower highs and lower lows. All EMAs (20 < 50 < 200) slope downward. The most recent break below 3,940 confirms renewed seller strength. 🔹 15M–5M: Consolidation inside a tight bearish channel, forming minor liquidity traps above 3,940–3,946 before further declines. Momentum is stable to the downside, with no bullish divergence detected. ⸻ ✨ Fibonacci Golden Zone (Swing 3,953 → 3,932) •38.2% = 3,940 •50.0% = 3,943 •61.8% = 3,946 🎯 Golden Zone: 3,940 – 3,946 (Rejection zone for re-entry shorts) ⸻ 🎯 High Probability Trade Setup (Chosen Bias: SELL) 📉 SELL SCENARIO (High Probability) ✅ Sell Entry Zone: 3,940 – 3,946 (Golden Zone retest) 🎯 Targets: 1️⃣ 3,925 2️⃣ 3,915 3️⃣ 3,900 4️⃣ Extended target 3,880 (swing projection) 🛑 Stop Loss: Above 3,954 ⚡ Confirmation: – Price rejection at 3,946 or bearish engulfing candle – RSI stays below 45 – MACD momentum bars remain red 💡 Rationale: Structure, EMAs, and momentum fully aligned to downside; the 3,940–3,946 area is a low-risk, high-probability retest before the next leg down. ⸻ 📈 BUY SCENARIO (Low Probability) ⚠️ Buy Zone: 3,910 – 3,900 (strong low zone / liquidity pool) 🎯 Targets: 3,932 → 3,940 🛑 Stop Loss: Below 3,890 ⚡ Only if: Strong bullish divergence forms with RSI <30 and MACD crossover. ⸻ 📰 Fundamental Watch •Asia: Low volatility expected early session; traders waiting for European cash flow. •DXY: Holding above 106 supports bearish gold momentum. •No major news, but volatility could spike from dollar liquidity flows ahead of midweek positioning. ⸻ 📌 Key Levels TypeLevelsNotes Resistance3,940 / 3,946 / 3,954Golden Zone / Rejection Area Support3,928 / 3,915 / 3,900Short-term targets Break Sell Trigger< 3,928Confirms continuation Break Buy Trigger> 3,954Invalidates bearish setup ⸻ ✅ Expert Summary (Final Bias) Gold remains in bearish continuation mode, with clean confluence between structure, EMAs, and momentum. 🎯 Expect short opportunities from 3,940–3,946 aiming toward 3,915–3,900. 📉 Bias: Bearish continuation until proven otherwise. ⸻ 🥇 ElDoradoFx PREMIUM 3.0 – PERFORMANCE 04/11/2025 🥇 📊 Live precision | Consistent gains. ━━━━━━━━━━━━━━━ 💎 GOLD RESULTS 🔻 SELL +20 PIPS 🟢 BUY LIMIT +70 PIPS 🔻 SELL +30 PIPS 🟢 BUY +20 PIPS 🟢 BUY +20 PIPS 🔻 SELL +240 PIPS --- ▶ LIVE TRADING SESSION 🔻 SELL +20 PIPS 🔻 SELL +20 PIPS 🔻 SELL +170 PIPS ━━━━━━━━━━━━━━━ 💰 TOTAL PIPS GAIN: +610 PIPS 📊 9 Trades → 9 Wins | 0 SL | 0 BE 🎯 Accuracy: 100% ✅ ━━━━━━━━━━━━━━━ 🔥 Clean, disciplined setups both pre-market and live. Another powerful session for our traders! 👏 Congratulations if you profited! ✅✅✅🚀🚀🚀
تحلیل تکنیکال بیت کوین (BTCUSD): ریزش سنگین و سطوح کلیدی فروش تا ۹۷,۰۰۰!
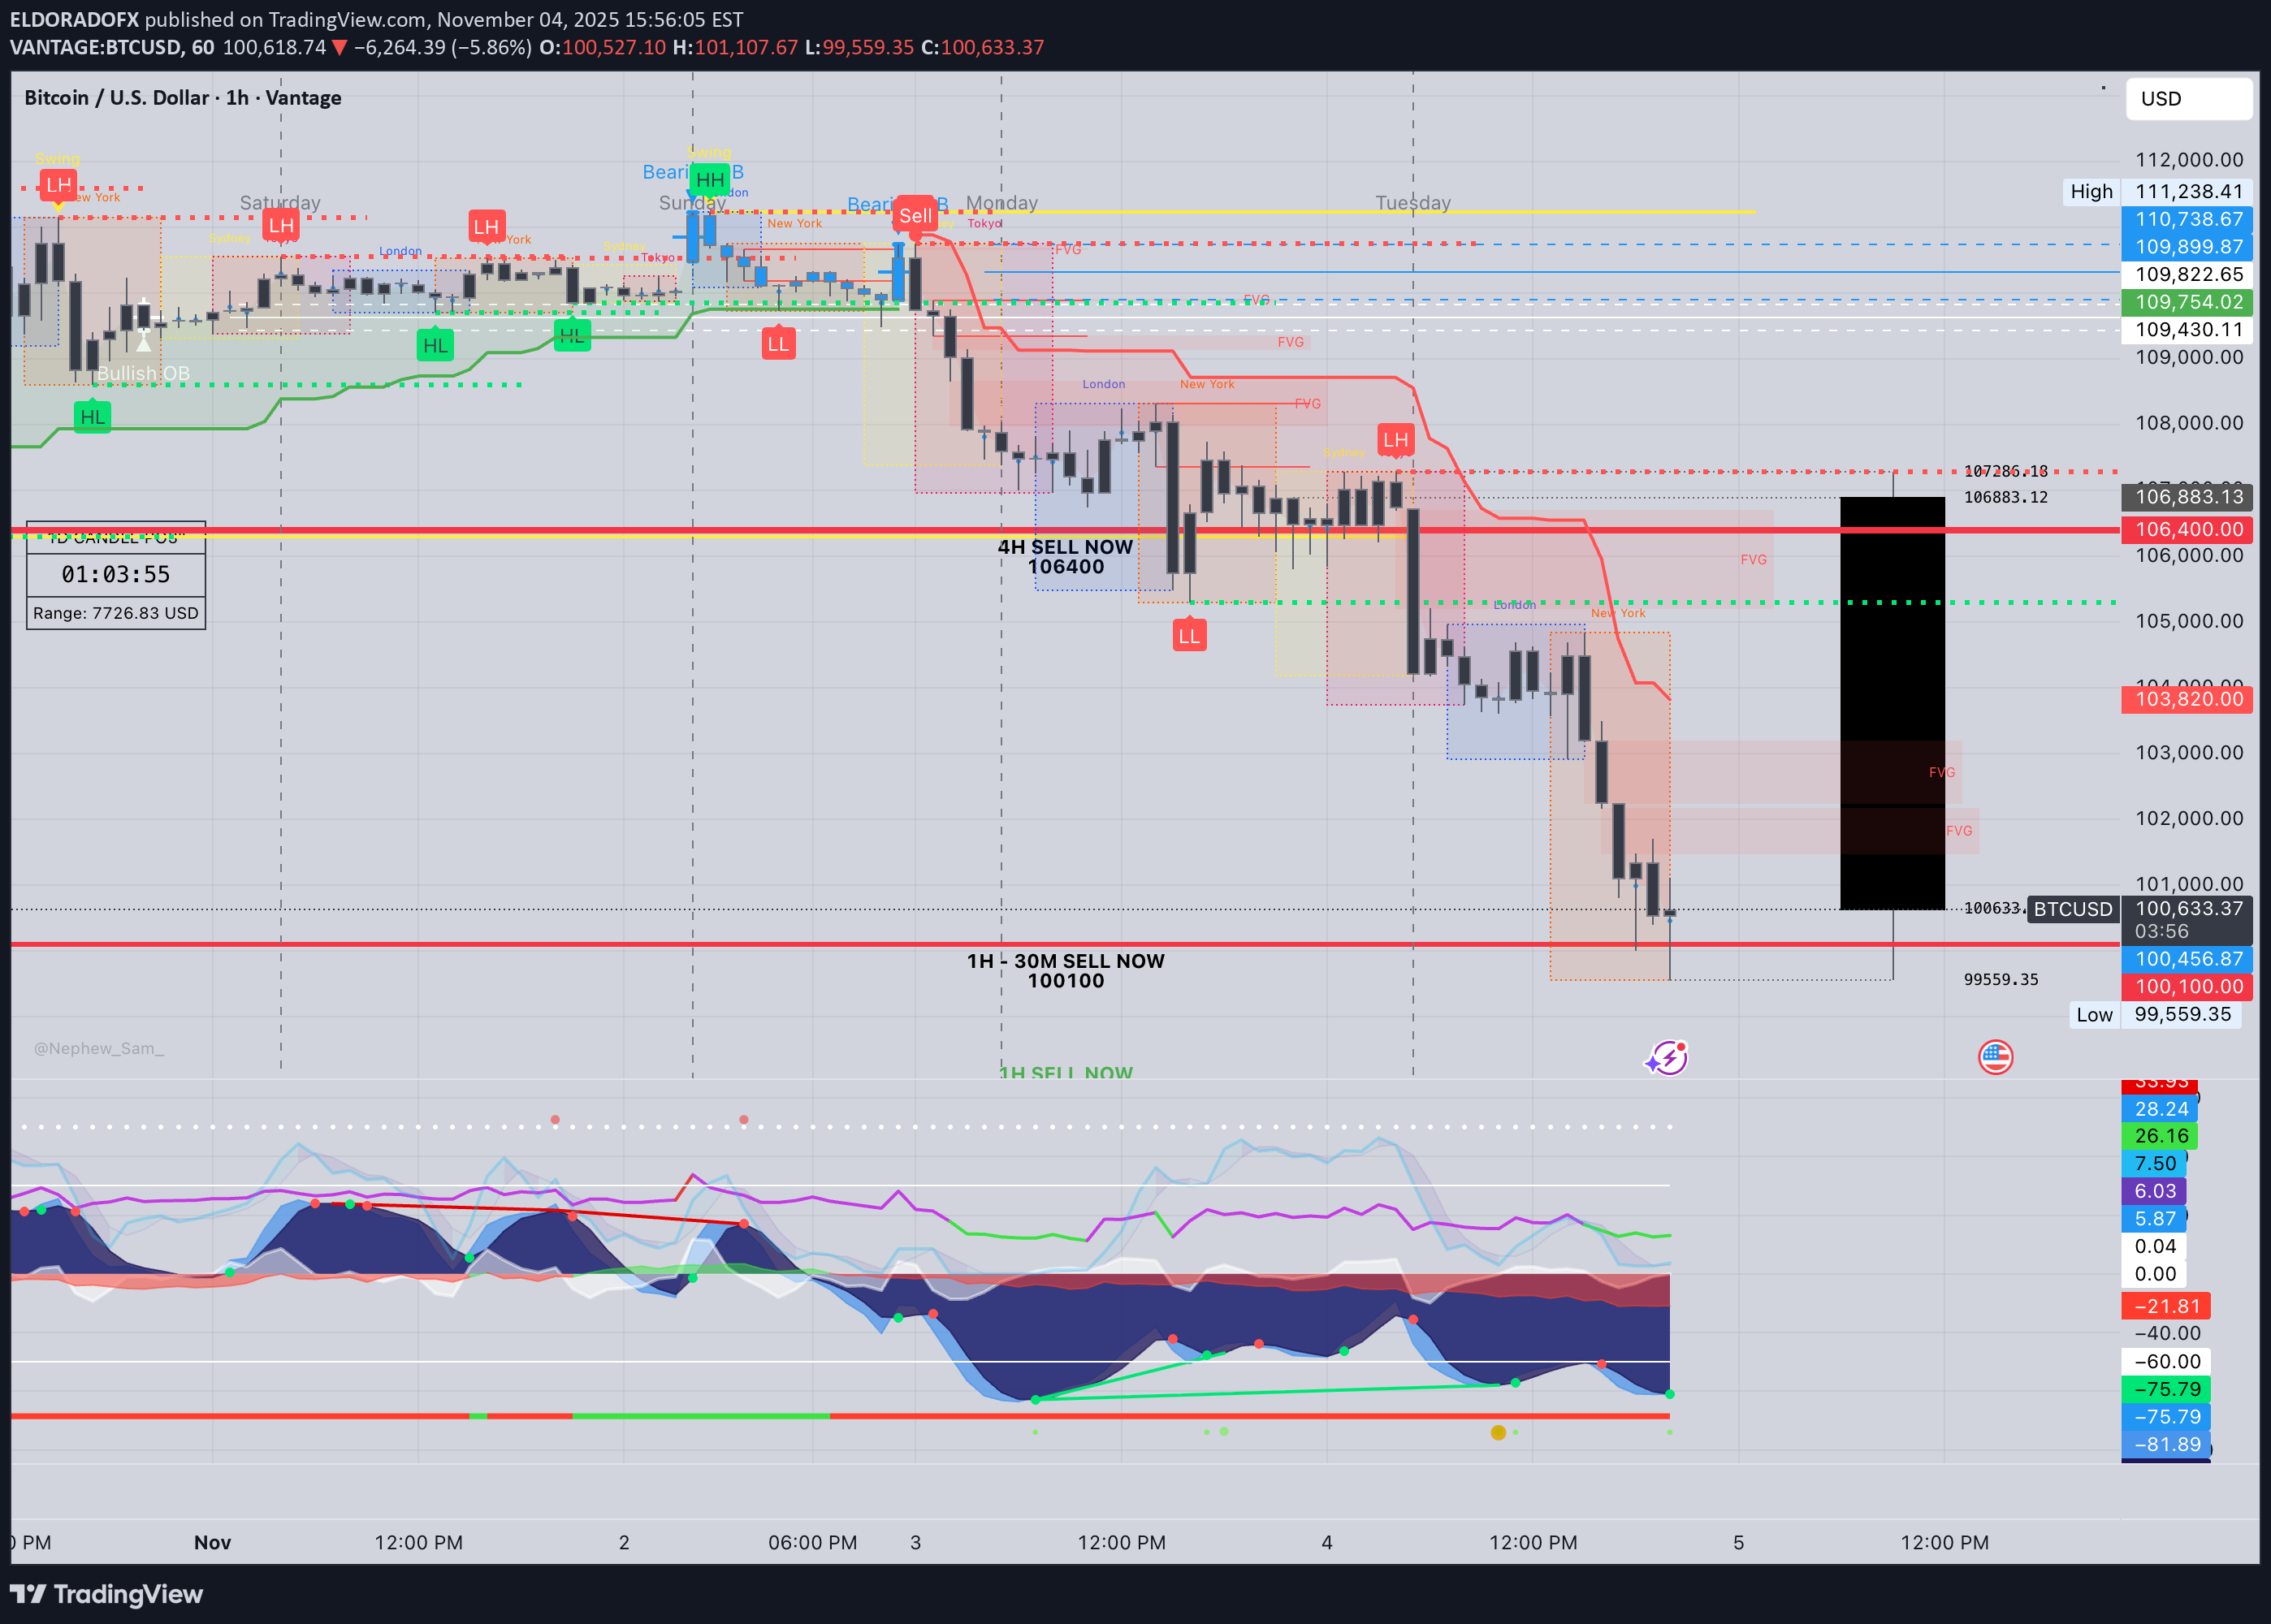
Prepared by: ElDoradoFx PREMIUM 3.0 Analyst Desk ⸻ 🧭 1️⃣ Market Overview Bitcoin has experienced a strong bearish continuation, breaking decisively below the key structural support at 108,200, confirming a shift in market sentiment. The break of structure (BOS) at 109,600 turned the mid-term bias bearish, with price now testing the psychological level at 100,000. RSI is at 32 on the daily chart, showing near-oversold conditions, but momentum remains heavy to the downside. Unless bulls reclaim 101,000–102,000, sellers are likely to continue dominating toward 98,600–97,000. ⸻ 📊 2️⃣ Technical Breakdown 🔻 Daily (D1) •Price broke below the long-term ascending trendline from August. •EMAs aligned for bearish continuation (20 < 50 < 200). •RSI 32 → weak recovery potential but still room for downside liquidity sweep. → Interpretation: Bears fully in control until 102,000 is reclaimed. 🔻 1-Hour (H1) •Descending channel intact; price rejected from supply zone 101,200–101,600. •RSI hovering around 30–40; possible minor retracement before further drop. •MACD still printing red histogram bars → bearish momentum active. → Interpretation: Look for short opportunities near resistance retests. ⚠️ 15M–5M (Intraday) •Price formed a small double bottom near 99,550, showing temporary relief bounce. •RSI rebounding, but no confirmation of reversal. •EMA50 (H1) around 101,000 acting as dynamic resistance. → Interpretation: Possible short-term correction before continuation down. ⸻ 📐 3️⃣ Fibonacci Analysis Swing Range: 104,839 → 99,559 LevelPriceObservation 38.2%101,455Minor retracement zone 50.0%102,200Key confluence with EMA50 61.8%102,950Strong resistance zone for potential short re-entry ✅ Golden Zone: 101,455 – 102,950 This is the ideal sell re-entry area if price pulls back. ⸻ 🎯 4️⃣ High-Probability Trade Scenarios 🔻 SELL SETUP (PRIMARY BIAS) Scenario A – Golden Zone Retest •Entry: 101,455–102,950 (Fibonacci + EMA confluence) 🎯 TP1 → 100,000 TP2 → 99,000 TP3 → 97,000 🛑 SL → Above 103,300 Scenario B – Continuation Breakout •Trigger: Break & retest below 99,550 🎯 TP1 → 98,600 TP2 → 97,000 TP3 → 95,800 🛑 SL → Above 100,300 ⸻ 🟢 BUY SETUP (ALTERNATIVE SCENARIO) Scenario A – Support Reversal Zone •Entry: 99,550–98,600 (if strong bullish reaction with engulfing candles) 🎯 TP1 → 101,000 TP2 → 102,000 TP3 → 103,000 🛑 SL → Below 98,200 ⸻ 🕐 5️⃣ Fundamental Watch • US yields rising and DXY strengthening above 105.2 → bearish pressure on BTC. • Market sentiment risk-off due to global equity weakness. • Watch upcoming US Unemployment & CPI data — could trigger volatility reversal. ⸻ ⚙️ 6️⃣ Key Technical Levels TypeLevels Resistance101,455 / 102,200 / 102,950 Support99,550 / 98,600 / 97,000 Golden Zone101,455 – 102,950 Breakout ConfirmationBelow 99,550 or Above 103,000 ⸻ 🧾 7️⃣ Analyst Summary BTC confirmed a bearish structure, with short-term retracements expected toward the Golden Zone (101,455–102,950) before further downside continuation. Momentum indicators still favor sellers, though oversold readings could create minor pullbacks. Until 103,000 is broken to the upside, bias remains bearish. ⸻ 📈 8️⃣ Final Bias Summary 🔻 Bearish below 102,000 → Targets 99,000 / 97,000 / 95,800 🟢 Bullish only above 103,000 → Targets 104,800 / 106,000 ⸻ — ElDoradoFx PREMIUM 3.0 Team 🚀
تحلیل طلا (XAUUSD): معامله امروز در لندن - منطقه طلایی و سناریوهای انفجاری!
1. Market Overview Gold enters the London session trading just below the $4,000 handle, recovering after an early Asian dip to $3,970. The market remains in a range-to-accumulation phase, consolidating beneath descending structure resistance ($4,008–$4,016) and above key support ($3,985–$3,970). Momentum indicators suggest early bullish restoration, but price action remains capped under the 200EMA, awaiting a confirmed breakout to define London’s direction. ⸻ 2. Technical Breakdown 🔹 Daily (D1) Gold holds above the 100EMA, keeping the medium-term structure bullish. RSI at ~50.5 indicates neutrality after a corrective pullback from $4,046. As long as price stays above $3,985, the bullish structure remains intact. 🔹 H1 The pair trades within a descending channel, testing dynamic resistance at $4,004–$4,008. The 50EMA is flattening near the 200EMA, hinting at a potential cross for trend continuation. MACD is stabilizing with higher histogram lows, a bullish sign of momentum recovery. 🔹 15M–5M Short-term structure shows a series of higher lows (3,970 → 3,982 → 3,993) but faces a clear supply ceiling at 4,004–4,010. RSI around 55–60; MACD positive, suggesting accumulation pressure and reduced selling volume. ⸻ 3. Fibonacci Analysis (Swing 3,970 → 4,008) •38.2% = 3,993 •50.0% = 3,989 •61.8% = 3,985 🎯 Golden Zone: 3,993 – 3,985 → Active demand area for potential long entries. ⸻ 4. High-Probability Trade Scenarios 📈 BUY SCENARIO (Primary Bias) •Buy Zone: 3,993 – 3,985 (Golden Zone) •Confirmation: Bullish CHoCH or engulfing candle in zone with RSI > 50 •Targets: 4,004 → 4,016 → 4,028 → 4,046 •Stop Loss: Below 3,970 📊 Justification: The Golden Zone aligns with previous liquidity sweep and ascending channel support — strong probability for continuation if defended during London volatility. 💥 Breakout BUY Setup •Trigger: Break & close above 4,008 •Retest Entry: 4,004–4,006 •Targets: 4,016 → 4,028 → 4,046 → 4,060 •Stop Loss: Below 3,995 📉 SELL SCENARIO (Countertrend) •Sell Zone: 4,004 – 4,016 (EMA confluence & descending structure) •Confirmation: Bearish rejection or RSI divergence > 65 •Targets: 3,989 → 3,970 → 3,945 •Stop Loss: Above 4,020 📊 Justification: A rejection from this area would indicate failed breakout momentum, creating a high R:R short toward range support. ⚠️ Break & Retest SELL Setup •Trigger: Break below 3,970 •Retest Entry: 3,978–3,974 •Targets: 3,965 → 3,945 → 3,920 •Stop Loss: Above 3,985 ⸻ 5. Fundamental Watch •UK/EU Data: Light calendar — focus remains on USD strength and DXY (106.10). •US Factors: Factory Orders and Fed speakers later today; could affect volatility mid-London to NY overlap. •Sentiment: Gold remains technically bullish but constrained by short-term dollar resilience and yield stabilization. ⸻ 6. Key Technical Levels TypeLevelsNotes Resistance4,004 / 4,016 / 4,028 / 4,046Supply + 200EMA zone Support3,993 / 3,985 / 3,970 / 3,965Fibo + structural base Golden Zone3,993 – 3,985Main liquidity pivot Break Buy TriggerAbove 4,008Confirmed bullish continuation Break Sell TriggerBelow 3,970Bearish momentum confirmation ⸻ 7. Analyst Summary Gold is building pressure within a compressed wedge, where the Golden Zone (3,993–3,985) represents the pivot of the day. Momentum indicators lean bullish, but the 200EMA and trendline resistance near 4,004–4,008 remain the key barriers. A clean breakout above 4,008 opens the path to 4,028–4,046, while failure to hold above 3,985 may trigger a retracement to 3,965–3,945. ⸻ 8. Final Bias Summary ✅ Primary Bias: Bullish above 3,985 ⚠️ Neutral Zone: 3,985–4,004 (wait for breakout confirmation) ❌ Bearish Only Below: 3,970 🎯 Expert Outlook: Focus on buying dips near the Golden Zone with confirmation; avoid premature entries before breakout validation. ⸻ 🥇 ElDoradoFx PREMIUM 3.0 – PERFORMANCE 03/11/2025 💸 📊 Smart Entries | Clean Profits | No Drawdown ━━━━━━━━━━━━━━━ 🪙 GOLD RESULTS 🟢 BUY +120 PIPS 🟢 BUY +30 PIPS 🔻 SELL +90 PIPS 🟢 BUY +40 PIPS 🟢 BUY LIMIT +200 PIPS 🔻 SELL +20 PIPS 🟢 BUY +40 PIPS 🟢 BUY +20 PIPS 🟢 BUY +40 PIPS 💰 GOLD TOTAL: +600 PIPS ━━━━━━━━━━━━━━━ 📱 BTC/USD WEEKEND TRADES 🚀 BUY +900 PIPS 🚀 BUY +1,300 PIPS 📱 BTC TOTAL: +2,200 PIPS ━━━━━━━━━━━━━━━ 📊 COMBINED GAIN: +2,800 PIPS ✅ 11 Trades → 11 Wins | 0 SL | 0 BE 🎯 Accuracy: 100% ━━━━━━━━━━━━━━━ 🔥 Flawless start to November — precision entries, strong momentum, and clear profit execution across GOLD and BTC! 👏 Congratulations if you profited! ✅✅✅🚀🚀🚀
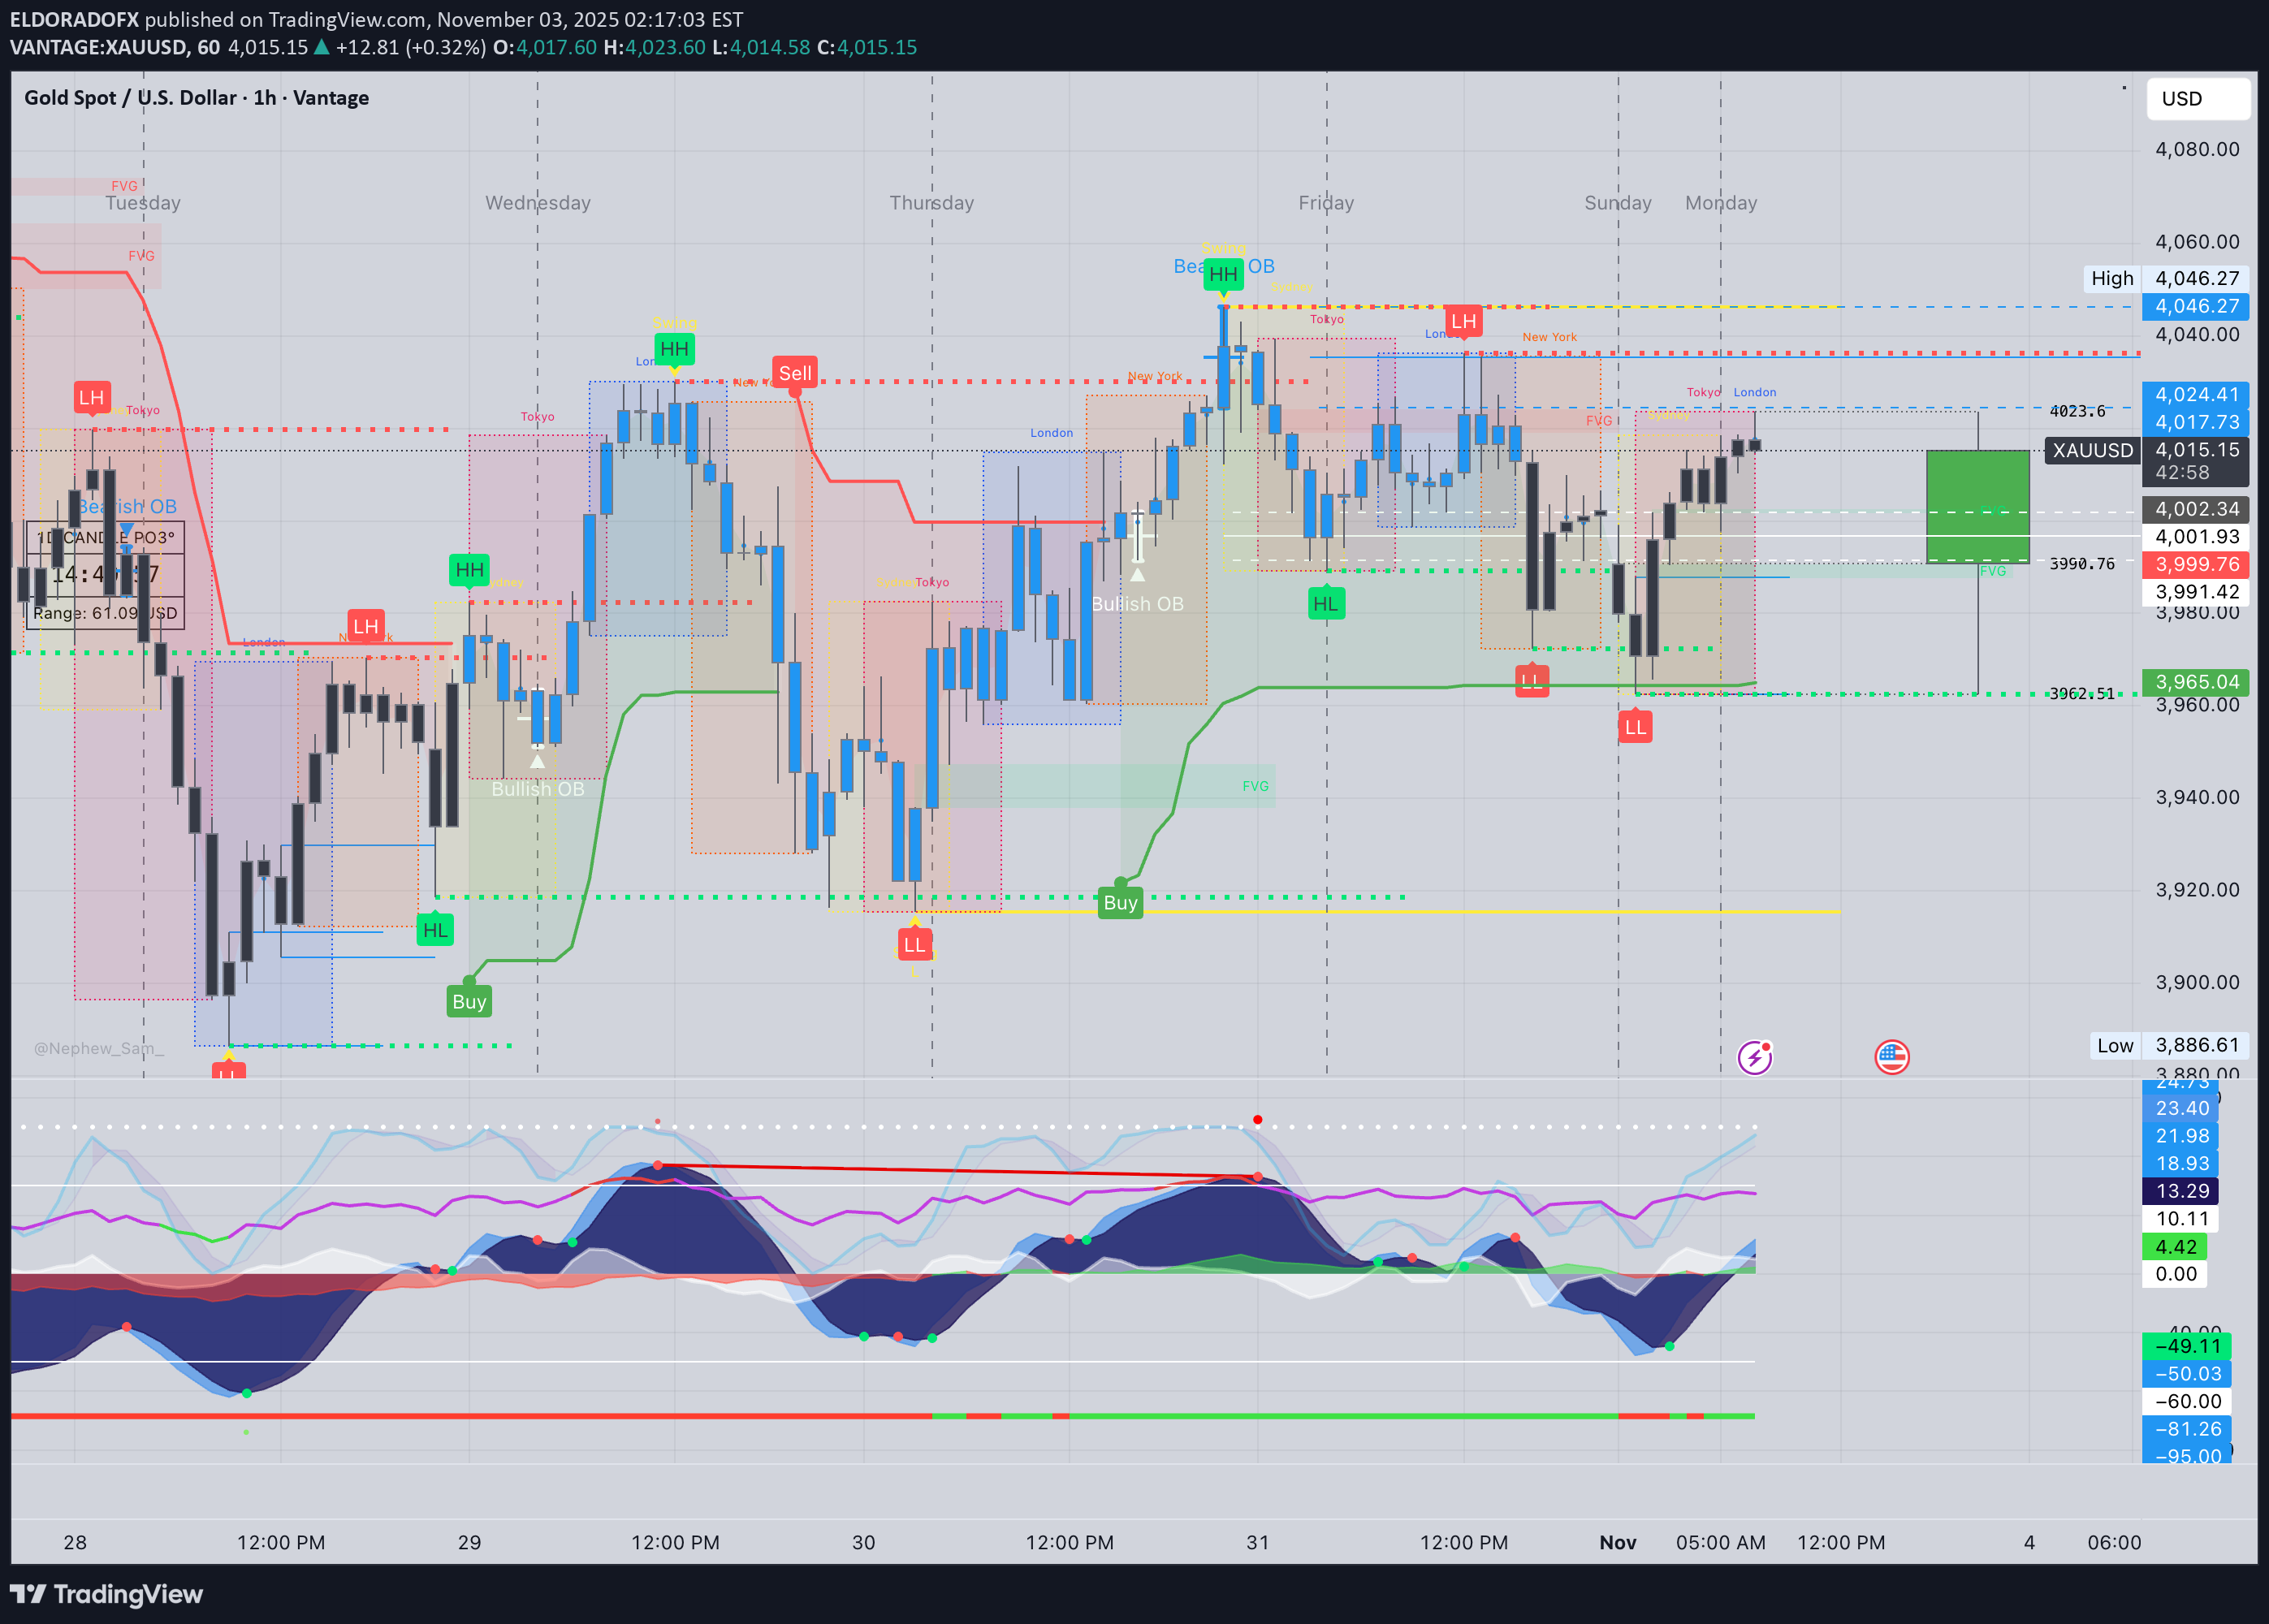
تحلیل طلا: منطقه طلایی 4008-4016 و انتظار برای انفجار آسیا
Gold ends the NY session stabilizing near 4,009, after multiple rejections from 4,025–4,030, confirming that sellers are still defending the upper liquidity zone. Meanwhile, buyers continue holding 4,004–3,995, maintaining a short-term ascending structure. This compression phase between resistance and support signals an imminent breakout setup — with Asia likely to decide direction for the next leg. ⸻ 📊 Technical Outlook 🔹 D1: Gold remains bullish above the 100EMA, sustaining higher lows from 3,962 → 3,985 → 3,995. RSI ~52 — neutral but holding mid-range momentum. Daily breakout above 4,025 could reopen the path toward 4,060–4,082. 🔹 H1: Structure compressing between 4,025 resistance and 3,995 support. EMAs converging; MACD neutral with low volatility — ideal for a pre-breakout scenario. 🔹 15M–5M: Price forming equal highs at 4,011–4,012 and higher lows near 4,004. RSI 54–58, indicating gradual bullish accumulation before volatility expansion. ⸻ ✨ Fibonacci Golden Zone (Last Swing 3,995 → 4,030) 38.2% = 4,016 50.0% = 4,012 61.8% = 4,008 🎯 Golden Zone: 4,016 – 4,008 (acting as key liquidity zone and short-term pivot). ⸻ 🎯 High Probability Zones 📈 BUY SCENARIO (Primary Bias) ✅ Buy Zone: 4,016 – 4,008 (Golden Zone) 🎯 Targets: 4,025 → 4,036 → 4,046 → 4,060 🛑 Stop Loss: Below 3,995 ⚡ Confirmation: Bullish engulfing or CHoCH above 4,012–4,016 with MACD crossover upward. 📊 Bias Rationale: The market continues to respect higher lows and absorb liquidity dips — indicating smart money accumulation around the Golden Zone. 💥 Breakout BUY Setup Trigger: Break & close above 4,025 Retest: 4,022–4,024 🎯 Targets: 4,036 → 4,046 → 4,060 → 4,082 🛑 Stop Loss: Below 4,010 📉 SELL SCENARIO (Contingency Setup) ⚠️ Sell Zone: 4,025 – 4,036 (liquidity pocket + supply zone) 🎯 Targets: 4,012 → 4,004 → 3,985 → 3,965 🛑 Stop Loss: Above 4,046 ⚡ Confirmation: Sharp rejection or RSI divergence >65 from 4,025–4,030 area. 📉 Break & Retest SELL Setup Trigger: Break below 3,995 Retest: 4,000–3,997 🎯 Targets: 3,982 → 3,965 → 3,945 🛑 Stop Loss: Above 4,008 ⸻ 📰 Fundamental Watch • Asia session: Low-impact day; volatility expected from liquidity sweeps. • US Dollar Index (DXY) holding above 106 — mild pressure on gold short-term. • Global markets: Traders positioning ahead of Fed and NFP later this week, keeping gold in range mode for now. ⸻ 📌 Key Levels Resistance: 4,025 / 4,036 / 4,046 / 4,060 Support: 4,012 / 4,004 / 3,995 / 3,982 Golden Zone: 4,016 – 4,008 Break Buy Trigger: > 4,025 Break Sell Trigger: < 3,995 ⸻ ✅ Summary (Expert View) Gold remains bullish-to-neutral, consolidating between 4,004–4,025. The Fibonacci Golden Zone (4,016–4,008) continues to act as the core decision area — expect Asia to attempt a liquidity sweep before breakout. ⚡ Expert Bias: BUY setup favored above 4,008, targeting 4,036–4,046. Bearish bias only if 3,995 breaks cleanly.
تحلیل تکنیکال طلا: طلسم شکسته میشود؟ سناریوهای خرید و فروش در جلسه لندن
1️⃣ Market Overview Gold continues its bullish momentum from the 3,962 weekly low, now trading around 4,018–4,020, with clear signs of accumulation above the 200 EMA. The market remains in an upward correction phase, with intraday structure showing strong recovery and possible breakout above key resistance. London session focus: whether gold can sustain above 4,023 to confirm a continuation toward 4,036–4,046. ⸻ 2️⃣ Technical Breakdown 🟢 Daily (D1) •The daily candle remains bullish, holding above the 10EMA (≈4,010) and approaching resistance near 4,036. •RSI at 61, signaling sustained recovery momentum. •MACD histogram decreasing red volume, hinting at reversal continuation potential. 🟡 H1 (Hourly) •Price structure: higher lows from 3,962 → 3,985 → 4,000, forming a bullish channel. •Break of structure at 4,015 with RSI 56+, confirming bullish control. •Price testing the descending trendline and 200EMA (4,022–4,026 zone). •MACD momentum positive, suggesting strength for a potential London breakout. 🔵 15M–5M (Intraday) •Bullish BOS (Break of Structure) confirmed at 4,010; price consolidating below 4,023 liquidity zone. •RSI 65 → near breakout threshold. •EMAs aligned bullishly (50EMA > 100EMA > 200EMA). •MACD showing continued bullish histogram expansion. ⸻ 3️⃣ Fibonacci Analysis Last swing: 3,962 → 4,036 LevelPrice 38.2%4,017 50.0%3,999 61.8%3,982 🎯 Golden Zone: 3,999 – 3,982 → Ideal retracement zone for continuation buys if price corrects. ⸻ 4️⃣ High-Probability Trade Scenarios ✅ BUY SCENARIO (Main Bias) Buy Zone: 3,999 – 3,982 (Golden Zone) Confirmation: 5M–15M bullish CHoCH + RSI >55 🎯 Targets: •TP1 → 4,023 •TP2 → 4,036 •TP3 → 4,046 •TP4 → 4,060 🛑 SL: Below 3,975 Breakout Buy: Trigger: Break & retest above 4,023 🎯 Targets: 4,036 → 4,046 → 4,060 🛑 SL: Below 4,010 ⸻ ⚠️ SELL SCENARIO (Countertrend) Sell Zone: 4,023 – 4,036 (Liquidity trap + 200EMA rejection) Confirmation: RSI divergence + rejection candle on 15M 🎯 Targets: •TP1 → 4,008 •TP2 → 3,995 •TP3 → 3,982 🛑 SL: Above 4,046 Breakout Sell: Trigger: Break below 3,975 🎯 Targets: 3,962 → 3,945 🛑 SL: Above 3,990 ⸻ 5️⃣ Fundamental Watch •UK Manufacturing PMI early volatility may drive session movement. •US ISM Manufacturing PMI and Fed Williams speech later today could bring sharp USD reactions. •DXY hovering near 106.10, slightly weakening — bullish bias for gold if this continues. ⸻ 6️⃣ Key Technical Levels TypeLevels Resistance4,023 / 4,036 / 4,046 / 4,060 Support4,008 / 3,995 / 3,982 / 3,962 Golden Zone3,999 – 3,982 Break Buy Trigger> 4,023 Break Sell Trigger< 3,975 ⸻ 7️⃣ Analyst Summary Gold continues its bullish recovery from the 3,960 zone and is currently testing structural resistance at 4,023. A confirmed breakout and retest above 4,023 would open the path to 4,036–4,046, while a failure at this level could lead to short-term retracement toward 3,995–3,982 (Golden Zone) before continuation. ⸻ 8️⃣ Final Bias Summary •Primary Bias: 🟢 Bullish above 4,008 → Target 4,036–4,046 •Secondary Bias: 🔴 Bearish below 3,975 → Target 3,962–3,945 •Volatility: Moderate → may increase around PMI data. ⸻ — ElDoradoFx PREMIUM 3.0 Team 🚀
تحلیل هفتگی بیت کوین (BTCUSD): فرصت خرید در منطقه طلایی یا سقوط زیر ۱۰۹,۷۰۰؟
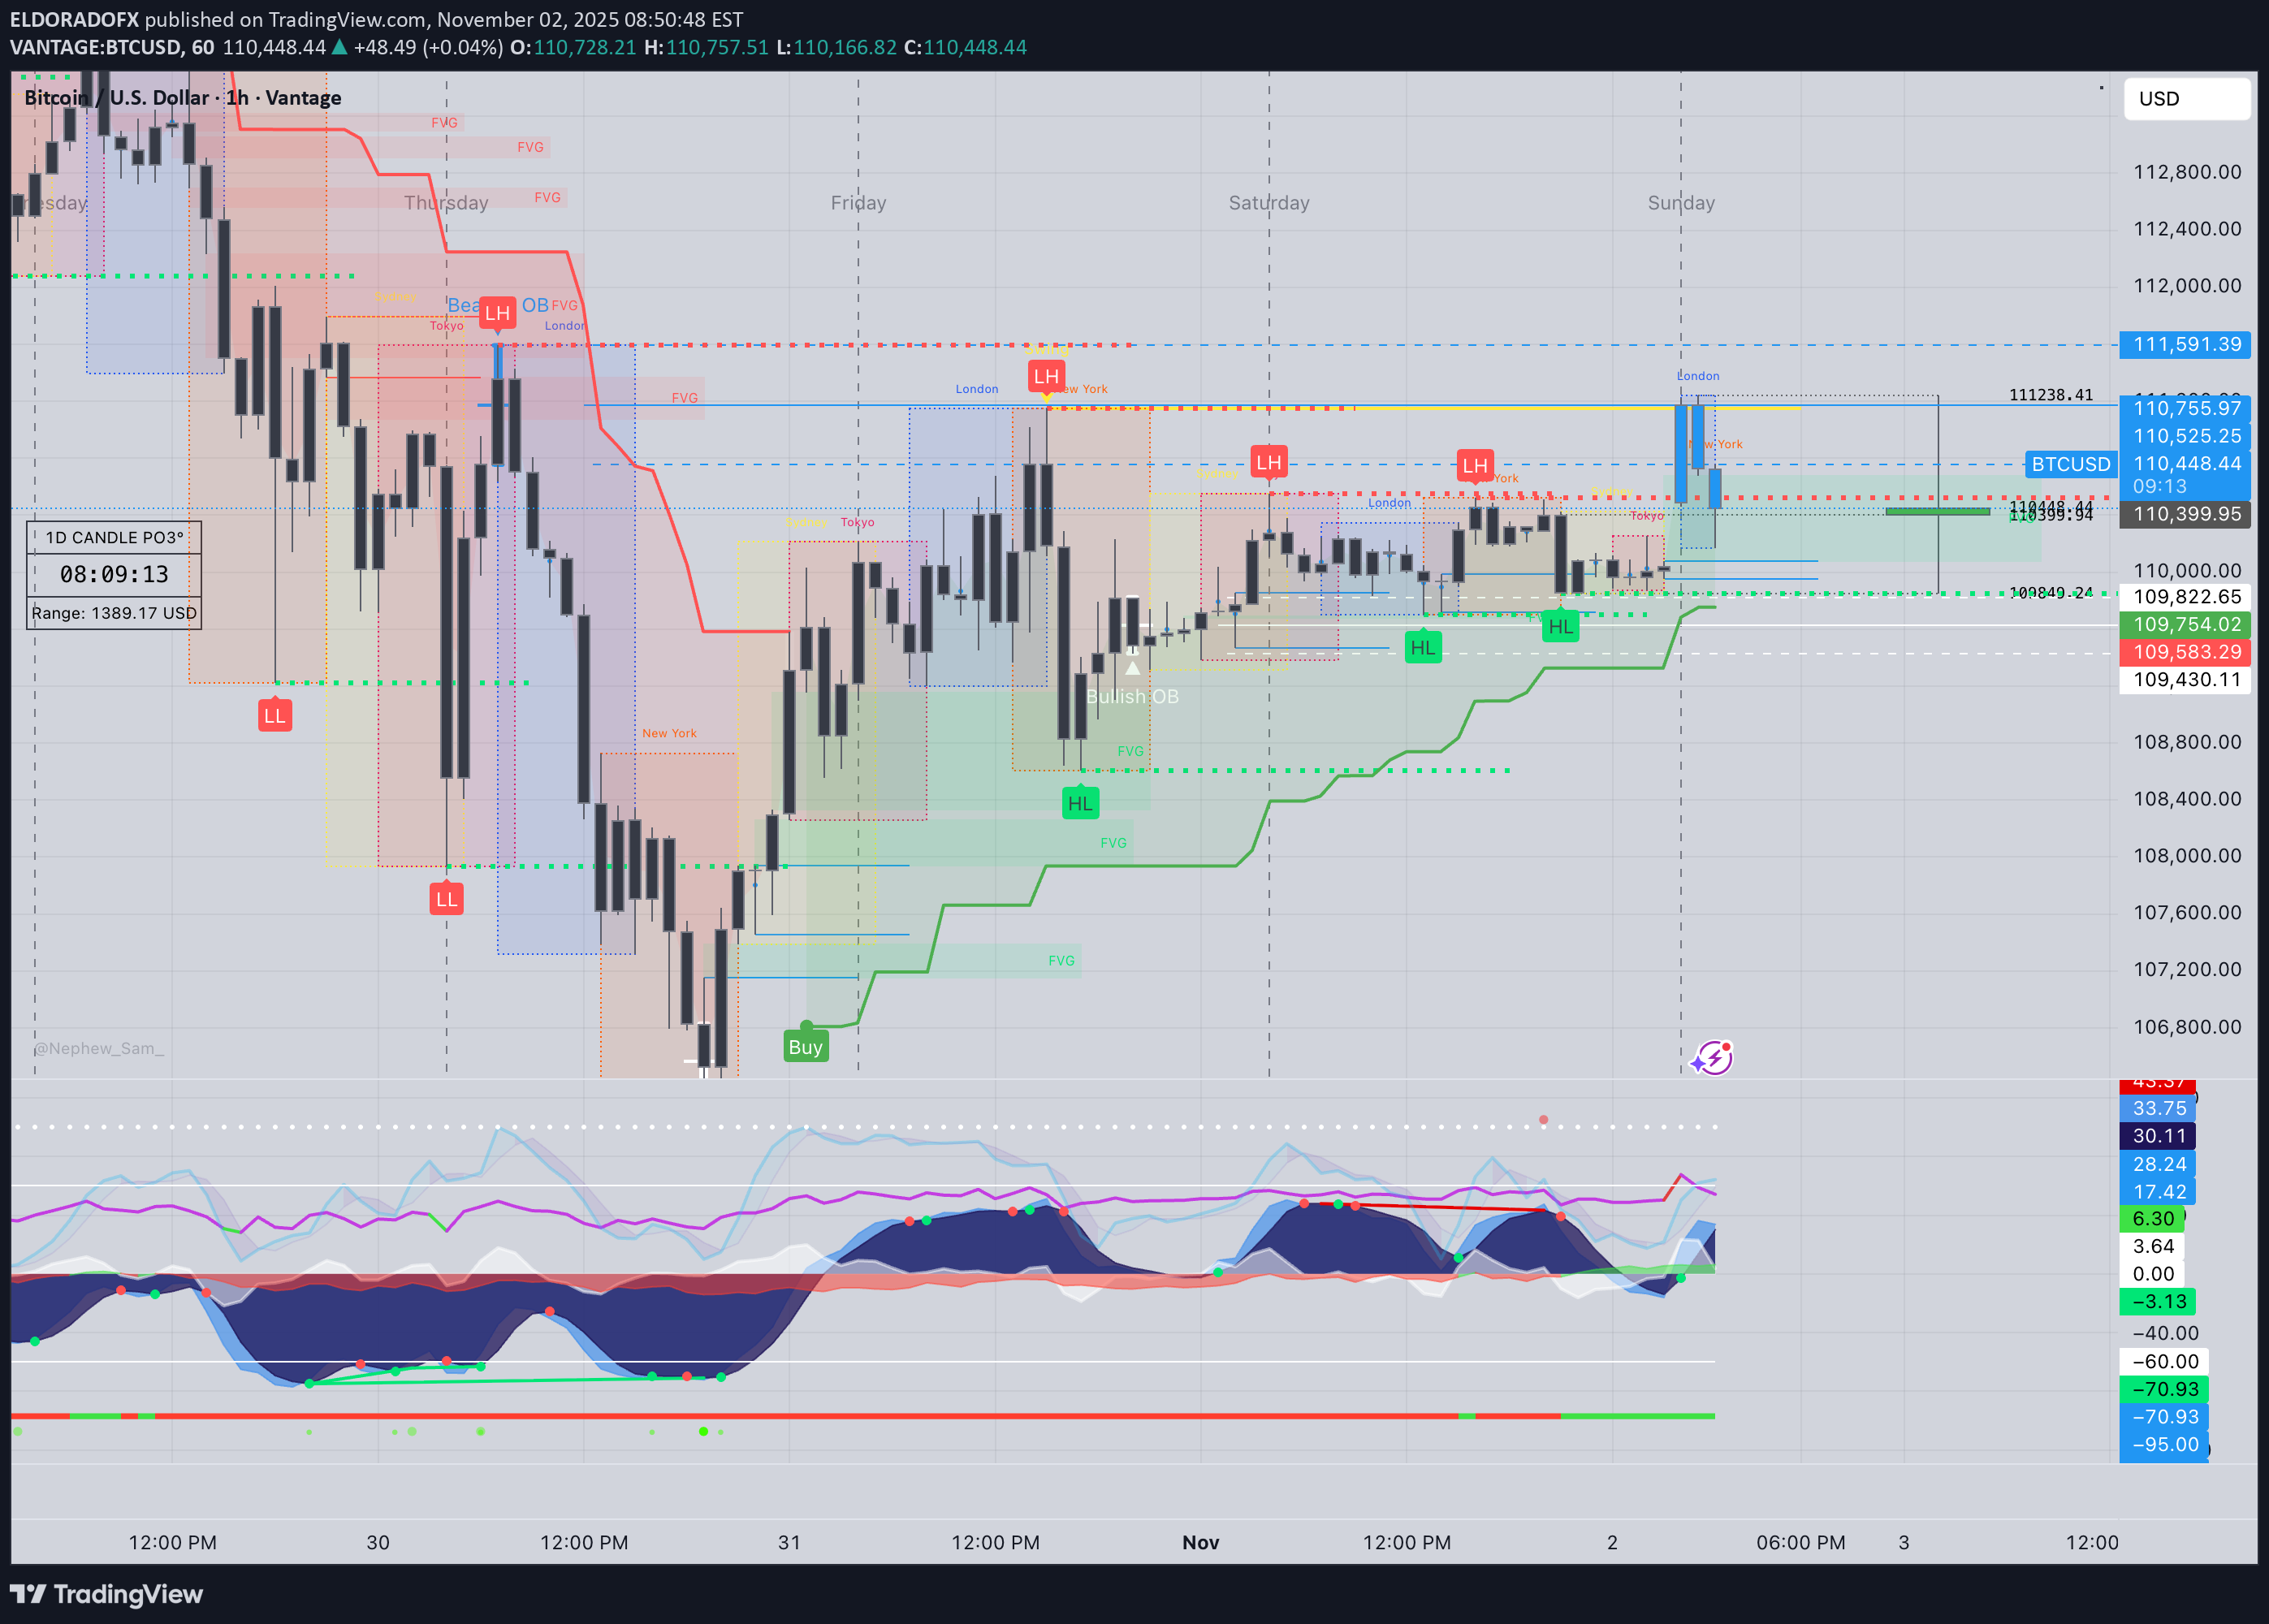
🧭 1️⃣ Market Overview Bitcoin retraced after testing the intraday resistance near 111,238, facing rejection at the upper boundary of the descending channel. Price remains supported above 110,000, respecting both the dynamic ascending trendline and 200 EMA on intraday charts. Momentum has cooled but the market still holds a mildly bullish structure unless 109,700 breaks. Volatility is expected to remain moderate heading into early-week sessions. ⸻ 📊 2️⃣ Technical Breakdown ✅ Daily (D1) •Structure: Rangebound between 108,300 and 111,800. •EMAs: Price hovering between 50 and 200 EMA, equilibrium zone. •RSI (47): Neutral – no divergence. •MACD: Histogram flattening; momentum loss after prior bullish impulse. → Interpretation: Consolidation phase, waiting for directional breakout. ✅ 1-Hour (H1) •Clean BOS from 109,600 led to impulsive rise to 111,200. •Currently retracing toward the 50 EMA and trendline support. •Key support: 110,100–109,900. → Interpretation: Market retesting support after profit-taking; potential bullish re-entry if structure holds. ✅ 15M–5M (Intraday) •Price rejecting 111,238 and forming short-term lower highs. •RSI rebounding from 35 – possible micro bullish correction. •MACD showing first red bars, indicating short-term retracement nearing exhaustion. → Interpretation: Possible liquidity sweep around 110,000 before upward continuation. ⸻ 📐 3️⃣ Fibonacci Analysis Swing Range: 109,703 → 111,238 LevelPriceObservation 38.2%110,671Minor support zone 50.0%110,470Golden mid-level + EMA confluence 61.8%110,268Trendline & structural confluence ✅ Golden Zone: 110,671 – 110,268 (high-probability buy zone) ⸻ 🎯 4️⃣ High-Probability Trade Scenarios 🟢 BUY SCENARIOS (Primary Bias) Scenario A – Golden Zone Reversal (Ideal Setup) •Entry Zone: 110,671 – 110,268 🎯 TP1 → 111,000 TP2 → 111,238 TP3 → 111,800 🛑 SL → Below 109,900 Scenario B – Breakout Continuation •Trigger: Break & retest above 111,238 🎯 TP1 → 111,800 TP2 → 112,200 TP3 → 112,800 🛑 SL → Below 110,800 ⸻ 🔻 SELL SCENARIOS (Alternative) Scenario A – Breakdown from Structure •Trigger: Break & retest below 109,700 🎯 TP1 → 109,200 TP2 → 108,600 TP3 → 108,000 🛑 SL → Above 110,200 Scenario B – Rejection from 111,200–111,400 Zone •Trigger: Bearish engulfing candle rejection. 🎯 TP1 → 110,600 TP2 → 110,000 🛑 SL → Above 111,500 ⸻ 🕐 5️⃣ Fundamental Watch •Weekend volatility lower than average; price reactive to liquidity sweeps. •DXY steady near 104.8 – neutral macro tone. •ETF accumulation flows remain supportive for mid-term trend. •Watch US macro data midweek (PMI & NFP) for volatility spikes. ⸻ ⚙️ 6️⃣ Key Technical Levels TypeLevels Resistance111,238 / 111,800 / 112,200 Support110,268 / 109,900 / 109,700 Golden Zone110,671 – 110,268 Breakout ConfirmationAbove 111,238 or Below 109,700 ⸻ 🧾 7️⃣ Analyst Summary BTC continues consolidating within a controlled retracement phase, currently resting in the Golden Zone (110,671–110,268) that aligns with the ascending trendline. Holding above this range favors bullish continuation, while a confirmed break below 109,700 would open downside space. Short-term trades favor long positions within the zone, targeting 111,200–111,800. ⸻ 📈 8️⃣ Final Bias Summary 🟢 Bullish bias above 110,200 → Targets 111,200 / 111,800 🔻 Bearish bias below 109,700 → Targets 108,800 / 108,000 ⸻
Disclaimer
Any content and materials included in Sahmeto's website and official communication channels are a compilation of personal opinions and analyses and are not binding. They do not constitute any recommendation for buying, selling, entering or exiting the stock market and cryptocurrency market. Also, all news and analyses included in the website and channels are merely republished information from official and unofficial domestic and foreign sources, and it is obvious that users of the said content are responsible for following up and ensuring the authenticity and accuracy of the materials. Therefore, while disclaiming responsibility, it is declared that the responsibility for any decision-making, action, and potential profit and loss in the capital market and cryptocurrency market lies with the trader.