Technical analysis by ELDORADOFX about Symbol BTC on 11/2/2025
تحلیل هفتگی بیت کوین (BTCUSD): فرصت خرید در منطقه طلایی یا سقوط زیر ۱۰۹,۷۰۰؟
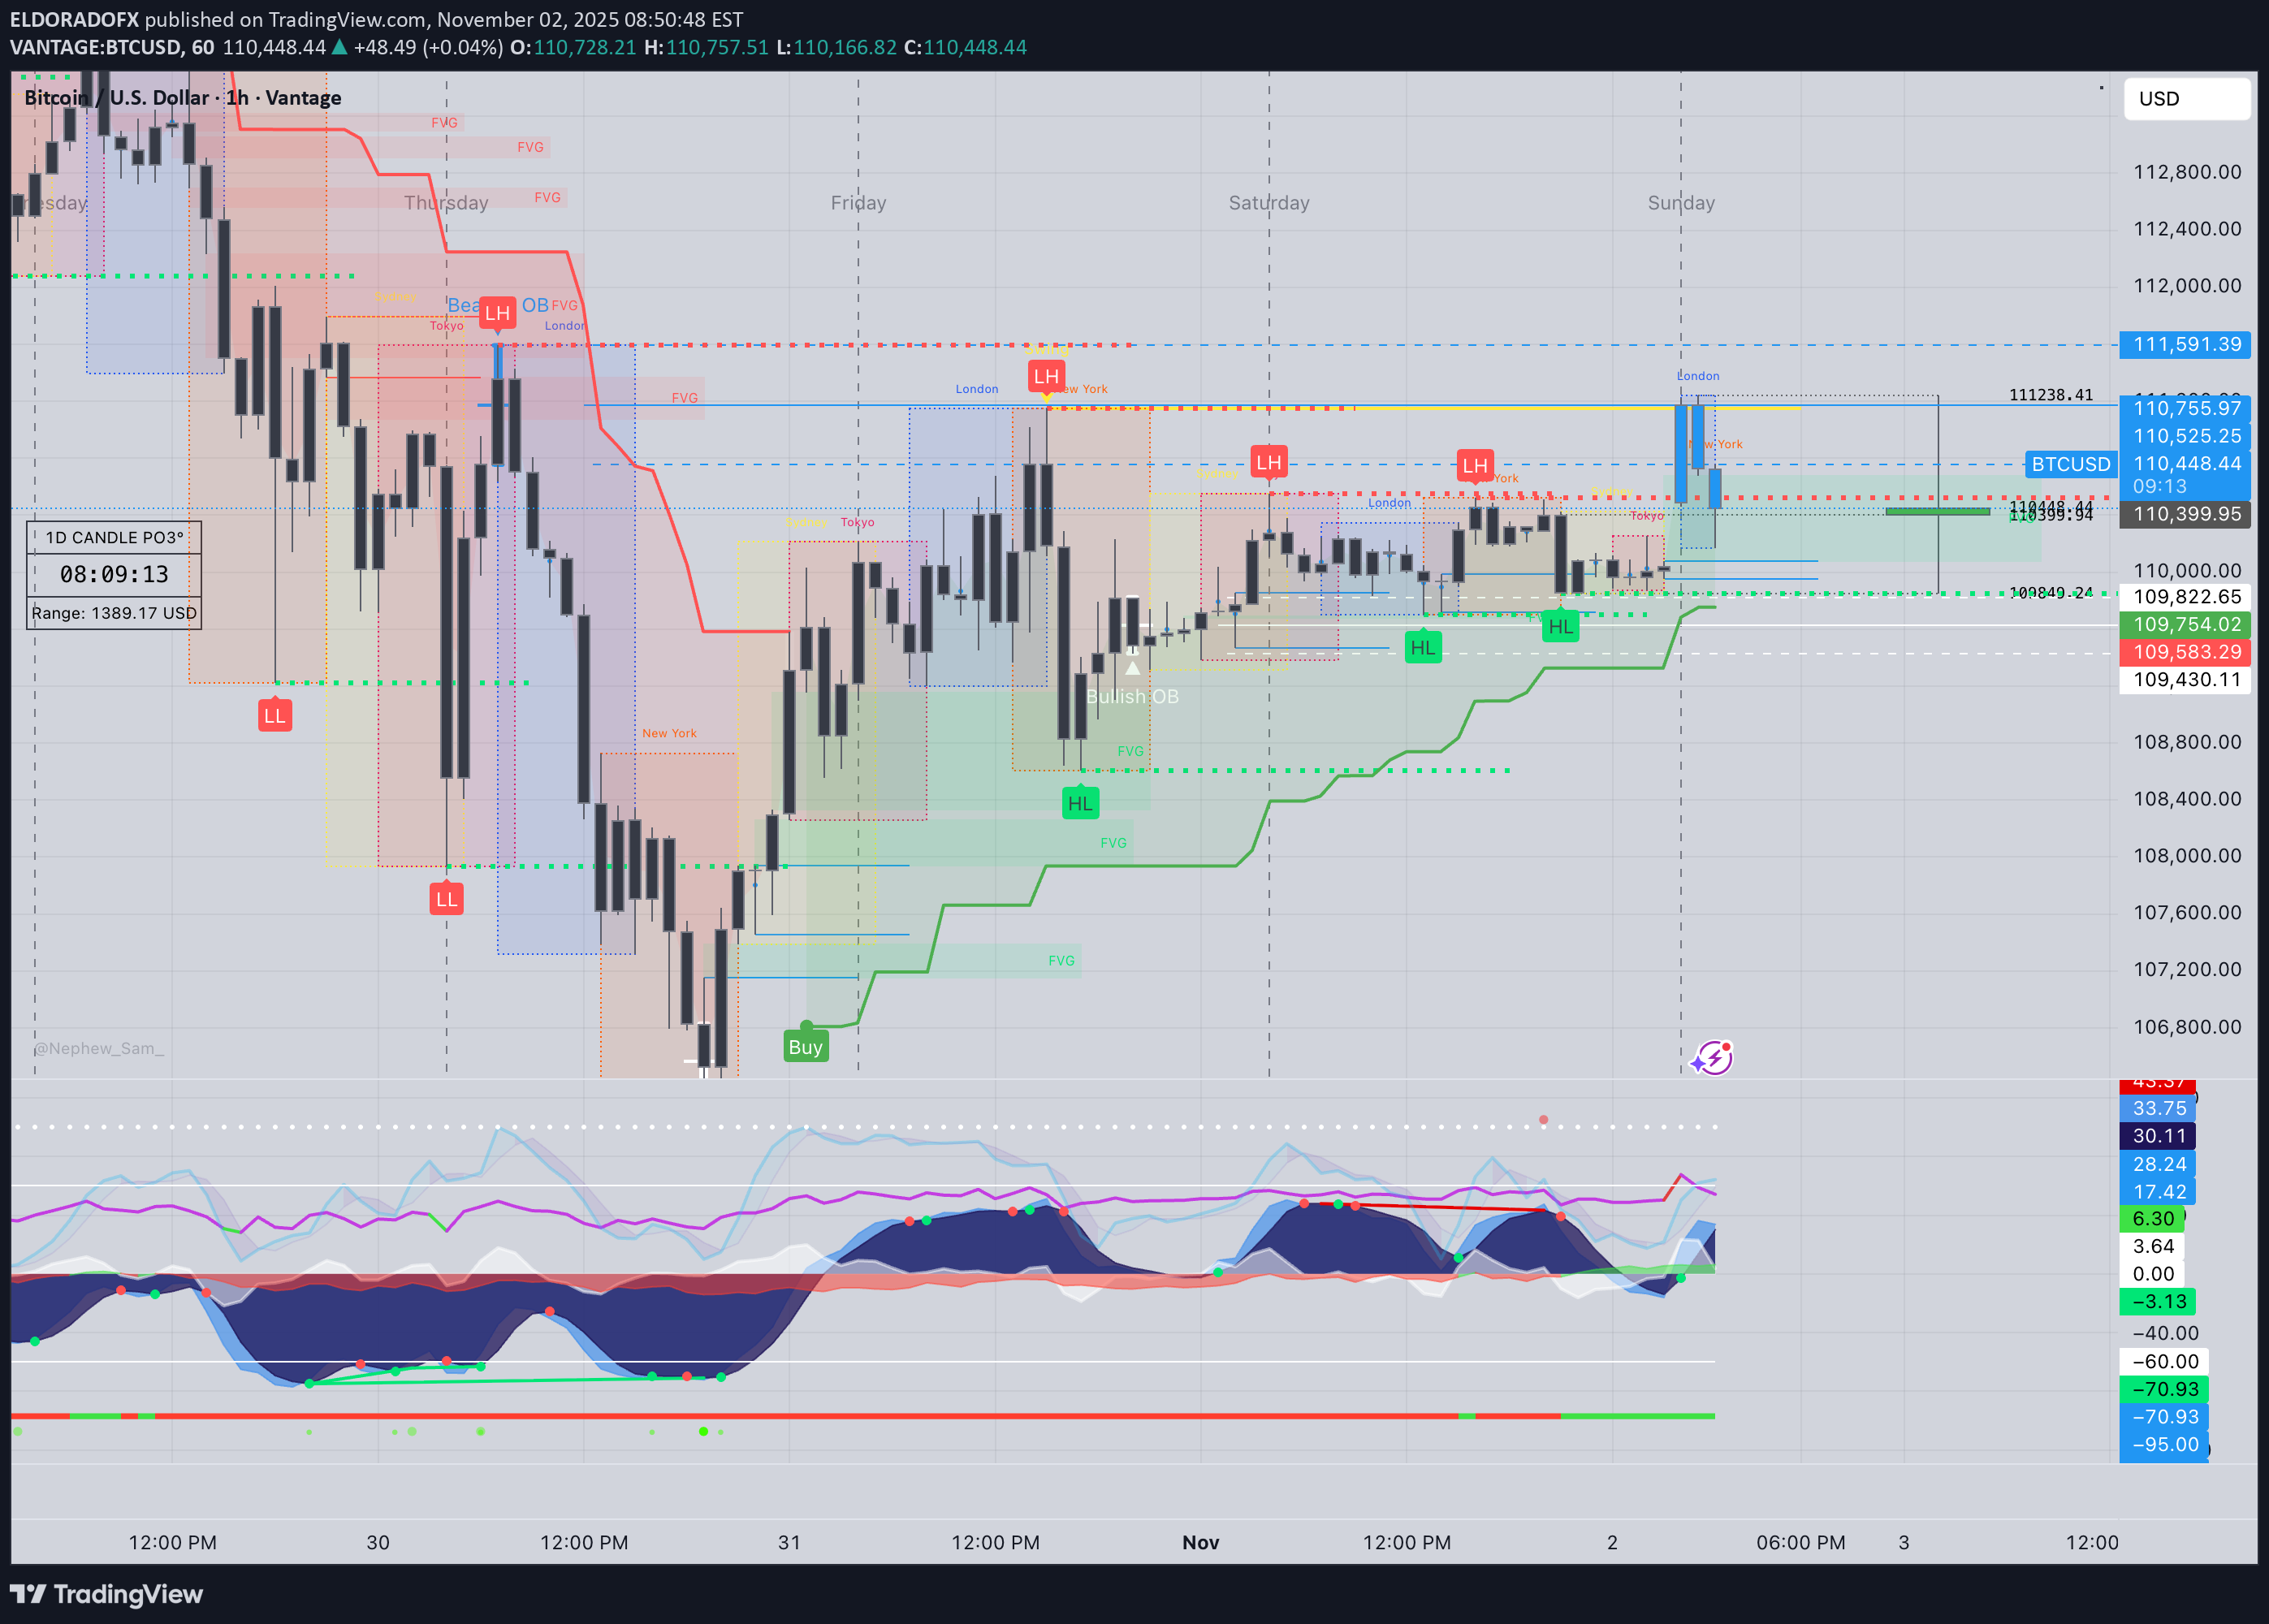
🧭 1️⃣ Market Overview Bitcoin retraced after testing the intraday resistance near 111,238, facing rejection at the upper boundary of the descending channel. Price remains supported above 110,000, respecting both the dynamic ascending trendline and 200 EMA on intraday charts. Momentum has cooled but the market still holds a mildly bullish structure unless 109,700 breaks. Volatility is expected to remain moderate heading into early-week sessions. ⸻ 📊 2️⃣ Technical Breakdown ✅ Daily (D1) •Structure: Rangebound between 108,300 and 111,800. •EMAs: Price hovering between 50 and 200 EMA, equilibrium zone. •RSI (47): Neutral – no divergence. •MACD: Histogram flattening; momentum loss after prior bullish impulse. → Interpretation: Consolidation phase, waiting for directional breakout. ✅ 1-Hour (H1) •Clean BOS from 109,600 led to impulsive rise to 111,200. •Currently retracing toward the 50 EMA and trendline support. •Key support: 110,100–109,900. → Interpretation: Market retesting support after profit-taking; potential bullish re-entry if structure holds. ✅ 15M–5M (Intraday) •Price rejecting 111,238 and forming short-term lower highs. •RSI rebounding from 35 – possible micro bullish correction. •MACD showing first red bars, indicating short-term retracement nearing exhaustion. → Interpretation: Possible liquidity sweep around 110,000 before upward continuation. ⸻ 📐 3️⃣ Fibonacci Analysis Swing Range: 109,703 → 111,238 LevelPriceObservation 38.2%110,671Minor support zone 50.0%110,470Golden mid-level + EMA confluence 61.8%110,268Trendline & structural confluence ✅ Golden Zone: 110,671 – 110,268 (high-probability buy zone) ⸻ 🎯 4️⃣ High-Probability Trade Scenarios 🟢 BUY SCENARIOS (Primary Bias) Scenario A – Golden Zone Reversal (Ideal Setup) •Entry Zone: 110,671 – 110,268 🎯 TP1 → 111,000 TP2 → 111,238 TP3 → 111,800 🛑 SL → Below 109,900 Scenario B – Breakout Continuation •Trigger: Break & retest above 111,238 🎯 TP1 → 111,800 TP2 → 112,200 TP3 → 112,800 🛑 SL → Below 110,800 ⸻ 🔻 SELL SCENARIOS (Alternative) Scenario A – Breakdown from Structure •Trigger: Break & retest below 109,700 🎯 TP1 → 109,200 TP2 → 108,600 TP3 → 108,000 🛑 SL → Above 110,200 Scenario B – Rejection from 111,200–111,400 Zone •Trigger: Bearish engulfing candle rejection. 🎯 TP1 → 110,600 TP2 → 110,000 🛑 SL → Above 111,500 ⸻ 🕐 5️⃣ Fundamental Watch •Weekend volatility lower than average; price reactive to liquidity sweeps. •DXY steady near 104.8 – neutral macro tone. •ETF accumulation flows remain supportive for mid-term trend. •Watch US macro data midweek (PMI & NFP) for volatility spikes. ⸻ ⚙️ 6️⃣ Key Technical Levels TypeLevels Resistance111,238 / 111,800 / 112,200 Support110,268 / 109,900 / 109,700 Golden Zone110,671 – 110,268 Breakout ConfirmationAbove 111,238 or Below 109,700 ⸻ 🧾 7️⃣ Analyst Summary BTC continues consolidating within a controlled retracement phase, currently resting in the Golden Zone (110,671–110,268) that aligns with the ascending trendline. Holding above this range favors bullish continuation, while a confirmed break below 109,700 would open downside space. Short-term trades favor long positions within the zone, targeting 111,200–111,800. ⸻ 📈 8️⃣ Final Bias Summary 🟢 Bullish bias above 110,200 → Targets 111,200 / 111,800 🔻 Bearish bias below 109,700 → Targets 108,800 / 108,000 ⸻