Technical analysis by ELDORADOFX about Symbol BTC on 11/4/2025
تحلیل تکنیکال بیت کوین (BTCUSD): ریزش سنگین و سطوح کلیدی فروش تا ۹۷,۰۰۰!
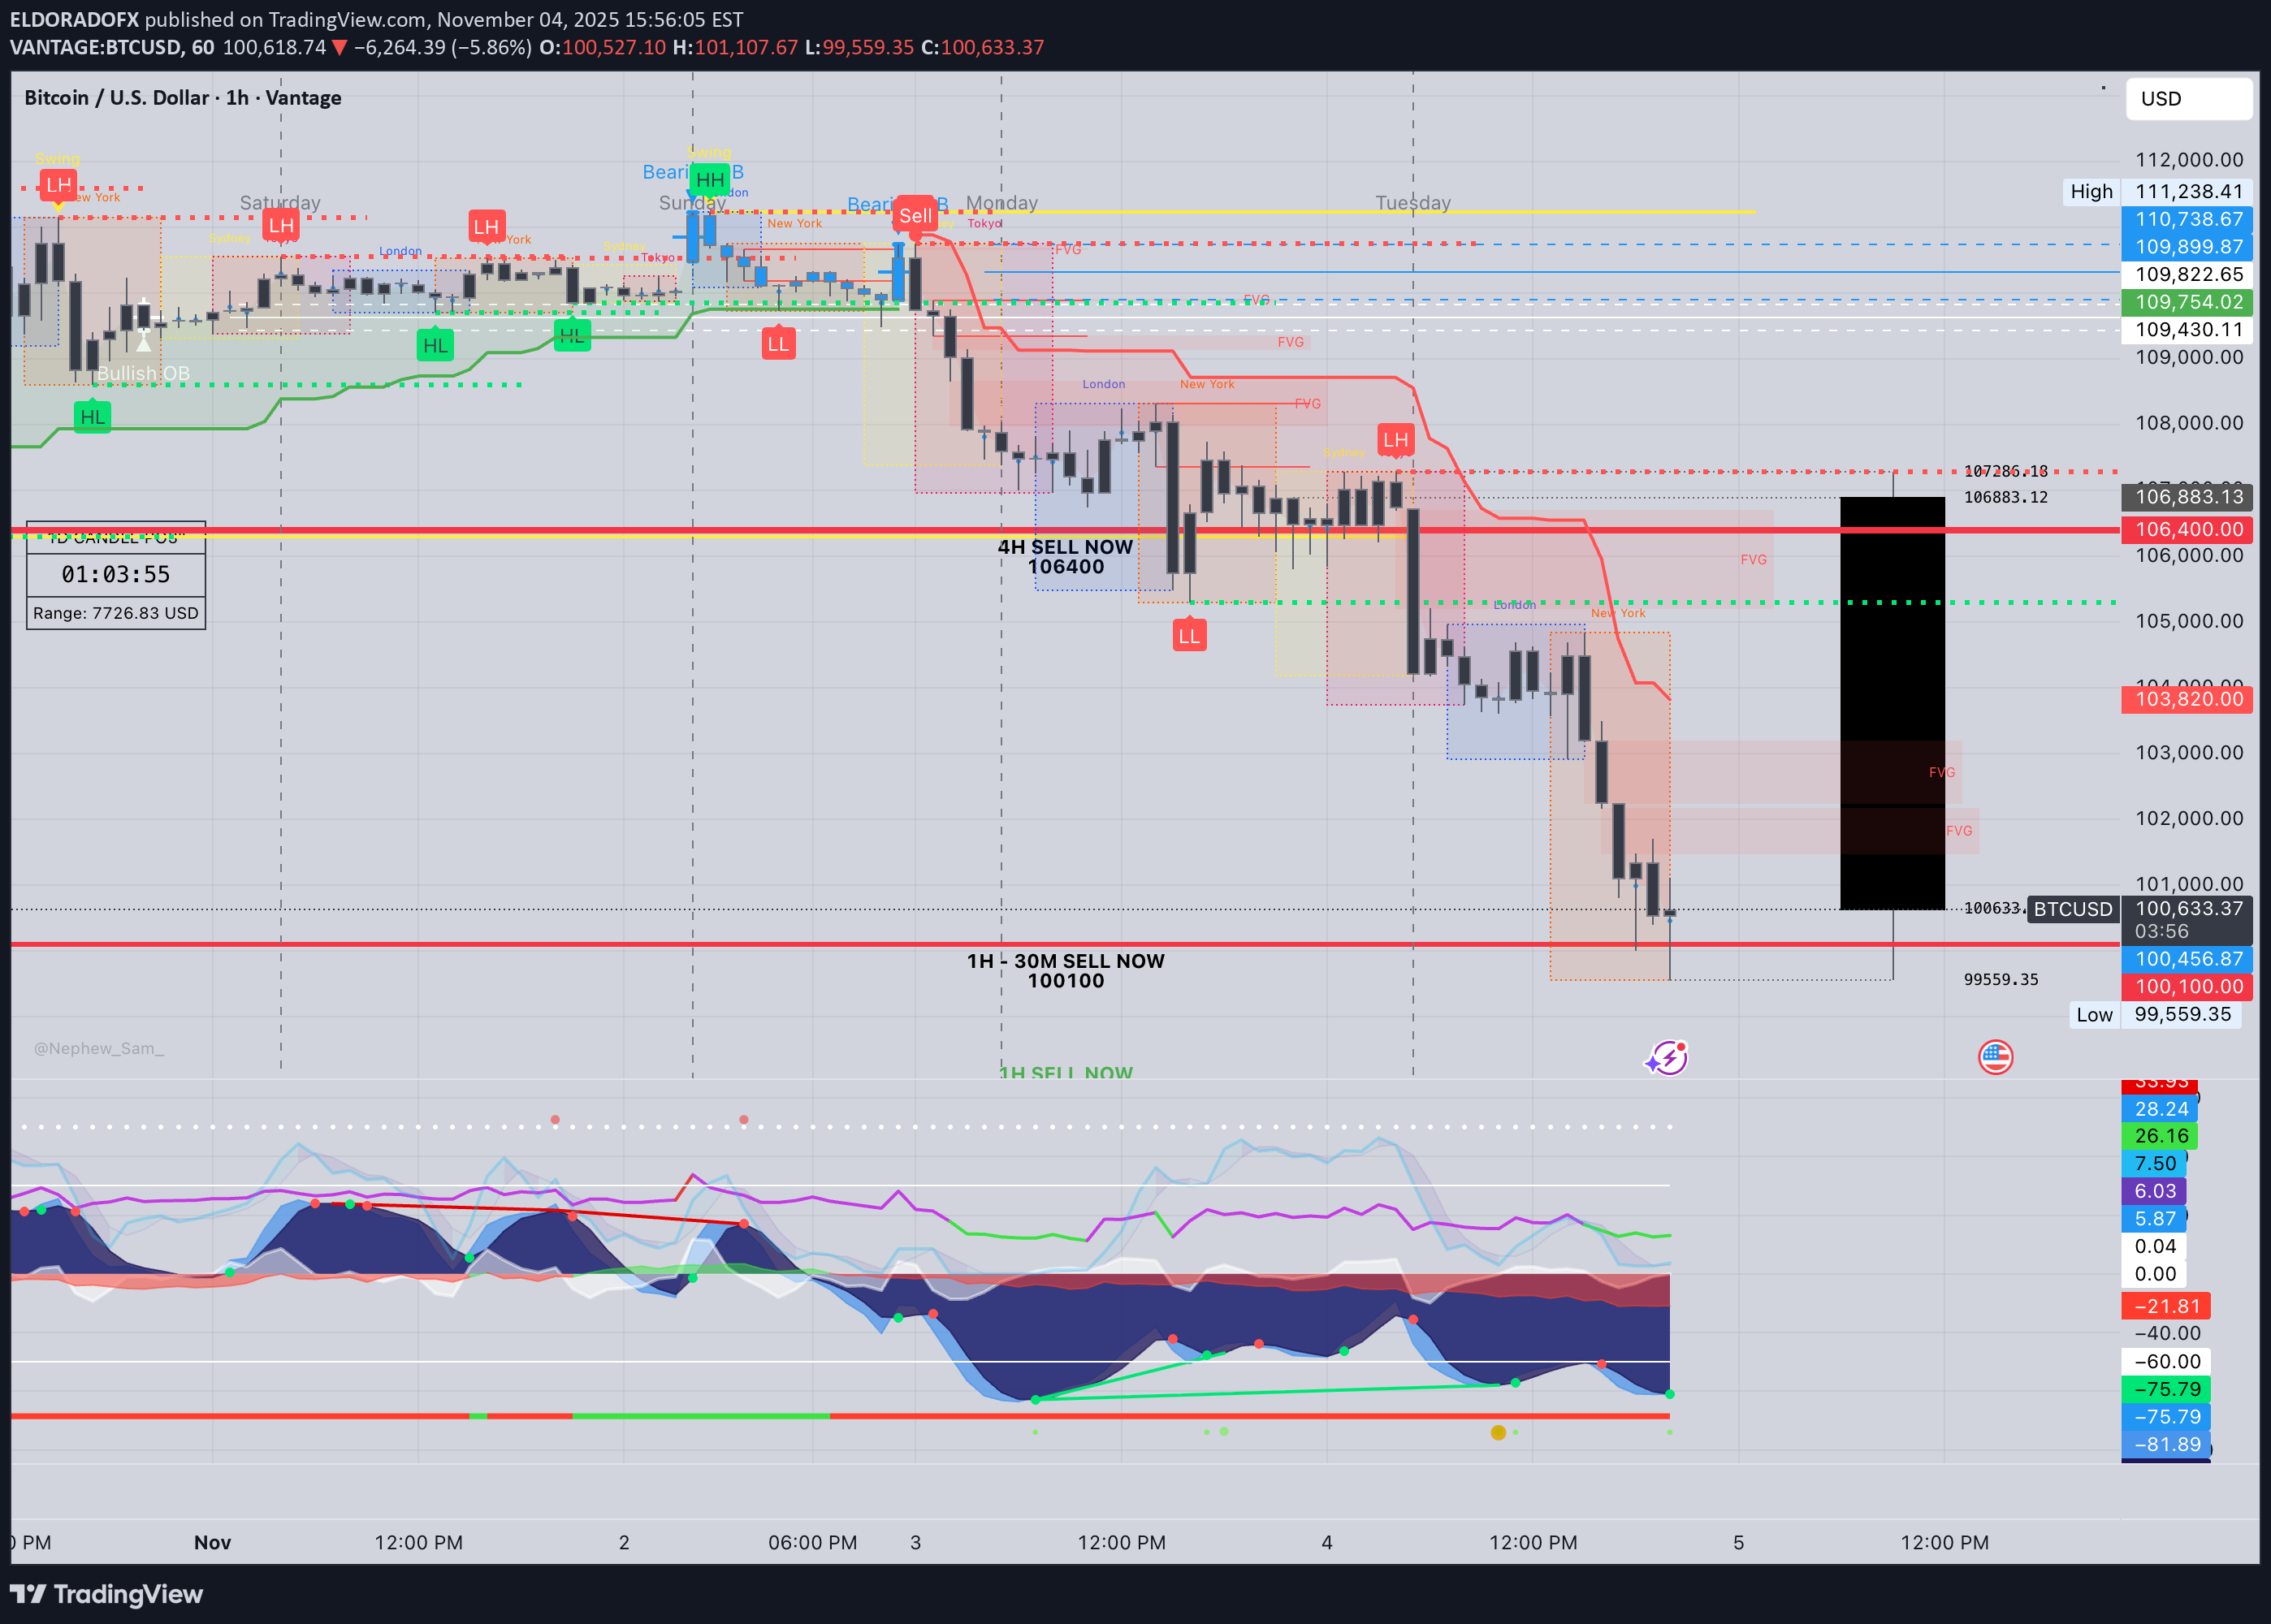
Prepared by: ElDoradoFx PREMIUM 3.0 Analyst Desk ⸻ 🧭 1️⃣ Market Overview Bitcoin has experienced a strong bearish continuation, breaking decisively below the key structural support at 108,200, confirming a shift in market sentiment. The break of structure (BOS) at 109,600 turned the mid-term bias bearish, with price now testing the psychological level at 100,000. RSI is at 32 on the daily chart, showing near-oversold conditions, but momentum remains heavy to the downside. Unless bulls reclaim 101,000–102,000, sellers are likely to continue dominating toward 98,600–97,000. ⸻ 📊 2️⃣ Technical Breakdown 🔻 Daily (D1) •Price broke below the long-term ascending trendline from August. •EMAs aligned for bearish continuation (20 < 50 < 200). •RSI 32 → weak recovery potential but still room for downside liquidity sweep. → Interpretation: Bears fully in control until 102,000 is reclaimed. 🔻 1-Hour (H1) •Descending channel intact; price rejected from supply zone 101,200–101,600. •RSI hovering around 30–40; possible minor retracement before further drop. •MACD still printing red histogram bars → bearish momentum active. → Interpretation: Look for short opportunities near resistance retests. ⚠️ 15M–5M (Intraday) •Price formed a small double bottom near 99,550, showing temporary relief bounce. •RSI rebounding, but no confirmation of reversal. •EMA50 (H1) around 101,000 acting as dynamic resistance. → Interpretation: Possible short-term correction before continuation down. ⸻ 📐 3️⃣ Fibonacci Analysis Swing Range: 104,839 → 99,559 LevelPriceObservation 38.2%101,455Minor retracement zone 50.0%102,200Key confluence with EMA50 61.8%102,950Strong resistance zone for potential short re-entry ✅ Golden Zone: 101,455 – 102,950 This is the ideal sell re-entry area if price pulls back. ⸻ 🎯 4️⃣ High-Probability Trade Scenarios 🔻 SELL SETUP (PRIMARY BIAS) Scenario A – Golden Zone Retest •Entry: 101,455–102,950 (Fibonacci + EMA confluence) 🎯 TP1 → 100,000 TP2 → 99,000 TP3 → 97,000 🛑 SL → Above 103,300 Scenario B – Continuation Breakout •Trigger: Break & retest below 99,550 🎯 TP1 → 98,600 TP2 → 97,000 TP3 → 95,800 🛑 SL → Above 100,300 ⸻ 🟢 BUY SETUP (ALTERNATIVE SCENARIO) Scenario A – Support Reversal Zone •Entry: 99,550–98,600 (if strong bullish reaction with engulfing candles) 🎯 TP1 → 101,000 TP2 → 102,000 TP3 → 103,000 🛑 SL → Below 98,200 ⸻ 🕐 5️⃣ Fundamental Watch • US yields rising and DXY strengthening above 105.2 → bearish pressure on BTC. • Market sentiment risk-off due to global equity weakness. • Watch upcoming US Unemployment & CPI data — could trigger volatility reversal. ⸻ ⚙️ 6️⃣ Key Technical Levels TypeLevels Resistance101,455 / 102,200 / 102,950 Support99,550 / 98,600 / 97,000 Golden Zone101,455 – 102,950 Breakout ConfirmationBelow 99,550 or Above 103,000 ⸻ 🧾 7️⃣ Analyst Summary BTC confirmed a bearish structure, with short-term retracements expected toward the Golden Zone (101,455–102,950) before further downside continuation. Momentum indicators still favor sellers, though oversold readings could create minor pullbacks. Until 103,000 is broken to the upside, bias remains bearish. ⸻ 📈 8️⃣ Final Bias Summary 🔻 Bearish below 102,000 → Targets 99,000 / 97,000 / 95,800 🟢 Bullish only above 103,000 → Targets 104,800 / 106,000 ⸻ — ElDoradoFx PREMIUM 3.0 Team 🚀