
DOCTOR_PIPS05
@t_DOCTOR_PIPS05

What symbols does the trader recommend buying?
Purchase History
پیام های تریدر
Filter
DOCTOR_PIPS05
تحلیل طلا (XAU/USD): طلای داغ در آستانه صعود به سوی ۴۱۰۰ دلار!
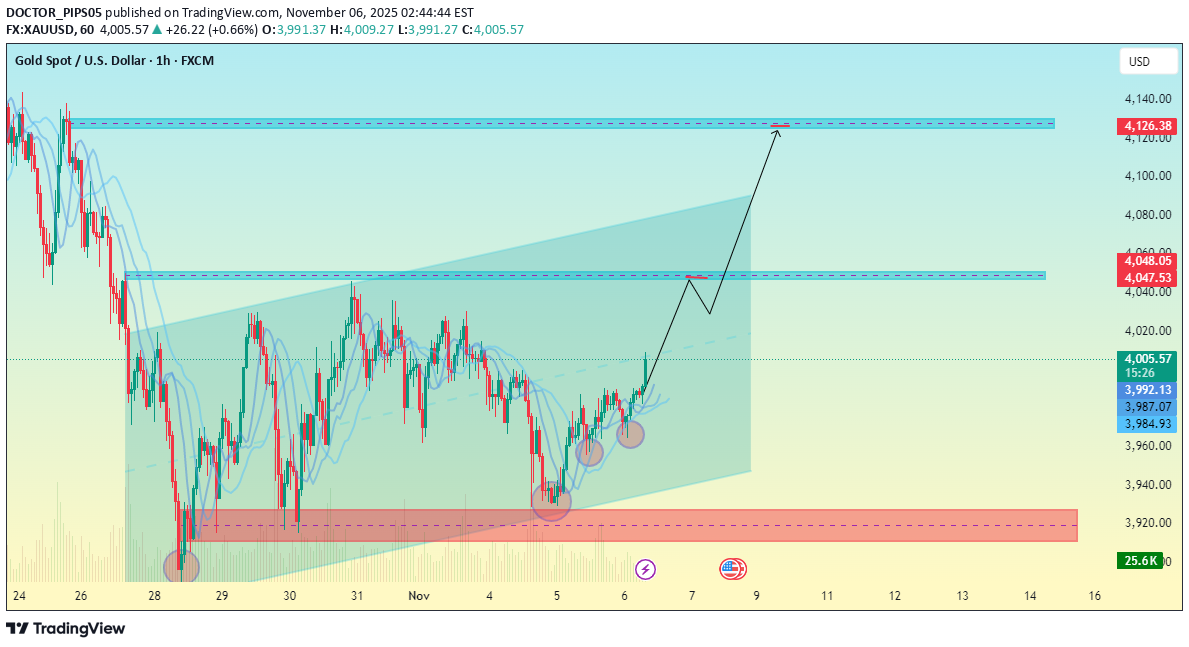
Chart Overview Current Price: Around $4,007 Structure: The chart shows a bullish reversal pattern forming after a period of sideways movement inside a channel. Key Levels Highlighted: Support Zone: Around $3,920–$3,940 (marked in pink at the bottom). This area has held price multiple times, forming a strong demand zone. First Resistance / Take Profit Zone: Near $4,045–$4,050 (middle blue box). Second Resistance / Final Target Zone: Around $4,125–$4,130 (upper blue box). 📈 Projected Move The chart suggests a bullish breakout pattern: 1. Rejection from the support near $3,920. 2. Continuation upward through mid-resistance at $4,045. 3. Final target projected near $4,125. This move aligns with a higher high and higher low structure, implying potential continuation of bullish momentum if price sustains above $4,000. ⚠️ Watch Levels Invalidation: A break and close below $3,920 could invalidate the bullish scenario and reintroduce bearish pressure. Confirmation: A strong close above $4,050 would confirm bullish continuation toward the $4,125 area.
DOCTOR_PIPS05
تحلیل DOT/USDT: آیا فرصت خرید در حمایت $2.45 شکل گرفته است؟ (پیشبینی صعود تا $3.00)
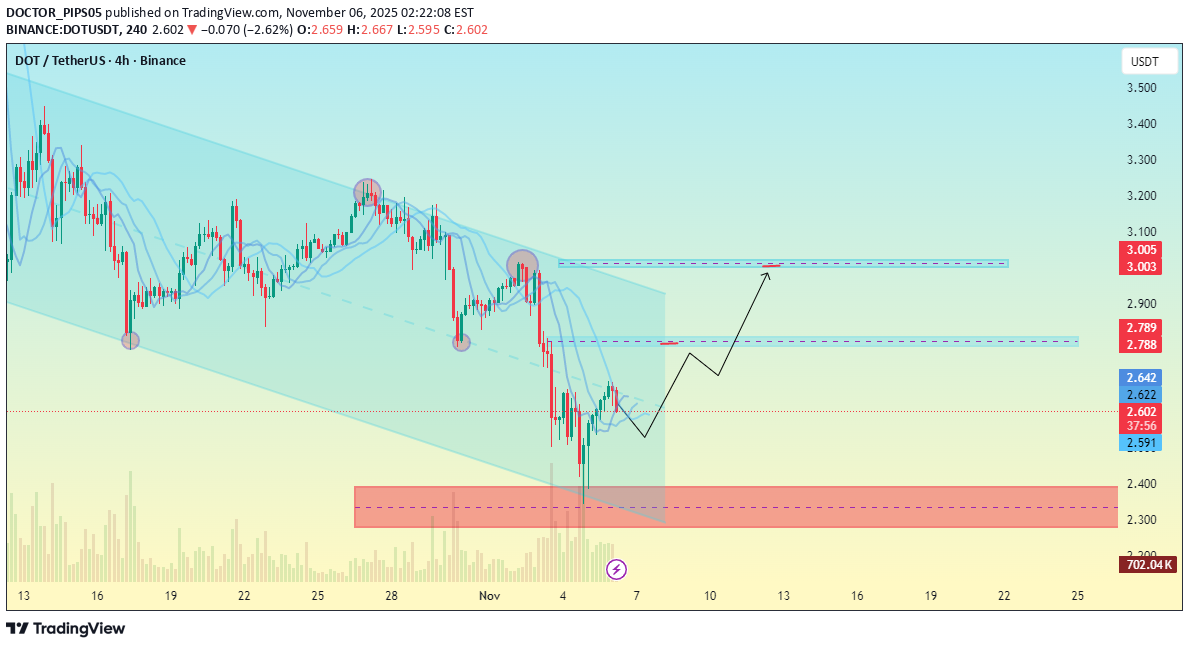
Overall Structure: The price has been moving within a descending channel, forming lower highs and lower lows — a clear downtrend pattern. Current Price Zone: Around $2.60, just above a recent swing low. Support Zone (Pink Box): Between approximately $2.35 – $2.45, marking a strong demand area where price previously bounced. Projection: The chart indicates a potential bullish correction or reversal from the lower boundary of the channel. The drawn projection suggests a move upward toward the $2.78–$2.79 resistance first, and then a potential extension to $3.00–$3.01, which aligns with a previous high and the upper channel boundary. Key Resistance Levels: $2.78–$2.79: Near-term resistance, possible reaction zone. $3.00–$3.01: Strong resistance zone; a breakout here could confirm trend reversal. Key Support Levels: $2.59–$2.60: Immediate local support. $2.35–$2.45: Stronger support zone (marked in pink). 📊 Summary: The analysis suggests a potential bullish rebound from the support region toward $2.78 and possibly $3.00,** provided the price holds above $2.50. If it breaks below $2.45, the bullish outlook would weaken.
DOCTOR_PIPS05
تحلیل تکنیکال DOT/USDT: آماده ریزش به کدام کف قیمتی؟

Overall Structure The chart shows a descending channel — price is respecting both upper and lower trendline boundaries. The current price is around $2.79, near the midrange of the channel. 🟣 Key Zone (Resistance) The pink/red zone between $3.20–$3.30 is a major supply/resistance area. Price has reacted there multiple times before dropping. The arrows suggest that you expect another rejection from that zone. 🔻 Bearish Scenario (Your Projection) The projected move shows: 1. A pullback toward $3.00–$3.20, likely into resistance. 2. Then a reversal downward following the channel trend. 3. First target: $2.63–$2.64 zone (local support area). 4. Extended target: $2.37–$2.37 zone, near the lower boundary of the channel. 📊 Market Context As long as price stays below $3.00–$3.20, momentum favors the downside. Breaking above $3.30 with strong volume could invalidate the bearish setup and open room for $3.50+. ⚙️ Summary LevelTypeExpectation $3.20–$3.30Resistance / SupplyPotential rejection zone $2.63–$2.64Support 1First bearish target $2.37Support 2Final bearish target Above $3.30BreakoutTrend reversal possibleGood analysis seems guys my 1st target completed and further market reached near to my final target.
DOCTOR_PIPS05
پیشبینی صعودی بیت کوین: آیا BTC به هدف ۱۲۲ هزار دلاری میرسد؟
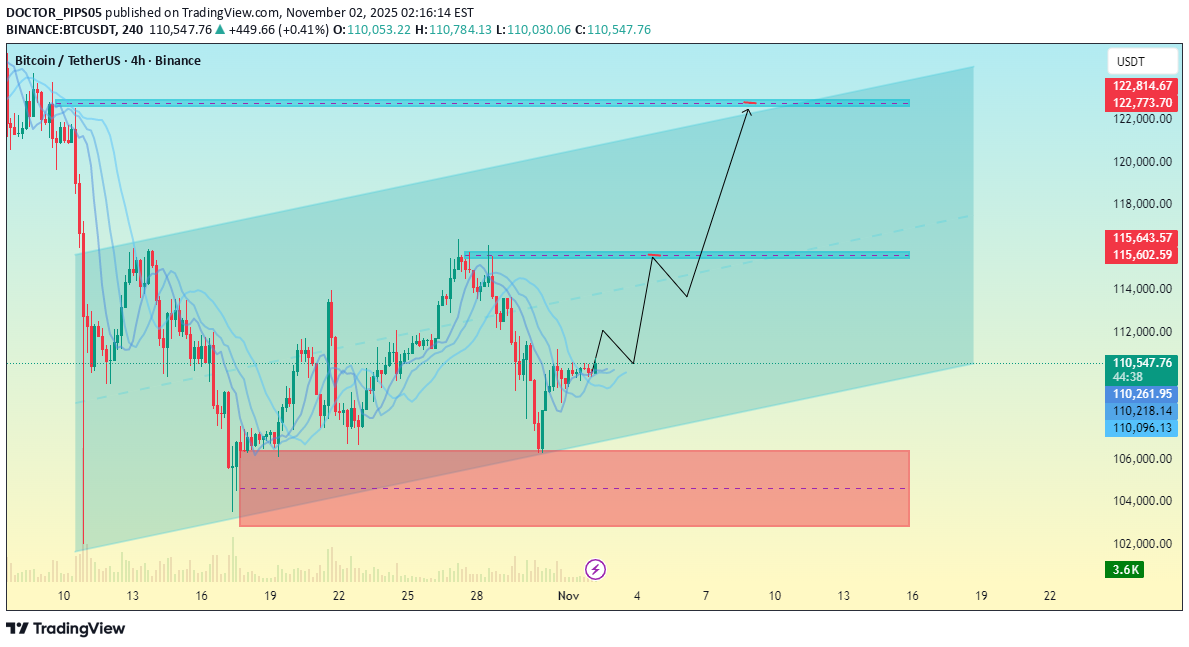
Price: Around $110,600, trading within an upward ascending channel (marked in blue). Support zone: The pink box roughly around $104,000–106,000, showing a strong demand area or previous accumulation zone. Current structure: The recent bounce from that pink zone suggests a potential higher low, possibly starting a new upward leg. Resistance zones: Near-term resistance: Around $115,000–115,600, where you’ve drawn a mid-channel horizontal blue zone — this might act as the first test area. Major target/resistance: Around $122,000–124,000, at the upper channel line — likely your final upside target. Your projected path shows a bullish wave structure, expecting BTC to retest $115K, consolidate, and then continue toward $122K. In short: ✅ Bullish bias while above $106K support. ⚠️ Watch reaction near $115K — rejection there could cause a short-term pullback before continuation. 📈 Break and hold above $115.6K would confirm momentum toward the $122K channel top.
DOCTOR_PIPS05
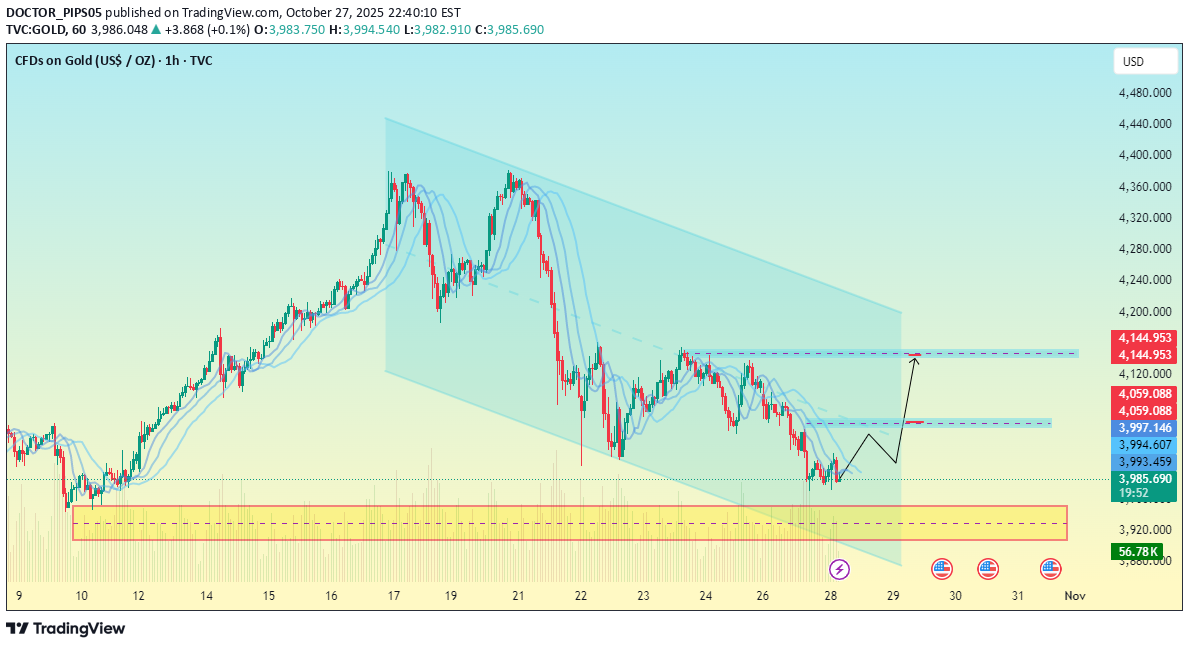
تحلیل طلای امروز: خیز قدرتمند به سمت ۴۱۵۰ دلار | فرصت خرید طلا (XAU/USD)
Current Overview Price: Around $4,009 at the time of the chart. The chart shows a bullish recovery after touching the support zone near $3,884 (yellow box). There’s a clear downward channel that has been broken to the upside — signaling a potential trend reversal. 🔹 Key Zones Support Zone: 🟡 $3,880 – $3,900 → Strong demand zone where buyers stepped in. Immediate Resistance: 🔵 $4,083 – $4,100 → Price may retest this area before continuation. Major Target Zone: 🔵 $4,150 – $4,160 → Marked as the next bullish target area. 🔹 Pattern & Structure The chart depicts a potential bullish continuation pattern: 1. Break of the descending channel. 2. Retest expected around $4,083 (support-turned-resistance). 3. Continuation toward $4,150+. This suggests traders might be looking for: Buy entries: Near $4,000–$4,020 after minor pullbacks. Target: $4,150–$4,160. Stop-loss: Below $3,880 support area. 🔹 Indicators Bollinger Bands: Price is moving toward the upper band — momentum looks bullish. Volume: Rising slightly, indicating buying pressure building. --- 📊 Summary Bias: Bullish (short-term). Next key resistance: $4,083 → $4,150. Critical support: $3,880. If price closes above $4,083, expect a continuation toward $4,150–$4,160. A break below $3,880 would invalidate the bullish setup and shift focus back to bearish targets.
DOCTOR_PIPS05
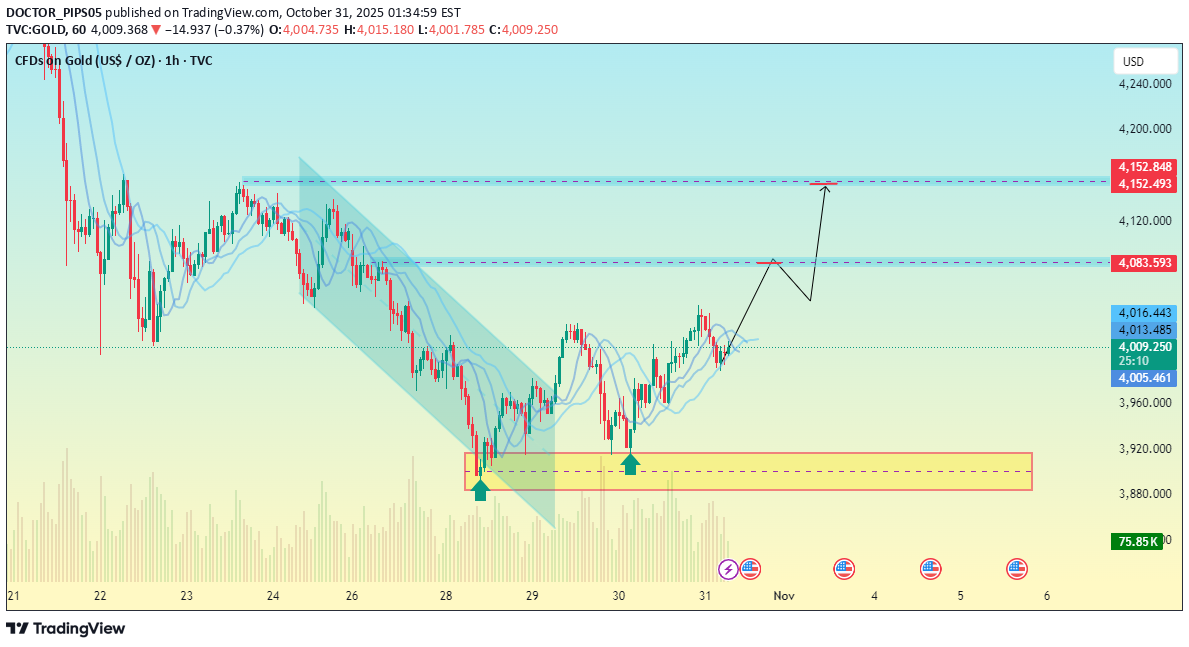
تحلیل طلا (XAU/USD) در تایم فریم ۱ ساعته: آیا کانال نزولی شکسته میشود یا حمایت ۳۹۵۰ حفظ میشود؟
imeframe: 1H Current Price: Around $3,991 Overall Structure: A descending channel pattern (price making lower highs and lower lows). Highlighted Zones: Yellow Zone (bottom): Strong support area — previous accumulation zone where buyers stepped in before. Blue Zones: Short-term resistance levels, marking potential profit-taking or pullback points. 📊 Technical Interpretation 1. Support Zone (3,950 – 3,980): Price bounced off this zone, forming a potential double bottom or reversal structure. Buyers defending this area indicates strong demand. 2. First Target / Resistance: Around 4,080 – 4,100, shown by the first blue line. Could see some pullback here if momentum weakens. 3. Second Target: Around 4,140 – 4,160, near the upper boundary of the channel. This aligns with your projected path (the “V-shaped” move on the chart). 4. Channel Dynamics: The descending channel is intact, so unless a breakout above the upper trendline occurs, the overall trend remains bearish. A break above 4,160 would indicate a potential trend reversal to bullish. 🧭 Likely Scenarios Bullish Case: Bounce from support → retest 4,100 → consolidation → continuation toward 4,160. Bearish Case: Failure to hold above 3,980 → breakdown toward 3,920–3,900 support zone. ⚙️ Trading Perspective Buy Zone: 3,970 – 3,990 (if support holds) Targets: 4,100 / 4,160 Stop Loss: Below 3,950 to protect from deeper downside.
DOCTOR_PIPS05
تحلیل DOT/USDT: سقوط به کدام سطح حمایتی در کانال نزولی؟
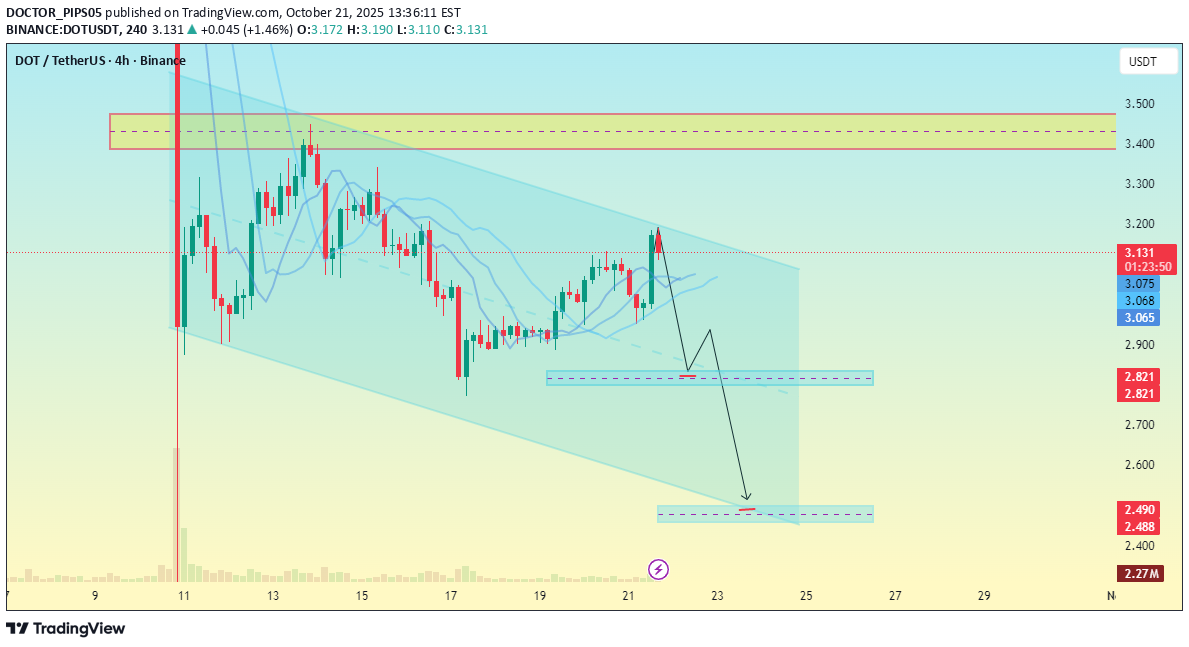
he chart shows a descending channel pattern (bearish structure). Current price is around 3.14 USDT. There’s a resistance zone near 3.40–3.45 USDT (highlighted in yellow), aligning with the channel’s upper boundary. You’ve drawn two potential demand zones: First around 2.85–2.80 USDT Second (deeper support) around 2.50–2.45 USDT The projected price path shows a possible rejection from the upper channel, continuation lower, and a drop toward those demand zones. Technical summary: 🔹 Bias: Bearish short-term 🔹 Structure: Price respecting a descending channel 🔹 Confirmation: A break below ~3.00 could accelerate a move to 2.85 or 2.50 🔹 Invalidation: A breakout and close above 3.45 would invalidate the bearish setup and may start a trend reversal.
DOCTOR_PIPS05
تحلیل تکنیکال اتریوم (ETH/USD): مسیر صعودی تا ۴۶۶۰ دلار یا سقوط زیر ۳۷۵۰ دلار؟
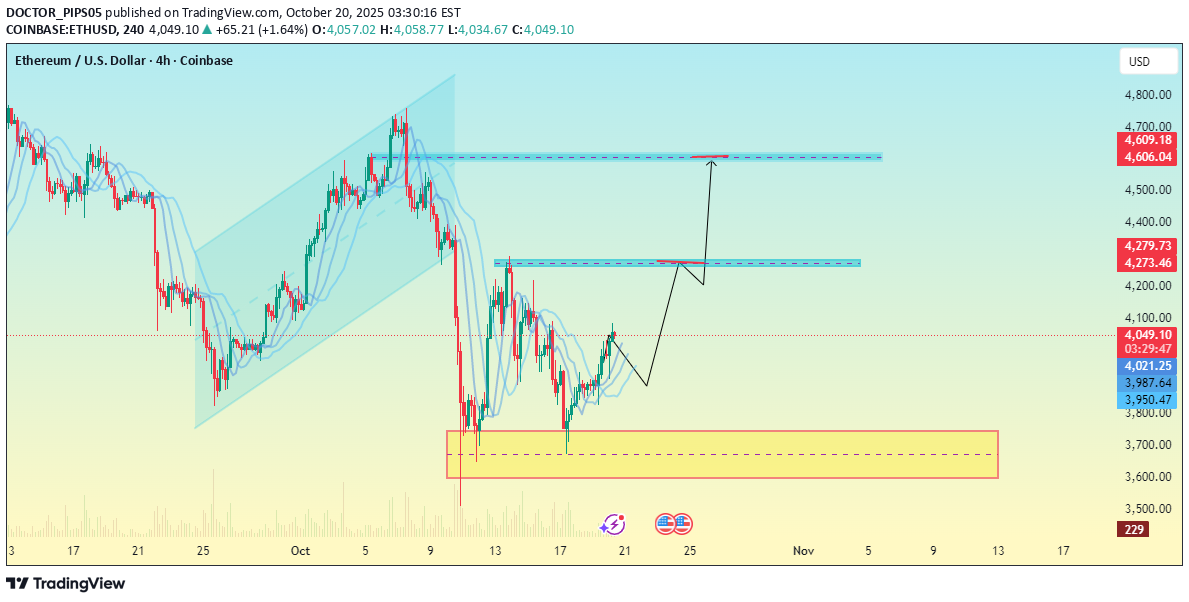
Current Price Zone: Around $3,997, with a small upward move visible. Support Area (yellow zone): Roughly $3,600 – $3,750, showing the last strong demand zone where price previously reversed. First Resistance Zone (blue box): Around $4,270 – $4,280, where price may face initial selling pressure. Second Target Zone (upper blue box): Near $4,600 – $4,660, which appears to be your main bullish target. Projected Path: The drawn arrows suggest a bullish structure, expecting a short pullback from current levels before continuation upward — a potential break of structure and retest setup. Technical View: The chart implies a potential bullish reversal off the yellow support zone. If ETH holds above $3,900–$3,950, the next logical upside targets are $4,270 and $4,660. A drop below $3,750 would invalidate this bullish scenario and reopen the door to further downside.
DOCTOR_PIPS05
تحلیل طلا (XAU/USD) روی نمودار ۴ ساعته: آمادهسازی برای ریزش یا ادامه صعود؟ (سطوح کلیدی)
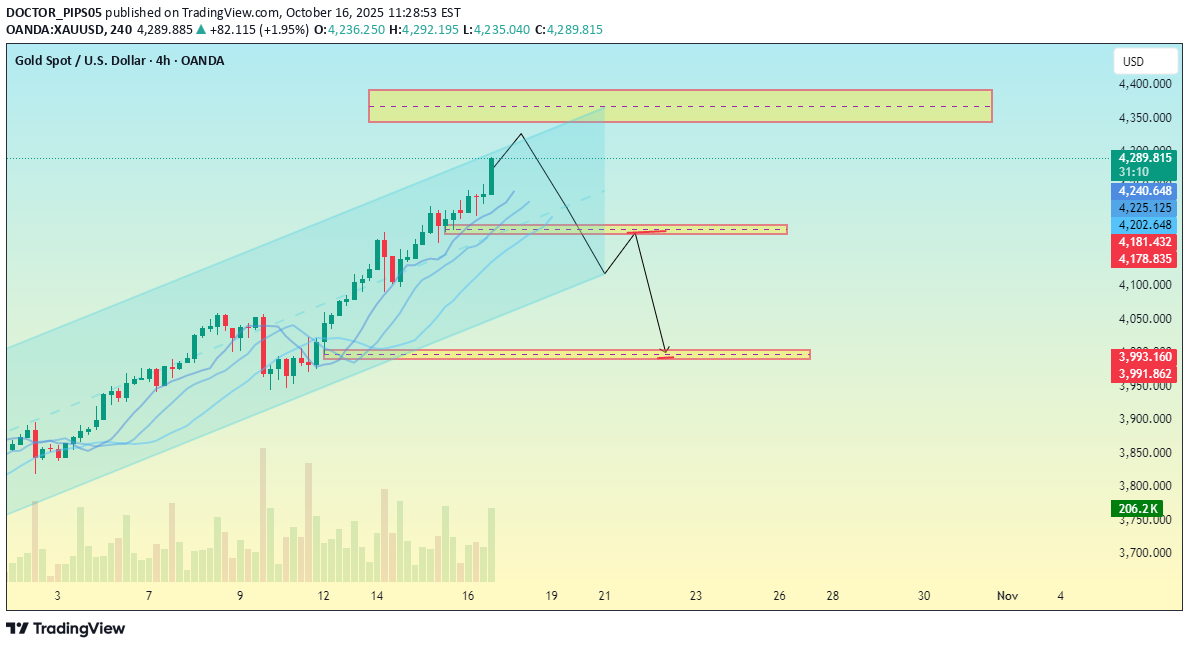
Chart Structure The chart shows a strong upward channel — price is trending upward within a clearly defined parallel channel. The price is currently near the upper boundary of this ascending channel, suggesting potential overextension or a possible retracement zone. 🟨 Highlighted Zones 1. Top yellow box (around 4,389 – 4,360): Likely a resistance zone / potential reversal area. The projection arrow from this zone indicates a possible pullback from this level. 2. Middle yellow box (around 4,178): Appears to be a support or retest zone — possibly where the price could pull back to after rejecting the upper channel. 3. Bottom yellow box (around 3,991): Indicates a deeper support target if the correction continues — possibly a bearish continuation target if the mid-support fails. 📉 Scenario Illustrated The chart seems to outline a potential bearish setup after the current bullish rally: 1. Price reaches the upper yellow resistance zone. 2. Pullback begins toward mid-support (4,178). 3. If momentum continues down, it might reach the lower target (around 3,991). ⚙️ Summary of Analysis Trend: Bullish overall (still inside the ascending channel). Short-term Outlook: Possible pullback or correction after testing upper resistance. Key Levels: Resistance: ~4,389 Support 1: ~4,178 Support 2: ~3,991Good analysis seems guys my 1st target completed and further market reached near to my final target.
DOCTOR_PIPS05
تحلیل تکنیکال طلا (XAU/USD): پیشبینی صعود قوی و اهداف قیمتی کلیدی در نمودار 5 دقیقهای
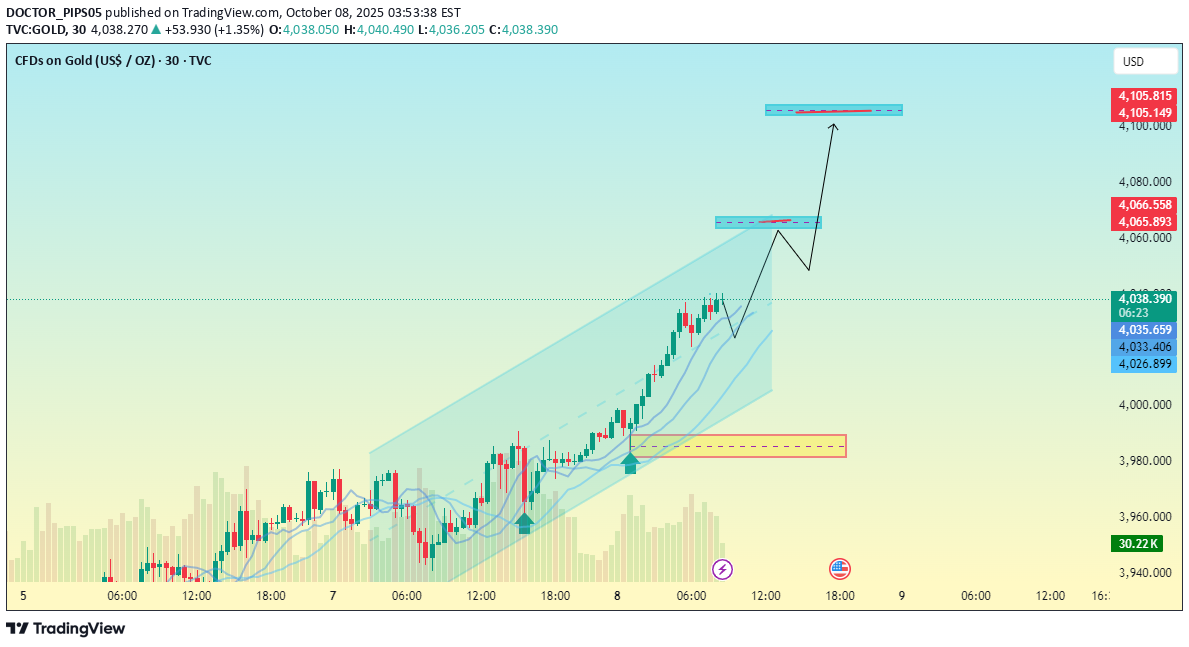
Current Price: Around $4,035 (as of the screenshot). Trend: Clearly in a strong bullish trend, making higher highs and higher lows. Marked Zones: Demand zone (support) around $3,986 – $4,000, shown in yellow at the bottom — likely your bullish base. First target/supply zone near $4,057 – $4,058 (blue box in the middle). Second target/supply zone around $4,101 – $4,102 (blue box at the top). Projection: The drawing indicates an expected retracement (minor dip toward $4,020–$4,025 area) before a continuation upward toward the first target zone ($4,057), and then potentially to the second target ($4,101). Summary of Setup: Bias: Bullish continuation Possible Entry: Around $4,020 – $4,025 (after the retracement) Targets: TP1: $4,057 TP2: $4,101 Invalidation (stop-loss idea): Below $4,000 – $3,986 zone
Disclaimer
Any content and materials included in Sahmeto's website and official communication channels are a compilation of personal opinions and analyses and are not binding. They do not constitute any recommendation for buying, selling, entering or exiting the stock market and cryptocurrency market. Also, all news and analyses included in the website and channels are merely republished information from official and unofficial domestic and foreign sources, and it is obvious that users of the said content are responsible for following up and ensuring the authenticity and accuracy of the materials. Therefore, while disclaiming responsibility, it is declared that the responsibility for any decision-making, action, and potential profit and loss in the capital market and cryptocurrency market lies with the trader.