Technical analysis by DOCTOR_PIPS05 about Symbol ETH: Buy recommendation (10/20/2025)

DOCTOR_PIPS05
تحلیل تکنیکال اتریوم (ETH/USD): مسیر صعودی تا ۴۶۶۰ دلار یا سقوط زیر ۳۷۵۰ دلار؟
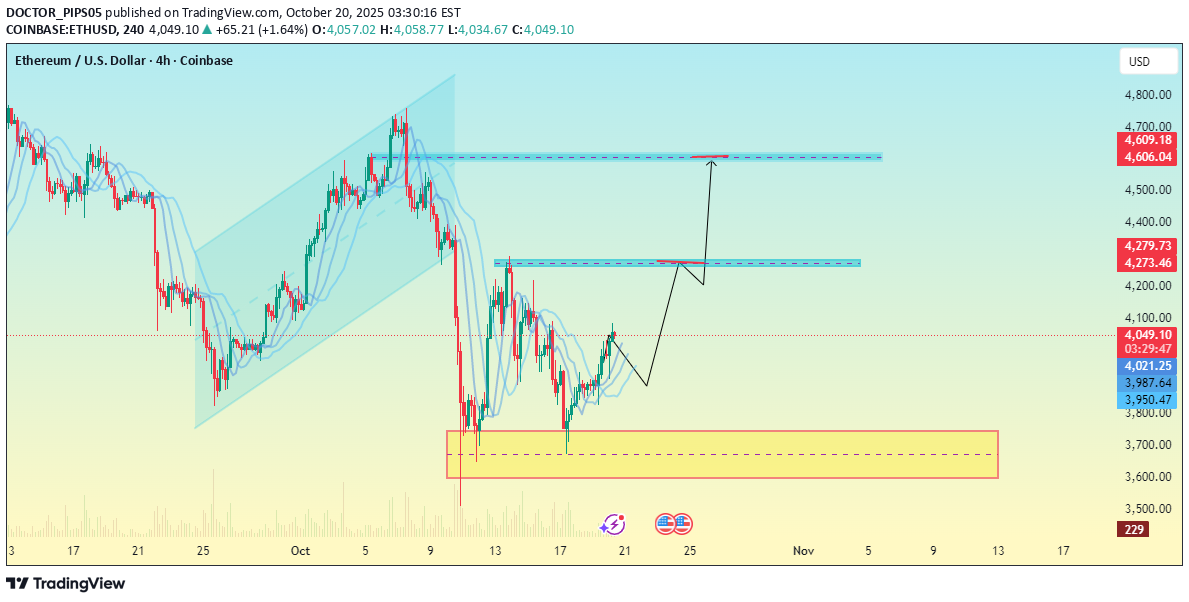
Current Price Zone: Around $3,997, with a small upward move visible. Support Area (yellow zone): Roughly $3,600 – $3,750, showing the last strong demand zone where price previously reversed. First Resistance Zone (blue box): Around $4,270 – $4,280, where price may face initial selling pressure. Second Target Zone (upper blue box): Near $4,600 – $4,660, which appears to be your main bullish target. Projected Path: The drawn arrows suggest a bullish structure, expecting a short pullback from current levels before continuation upward — a potential break of structure and retest setup. Technical View: The chart implies a potential bullish reversal off the yellow support zone. If ETH holds above $3,900–$3,950, the next logical upside targets are $4,270 and $4,660. A drop below $3,750 would invalidate this bullish scenario and reopen the door to further downside.