Technical analysis by DOCTOR_PIPS05 about Symbol PAXG: Buy recommendation (10/31/2025)

DOCTOR_PIPS05
تحلیل طلای امروز: خیز قدرتمند به سمت ۴۱۵۰ دلار | فرصت خرید طلا (XAU/USD)
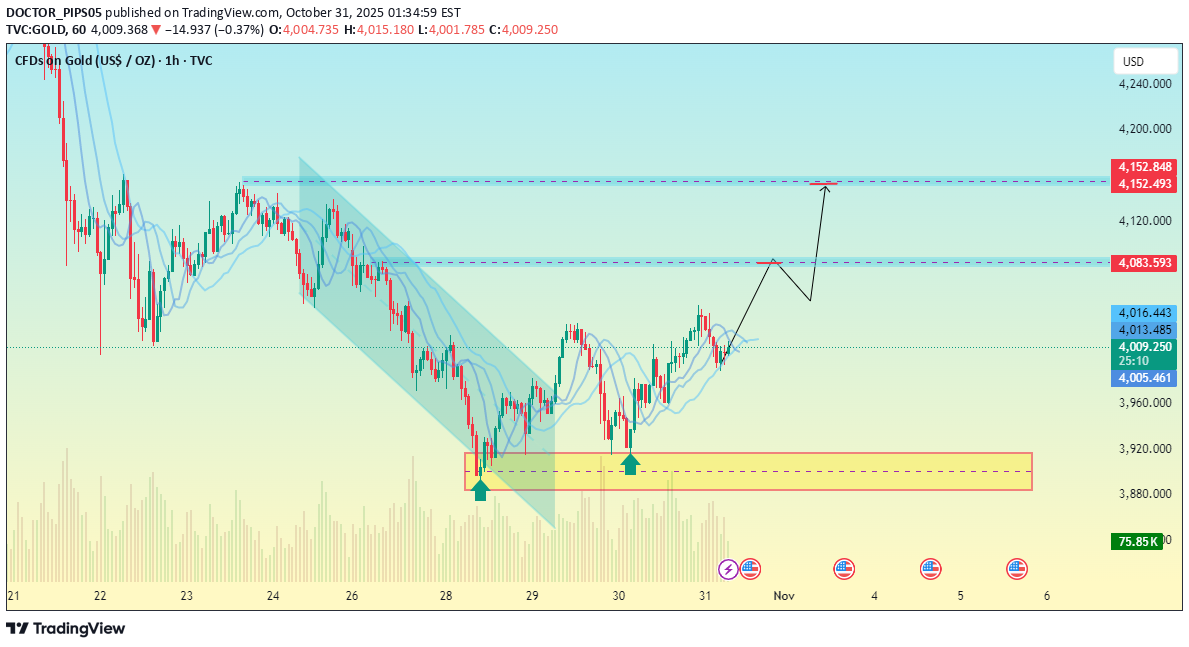
Current Overview Price: Around $4,009 at the time of the chart. The chart shows a bullish recovery after touching the support zone near $3,884 (yellow box). There’s a clear downward channel that has been broken to the upside — signaling a potential trend reversal. 🔹 Key Zones Support Zone: 🟡 $3,880 – $3,900 → Strong demand zone where buyers stepped in. Immediate Resistance: 🔵 $4,083 – $4,100 → Price may retest this area before continuation. Major Target Zone: 🔵 $4,150 – $4,160 → Marked as the next bullish target area. 🔹 Pattern & Structure The chart depicts a potential bullish continuation pattern: 1. Break of the descending channel. 2. Retest expected around $4,083 (support-turned-resistance). 3. Continuation toward $4,150+. This suggests traders might be looking for: Buy entries: Near $4,000–$4,020 after minor pullbacks. Target: $4,150–$4,160. Stop-loss: Below $3,880 support area. 🔹 Indicators Bollinger Bands: Price is moving toward the upper band — momentum looks bullish. Volume: Rising slightly, indicating buying pressure building. --- 📊 Summary Bias: Bullish (short-term). Next key resistance: $4,083 → $4,150. Critical support: $3,880. If price closes above $4,083, expect a continuation toward $4,150–$4,160. A break below $3,880 would invalidate the bullish setup and shift focus back to bearish targets.