Technical analysis by DOCTOR_PIPS05 about Symbol PAXG: Sell recommendation (10/16/2025)

DOCTOR_PIPS05
تحلیل طلا (XAU/USD) روی نمودار ۴ ساعته: آمادهسازی برای ریزش یا ادامه صعود؟ (سطوح کلیدی)
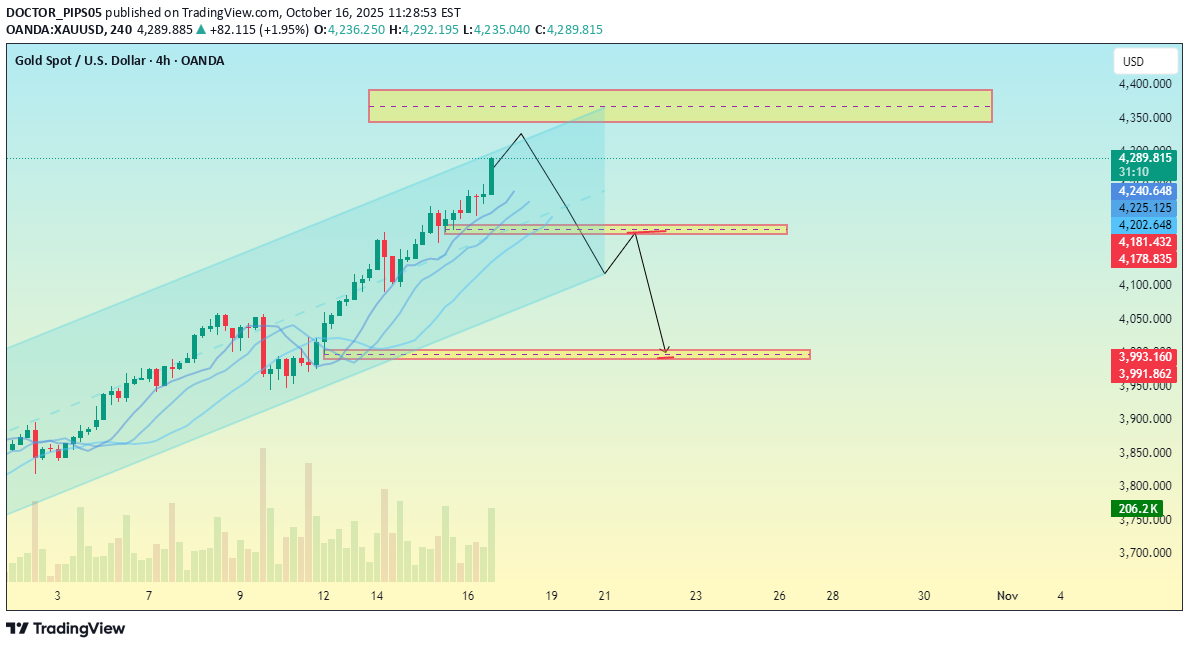
Chart Structure The chart shows a strong upward channel — price is trending upward within a clearly defined parallel channel. The price is currently near the upper boundary of this ascending channel, suggesting potential overextension or a possible retracement zone. 🟨 Highlighted Zones 1. Top yellow box (around 4,389 – 4,360): Likely a resistance zone / potential reversal area. The projection arrow from this zone indicates a possible pullback from this level. 2. Middle yellow box (around 4,178): Appears to be a support or retest zone — possibly where the price could pull back to after rejecting the upper channel. 3. Bottom yellow box (around 3,991): Indicates a deeper support target if the correction continues — possibly a bearish continuation target if the mid-support fails. 📉 Scenario Illustrated The chart seems to outline a potential bearish setup after the current bullish rally: 1. Price reaches the upper yellow resistance zone. 2. Pullback begins toward mid-support (4,178). 3. If momentum continues down, it might reach the lower target (around 3,991). ⚙️ Summary of Analysis Trend: Bullish overall (still inside the ascending channel). Short-term Outlook: Possible pullback or correction after testing upper resistance. Key Levels: Resistance: ~4,389 Support 1: ~4,178 Support 2: ~3,991Good analysis seems guys my 1st target completed and further market reached near to my final target.