Technical analysis by DOCTOR_PIPS05 about Symbol DOT: Buy recommendation (11/6/2025)

DOCTOR_PIPS05
تحلیل DOT/USDT: آیا فرصت خرید در حمایت $2.45 شکل گرفته است؟ (پیشبینی صعود تا $3.00)
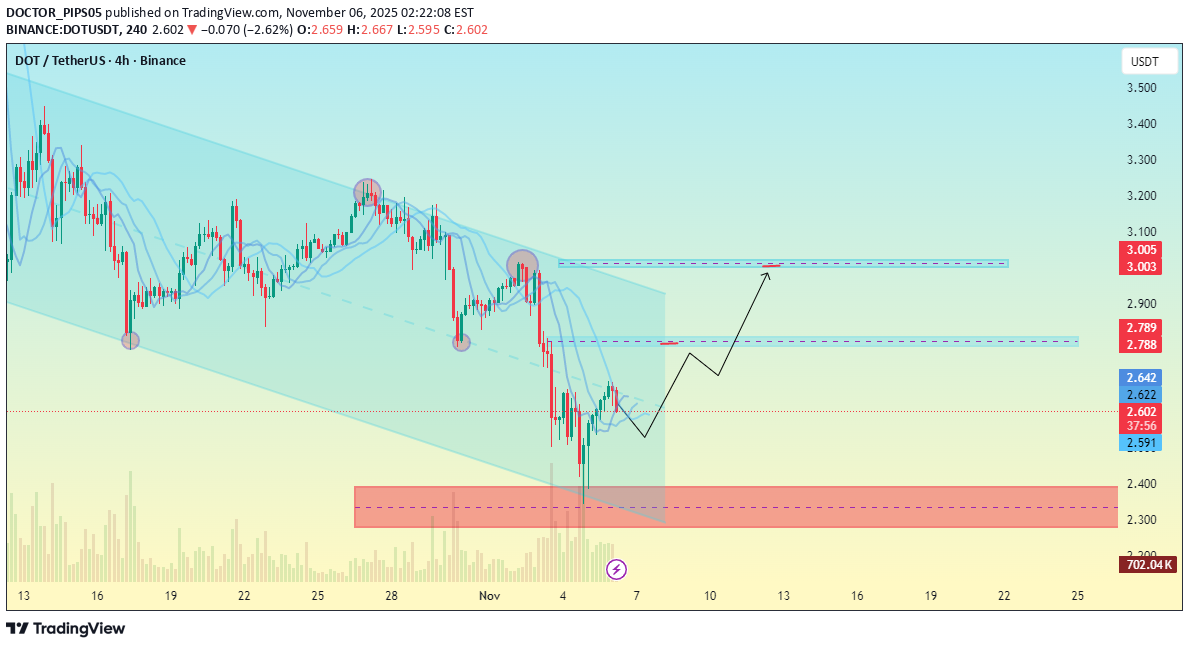
Overall Structure: The price has been moving within a descending channel, forming lower highs and lower lows — a clear downtrend pattern. Current Price Zone: Around $2.60, just above a recent swing low. Support Zone (Pink Box): Between approximately $2.35 – $2.45, marking a strong demand area where price previously bounced. Projection: The chart indicates a potential bullish correction or reversal from the lower boundary of the channel. The drawn projection suggests a move upward toward the $2.78–$2.79 resistance first, and then a potential extension to $3.00–$3.01, which aligns with a previous high and the upper channel boundary. Key Resistance Levels: $2.78–$2.79: Near-term resistance, possible reaction zone. $3.00–$3.01: Strong resistance zone; a breakout here could confirm trend reversal. Key Support Levels: $2.59–$2.60: Immediate local support. $2.35–$2.45: Stronger support zone (marked in pink). 📊 Summary: The analysis suggests a potential bullish rebound from the support region toward $2.78 and possibly $3.00,** provided the price holds above $2.50. If it breaks below $2.45, the bullish outlook would weaken.