Technical analysis by DOCTOR_PIPS05 about Symbol DOT: Sell recommendation (10/21/2025)

DOCTOR_PIPS05
تحلیل DOT/USDT: سقوط به کدام سطح حمایتی در کانال نزولی؟
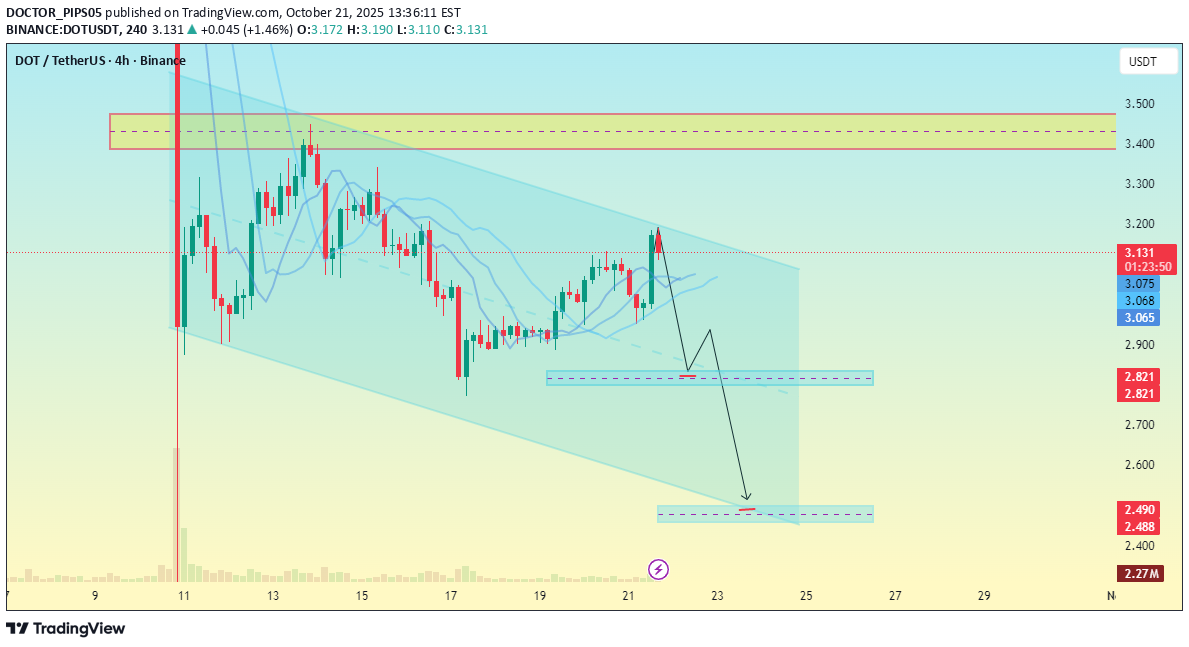
he chart shows a descending channel pattern (bearish structure). Current price is around 3.14 USDT. There’s a resistance zone near 3.40–3.45 USDT (highlighted in yellow), aligning with the channel’s upper boundary. You’ve drawn two potential demand zones: First around 2.85–2.80 USDT Second (deeper support) around 2.50–2.45 USDT The projected price path shows a possible rejection from the upper channel, continuation lower, and a drop toward those demand zones. Technical summary: 🔹 Bias: Bearish short-term 🔹 Structure: Price respecting a descending channel 🔹 Confirmation: A break below ~3.00 could accelerate a move to 2.85 or 2.50 🔹 Invalidation: A breakout and close above 3.45 would invalidate the bearish setup and may start a trend reversal.