Technical analysis by DOCTOR_PIPS05 about Symbol PAXG: Buy recommendation (10/28/2025)

DOCTOR_PIPS05
تحلیل طلا (XAU/USD) در تایم فریم ۱ ساعته: آیا کانال نزولی شکسته میشود یا حمایت ۳۹۵۰ حفظ میشود؟
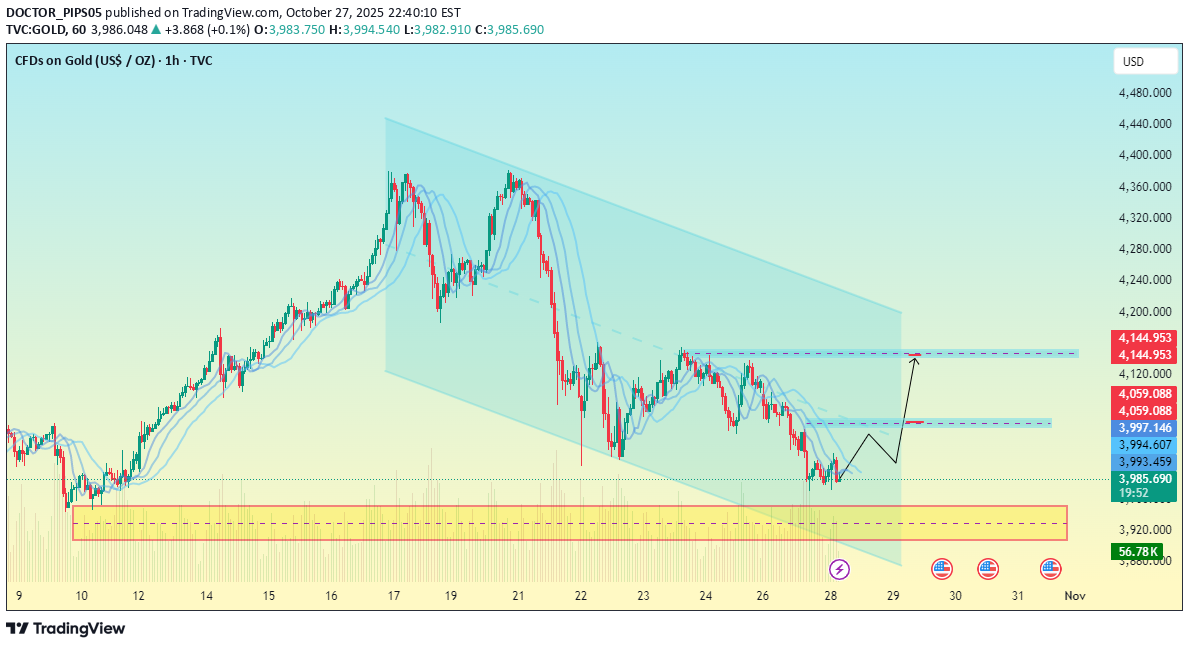
imeframe: 1H Current Price: Around $3,991 Overall Structure: A descending channel pattern (price making lower highs and lower lows). Highlighted Zones: Yellow Zone (bottom): Strong support area — previous accumulation zone where buyers stepped in before. Blue Zones: Short-term resistance levels, marking potential profit-taking or pullback points. 📊 Technical Interpretation 1. Support Zone (3,950 – 3,980): Price bounced off this zone, forming a potential double bottom or reversal structure. Buyers defending this area indicates strong demand. 2. First Target / Resistance: Around 4,080 – 4,100, shown by the first blue line. Could see some pullback here if momentum weakens. 3. Second Target: Around 4,140 – 4,160, near the upper boundary of the channel. This aligns with your projected path (the “V-shaped” move on the chart). 4. Channel Dynamics: The descending channel is intact, so unless a breakout above the upper trendline occurs, the overall trend remains bearish. A break above 4,160 would indicate a potential trend reversal to bullish. 🧭 Likely Scenarios Bullish Case: Bounce from support → retest 4,100 → consolidation → continuation toward 4,160. Bearish Case: Failure to hold above 3,980 → breakdown toward 3,920–3,900 support zone. ⚙️ Trading Perspective Buy Zone: 3,970 – 3,990 (if support holds) Targets: 4,100 / 4,160 Stop Loss: Below 3,950 to protect from deeper downside.