
TRX
TRON
| تریدر | نوع سیگنال | حد سود/ضرر | زمان انتشار | مشاهده پیام |
|---|---|---|---|---|
خرید | حد سود: تعیین نشده حد ضرر: تعیین نشده | 12/4/2025 | ||
خرید | حد سود: تعیین نشده حد ضرر: تعیین نشده | 12/2/2025 | ||
 acciondelprecio-ExERank: 4569 | خرید | حد سود: تعیین نشده حد ضرر: ۰٫۲۷۰۴ | 10/27/2025 | |
 CobraVanguardRank: 5447 | خرید | حد سود: ۰٫۳۶۶۶ حد ضرر: تعیین نشده | 10/16/2025 | |
 AloneTrader_Rank: 5370 | خرید | حد سود: تعیین نشده حد ضرر: تعیین نشده | 10/14/2025 |


Price Chart of TRON
سود 3 Months :
خلاصه سیگنالهای TRON
سیگنالهای TRON
Filter
Sort messages by
Trader Type
Time Frame

Bithereum_io
ترون (TRX) آماده پرواز؟ شکست خط مقاومت و اهداف جدید در نمودار روزانه!

#TRX has broken above the falling wedge on the daily chart. The RSI and MACD both suggest continued upward momentum, but for now, #TRX is facing the daily SMA50. In case of a breakout above the SMA50, the potential targets are: 🎯 $0.3075 🎯 $0.3188 🎯 $0.3301 🎯 $0.3462 🎯 $0.3667 ⚠️ Always remember to use a tight stop-loss and maintain proper risk management.

John_Isige
آیا TRX از رکود خارج میشود؟ سطوح کلیدی برای صعود یا سقوط تریون (TRX/USD)
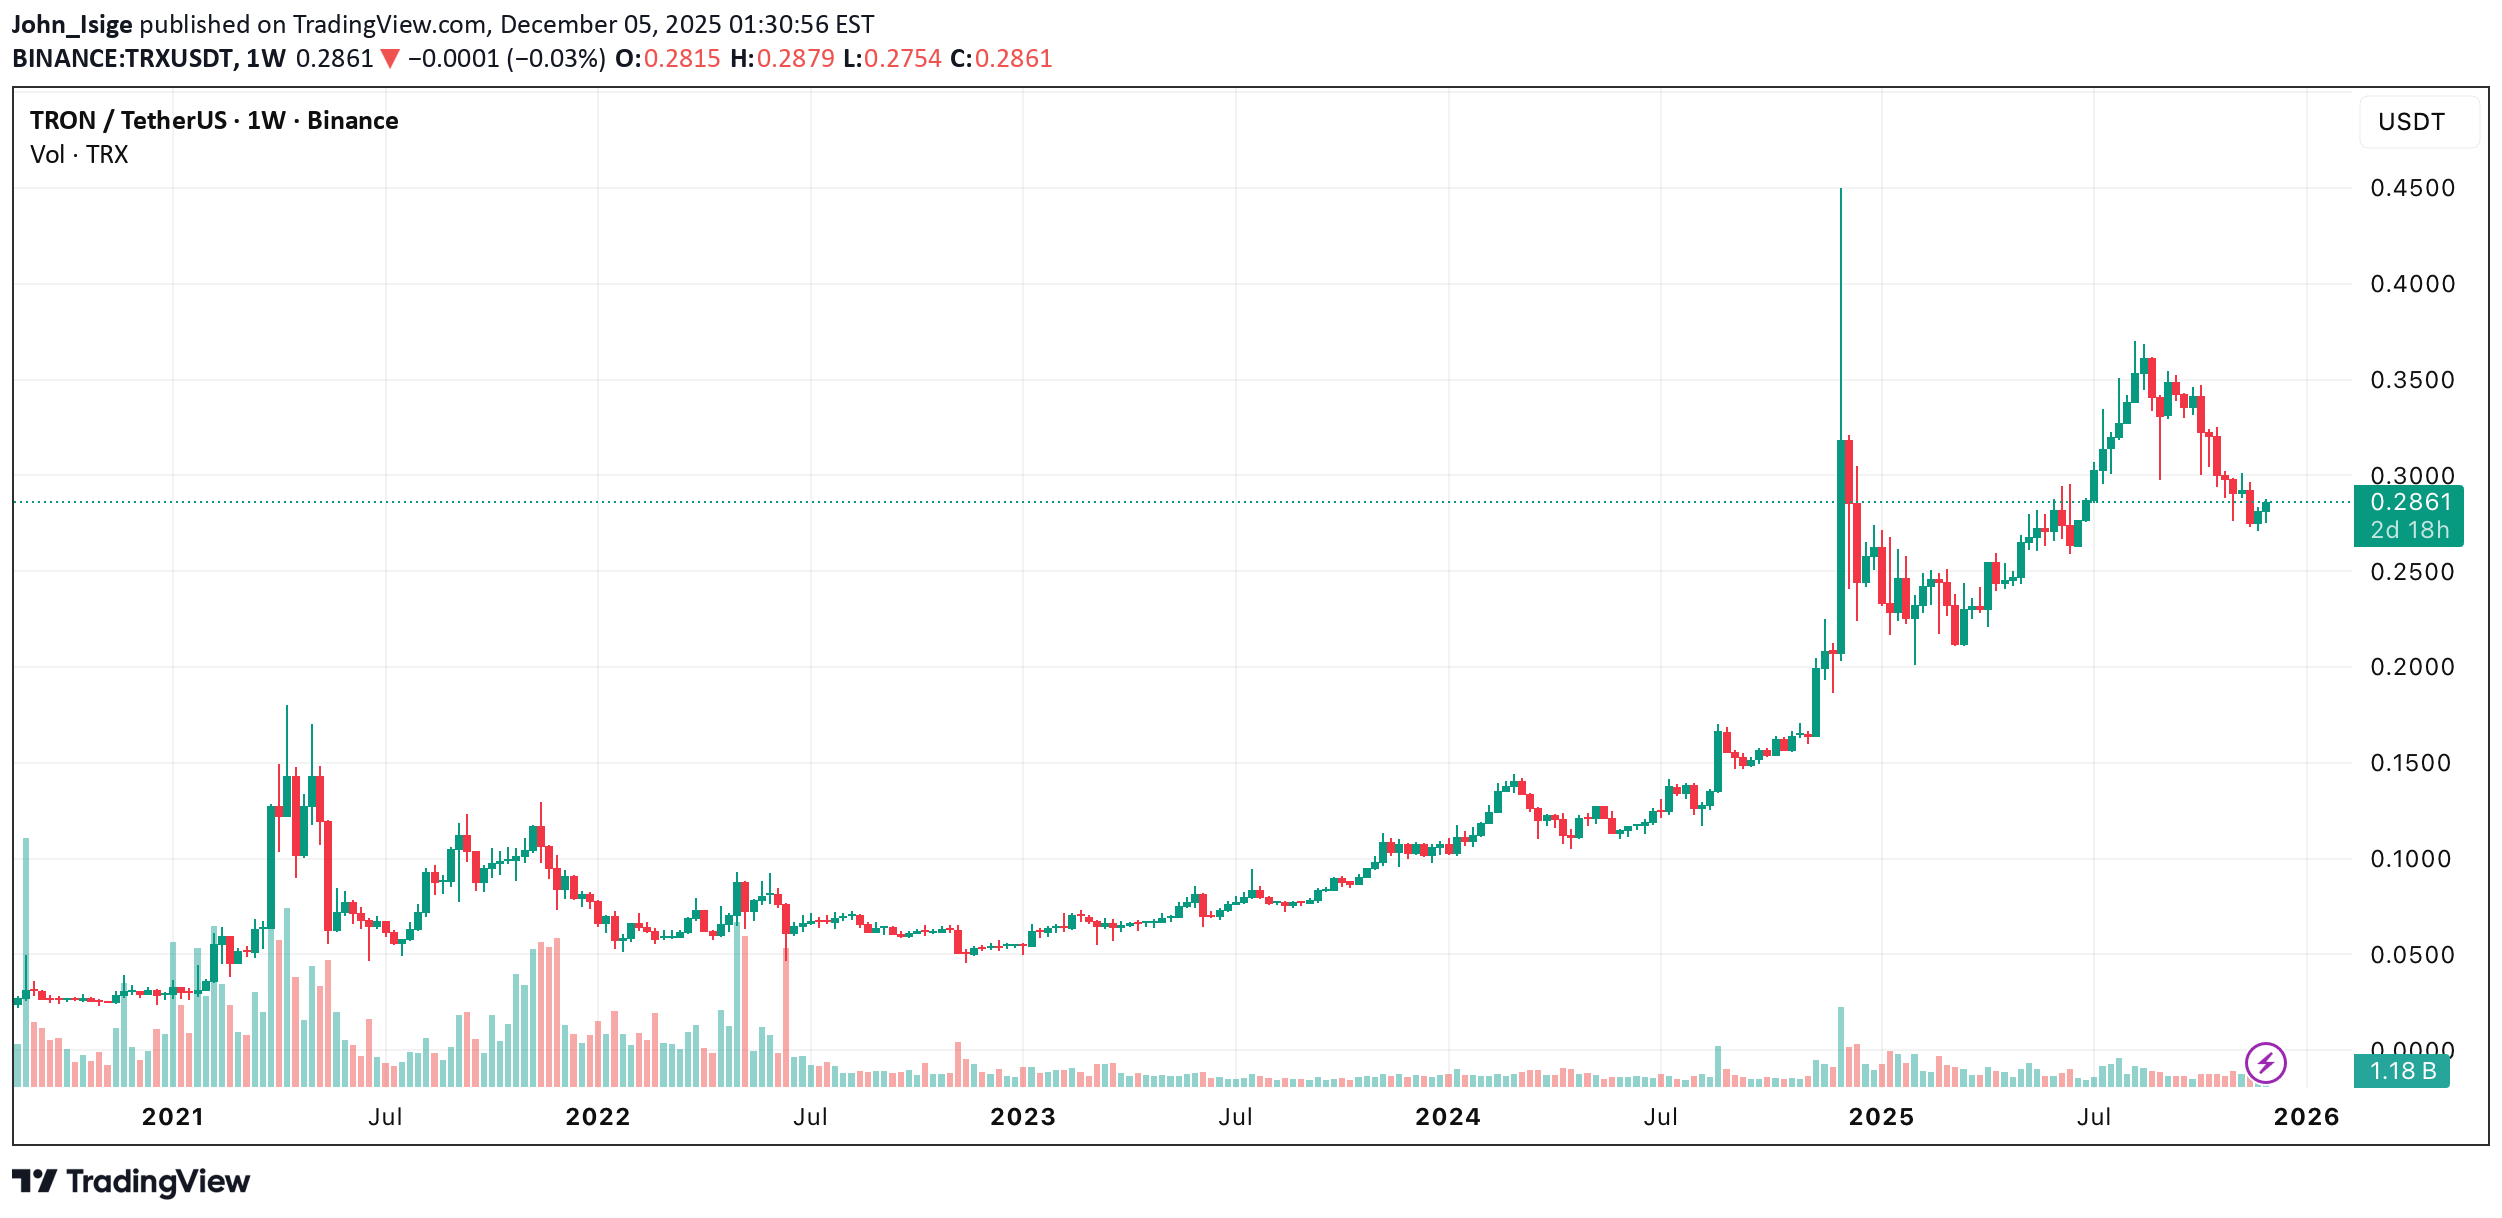
TRX/USD has been under pressure since August, losing up to 26%, yet compared to other L1 assets the decline remains relatively mild. Over the past weeks, the pair stabilized around 0.27, forming a minor rebound structure. The key question now: can TRX reclaim its trend, or is this just a relief bounce? ⸻ Market Structure Price reacted to the 0.272 support zone again, while on-chain metrics show improving fundamentals: • Total Tron accounts exceed 350M • Perp DEX volume on Tron surged 271% in November • Stablecoin market cap on Tron reached $80B, near ATH TRX remains the dominant network for USDT flows — an upside catalyst if risk appetite returns. A confirmed trend reversal requires a breakout above the 20-day EMA, followed by a push toward 0.289 (Supertrend resistance). Failure to hold 0.277 risks another retest of 0.272. ⸻ Bullish Levels 0.289 • 0.293–0.298 • 0.305 • 0.319–0.326 • 0.334 • 0.354–0.362 • 0.369 A break of 0.293–0.298 is the key to unlocking bullish momentum — this zone clusters the 50 EMA, 38.2% Fib, and 200 EMA. Above it, the next pivot is 0.319–0.326, followed by 0.334, and the Golden Pocket at 0.354–0.362, which is the maximum realistic upside in the coming weeks unless macro conditions flip risk-on. ⸻ Bearish Levels 0.278–0.271 • 0.261–0.258 • 0.240 • 0.225–0.212 Below the 20 EMA, downside pressure persists. A break below 0.271 would reopen a slide toward 0.258 (23.6% Fib). Further bearish momentum targets 0.240, and then the macro support 0.225–0.212, which held from January–April 2025. Given Tron’s relative strength, a return to yearly lows remains unlikely unless Bitcoin makes fresh cycle lows. ⸻ Indicators • Daily RSI: bullish divergence — supporting recovery • Weekly RSI: recently flashed a sell signal, invalidated only above the 20-day EMA • Monthly RSI: cooling off but still holding above neutral — long-term structure remains intact ⸻ Bias: Neutral → Bullish above 0.293; Bearish below 0.277 Critical Reversal Zone: 0.293–0.298 Key Support: 0.272 Breakout Target: 0.319–0.326 and 0.354–0.362 Breakdown Target: 0.258 and 0.240
تحلیل تکنیکال ترون (TRX) پس از شکست مقاومت: سناریوهای صعود و نزول پیش رو
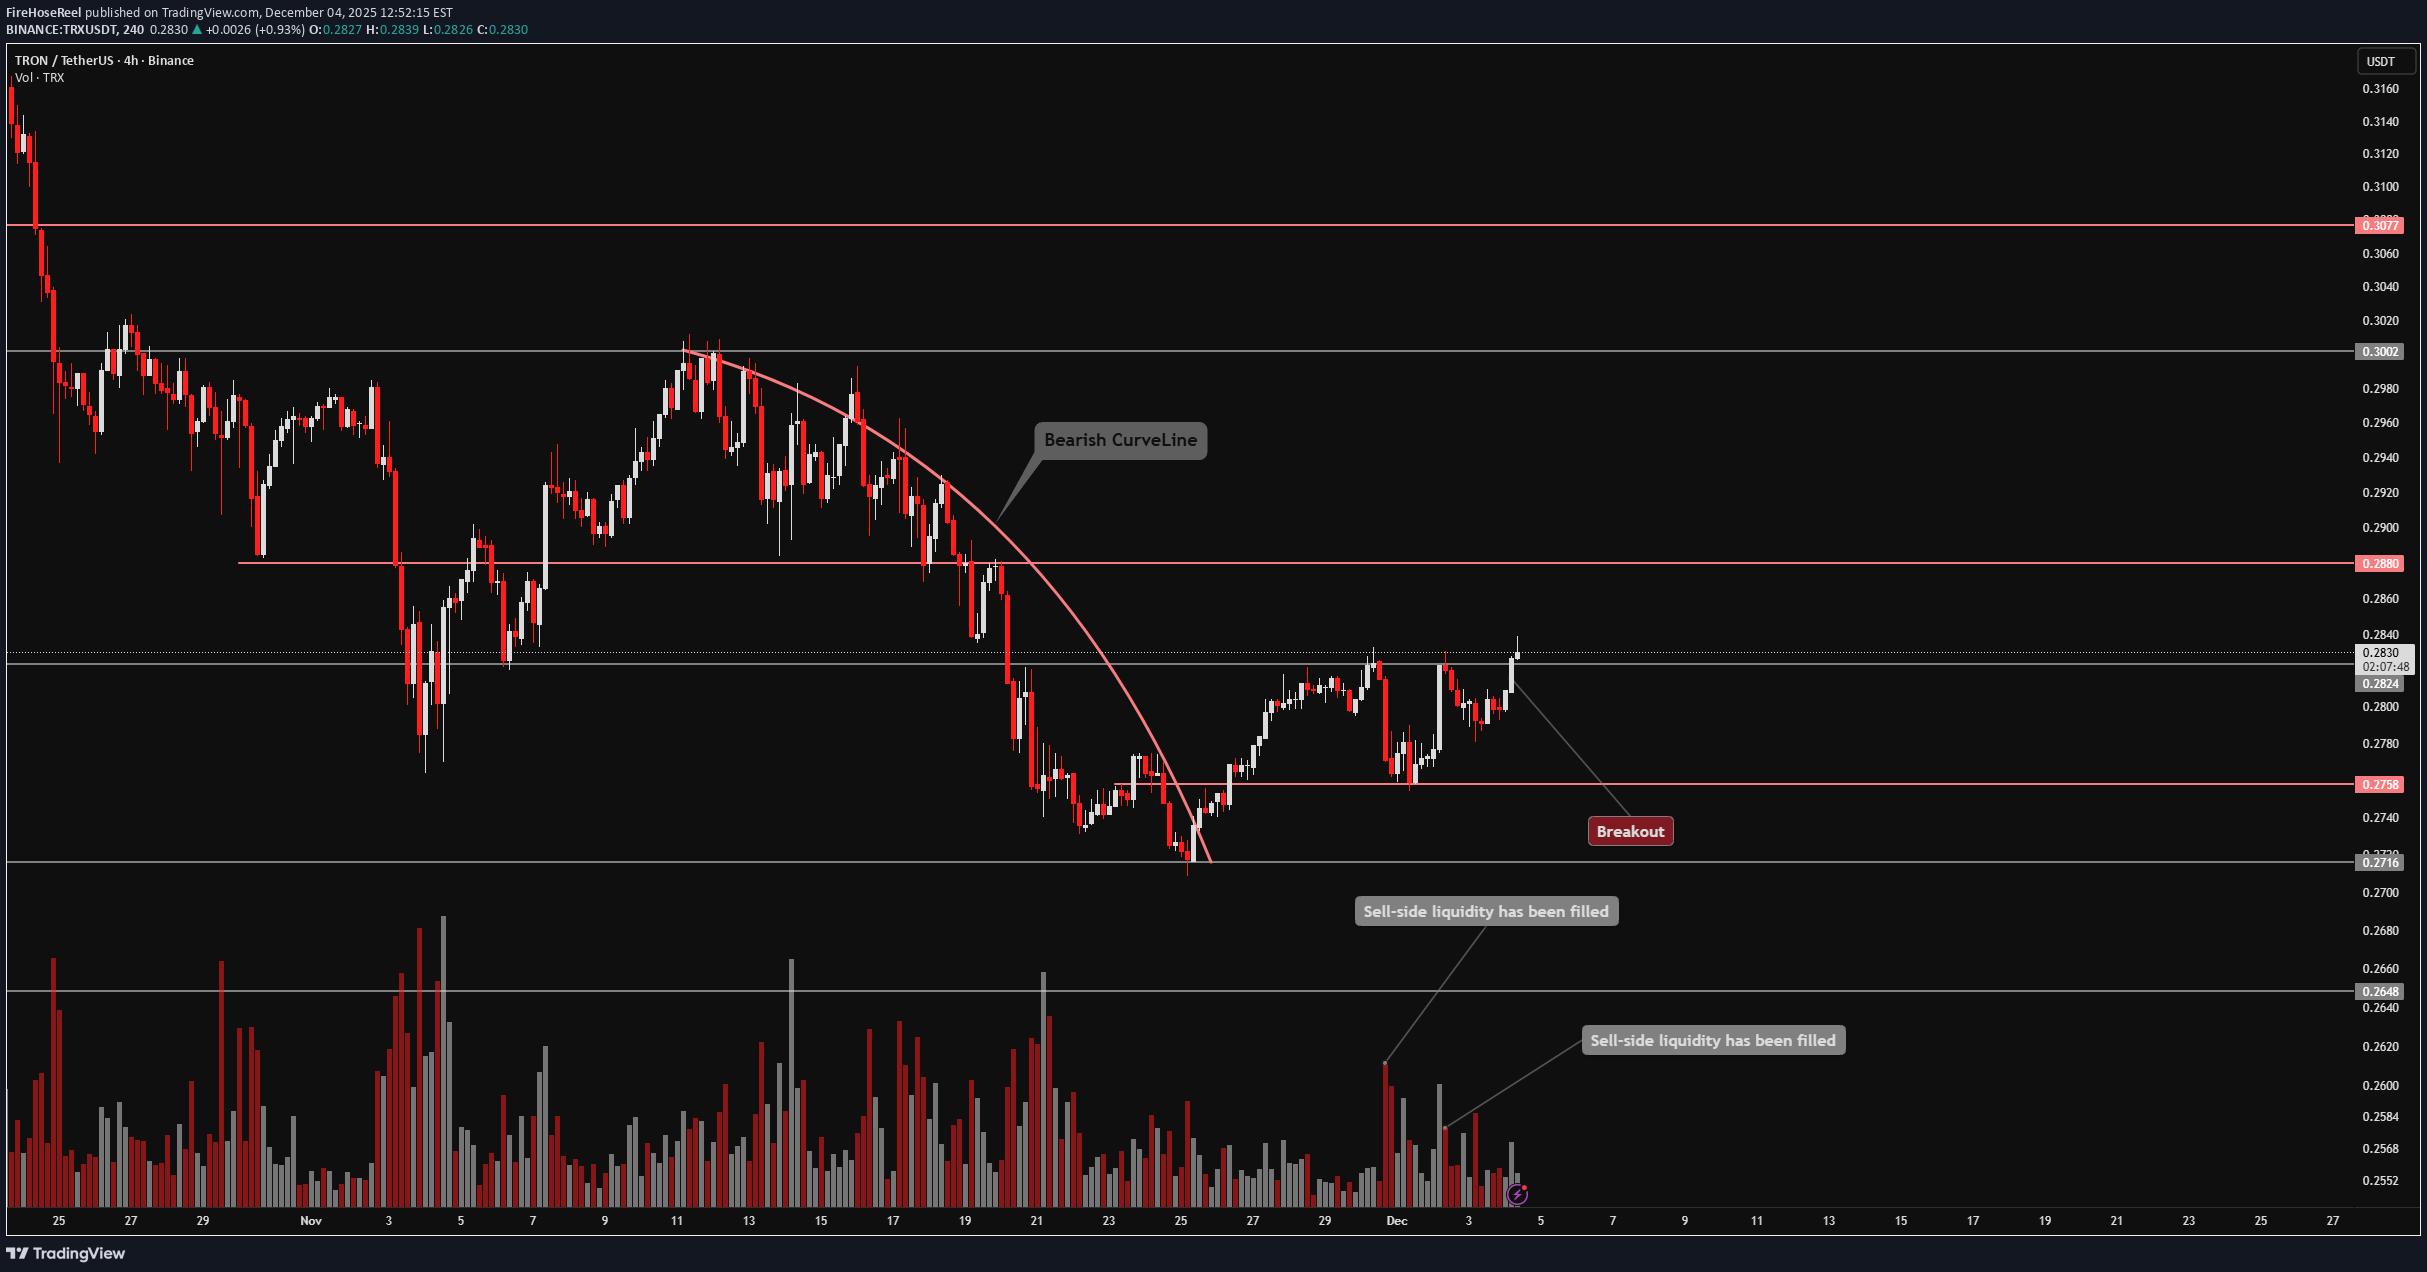
🔥 Welcome to FireHoseReel! Let’s jump into the TRX market structure analysis. 👀 TRX – 4H Overview TRX has successfully broken above the $0.2824 resistance and is now pushing higher. Over the past 24 hours, TRX trading volume has dropped by 20%. 📊 Volume Analysis Watch the volume closely on the chart. Every time price previously reached $0.2824, it faced strong sell pressure and sell orders were heavily filled. On the third and current test, fewer sell orders were present, and with a slight increase in volume, this resistance was finally broken. ✍️ TRX Trading Scenarios Below are the active scenarios you can use alongside your trading strategy: 🟢 Long Scenario Since TRX has broken this resistance, you can enter a long position, placing your stop-loss below the current low. Alternatively, wait for better consolidation above this level and enter on the pullback for a safer setup. 🔴 Short Scenario A break below the $0.2791 support, accompanied by strong selling pressure, could lead to a deeper drop and offers a valid short setup. 🧠 Protect your capital first. No setup is worth blowing your account. If risk isn’t controlled, profit means nothing. Trade with rules, not emotions.

SwallowAcademy
شکست روند مهم ترون (TRX): پایان حمایتها و فرصت فروش؟
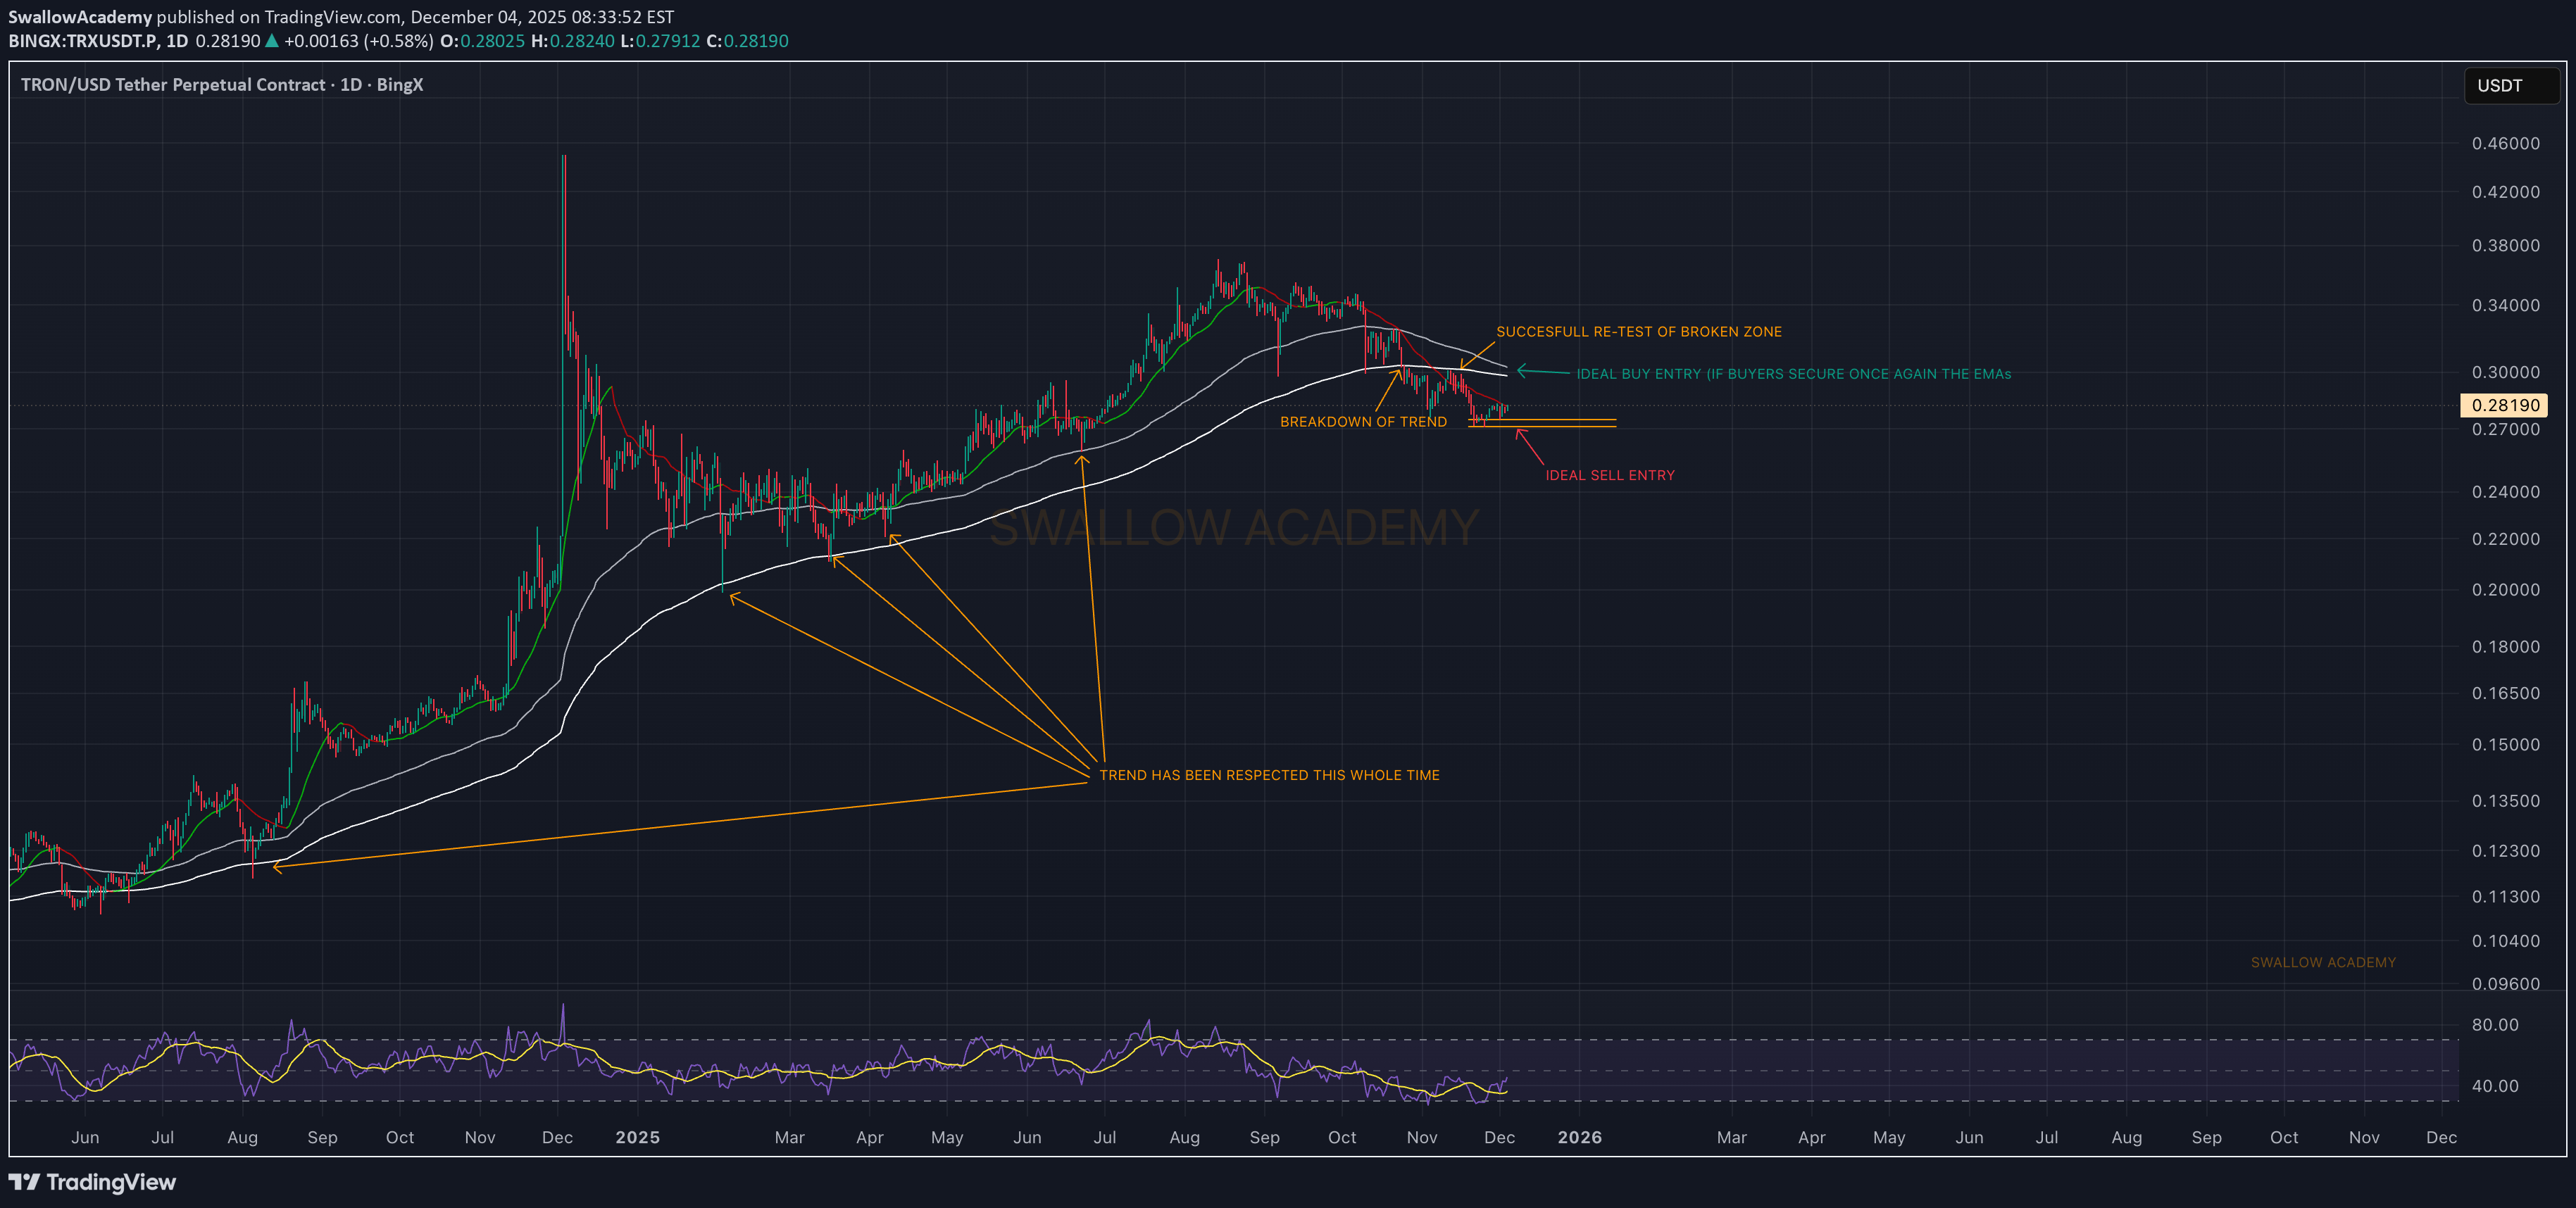
TRX has been respecting its trend for a long time, but now we finally got a clean breakdown of that structure. Buyers tried to re-secure the zone, but so far the reaction isn’t convincing. Right now the chart favors the sell side — unless buyers manage to reclaim the EMAs and push back above the broken zone, the ideal setup remains a short from current levels. If the retest fails again, continuation lower becomes the most likely scenario. We’ll stick with the plan and wait for the setup to fully play out. Swallow Academy
لحظه سرنوشتساز ترون (TRX): آیا به زودی شاهد انفجار قیمتی خواهیم بود؟
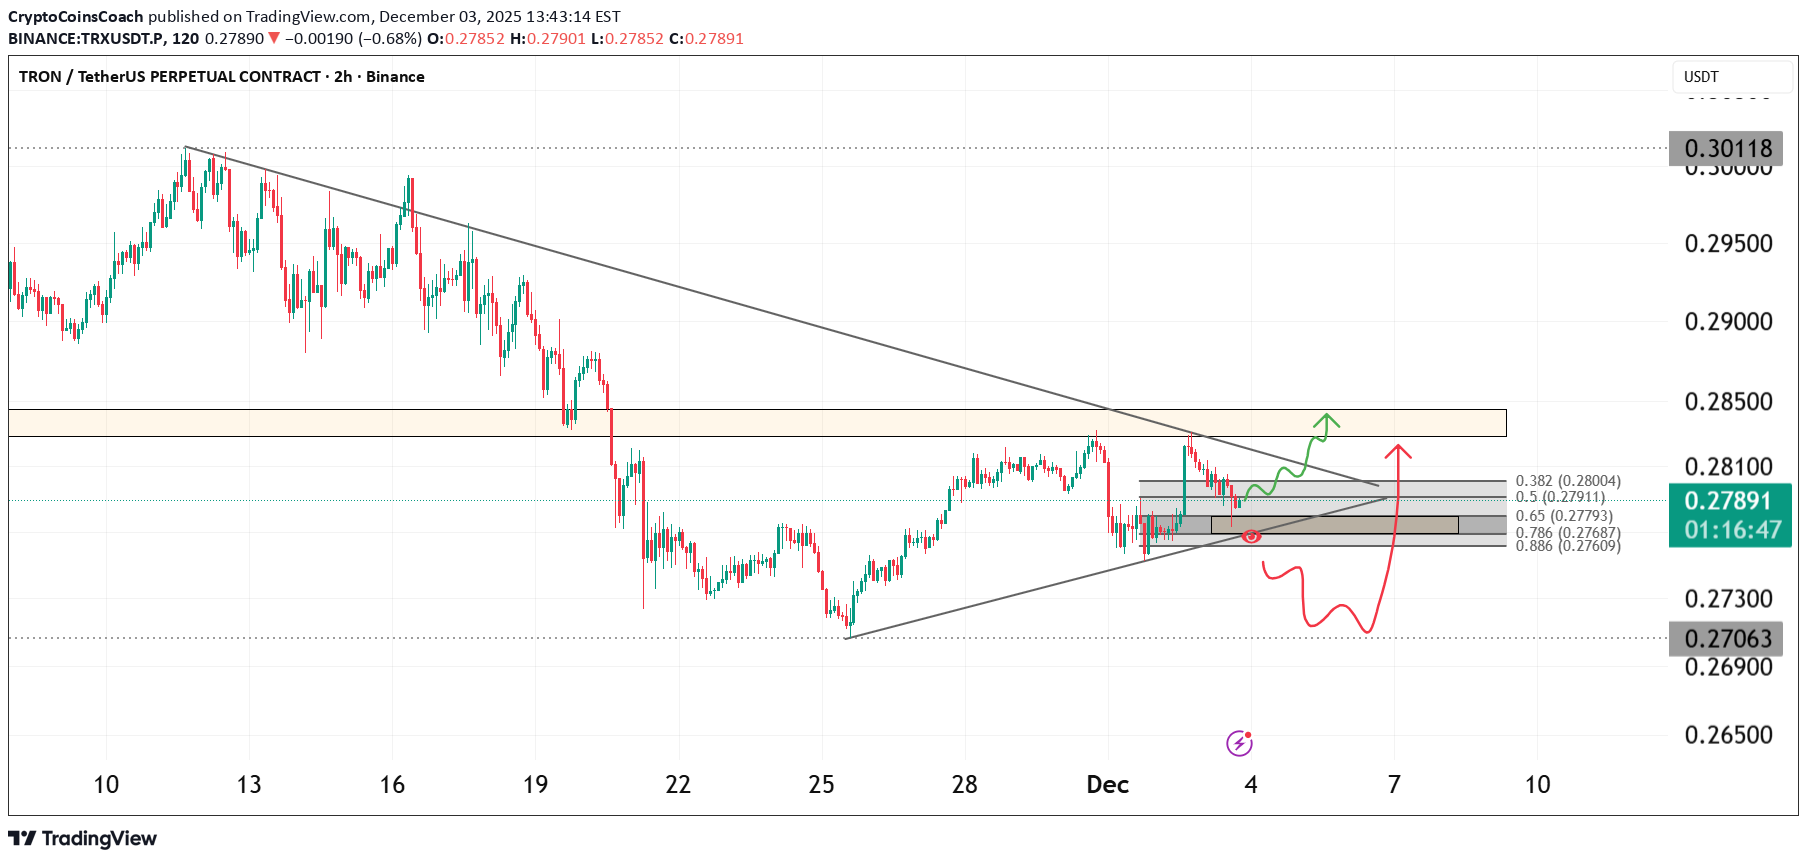
TRX is approaching a critical decision point inside a compressing structure where price is being held between diagonal resistance and a rising support line. The market has printed a clean series of higher lows while repeatedly testing the same resistance, suggesting growing pressure beneath the price. The current reaction inside the grey fib zone shows that buyers are active, and as long as this support holds, TRX can attempt another push into the supply region highlighted above. The behaviour inside this zone will determine whether price continues upward or rejects for a deeper pullback. The zone around 0.282 to 0.286 is the important breakout region to watch. If price reclaims it, momentum can shift upward rapidly toward the next liquidity pockets. Key Notes • Price is compressing into an apex between support and diagonal resistance • Fib retracement region is holding as intraday support • Liquidity sits above the 0.282 to 0.286 supply region • Higher lows suggest accumulation behaviour Bullish Scenario If TRX continues to hold the fib support and breaks above 0.282, the structure opens room for a move toward the upper supply zone with potential follow through. Bearish Scenario Failure to hold the grey support region can push price back to retest the lower trendline around 0.270. Invalidation A clean break and continuation below 0.270 invalidates the bullish setup and delays any potential breakout. Simple explanation TRX is squeezing into a decision point. Holding support gives it room to break out. Losing support sends it back to the lower trendline. Watch how price behaves around 0.282 because that level decides everything.
ترون (TRX) در آستانه انفجار صعودی بزرگ؛ آیا این حمایت کلیدی، مسیر پرش را هموار میکند؟
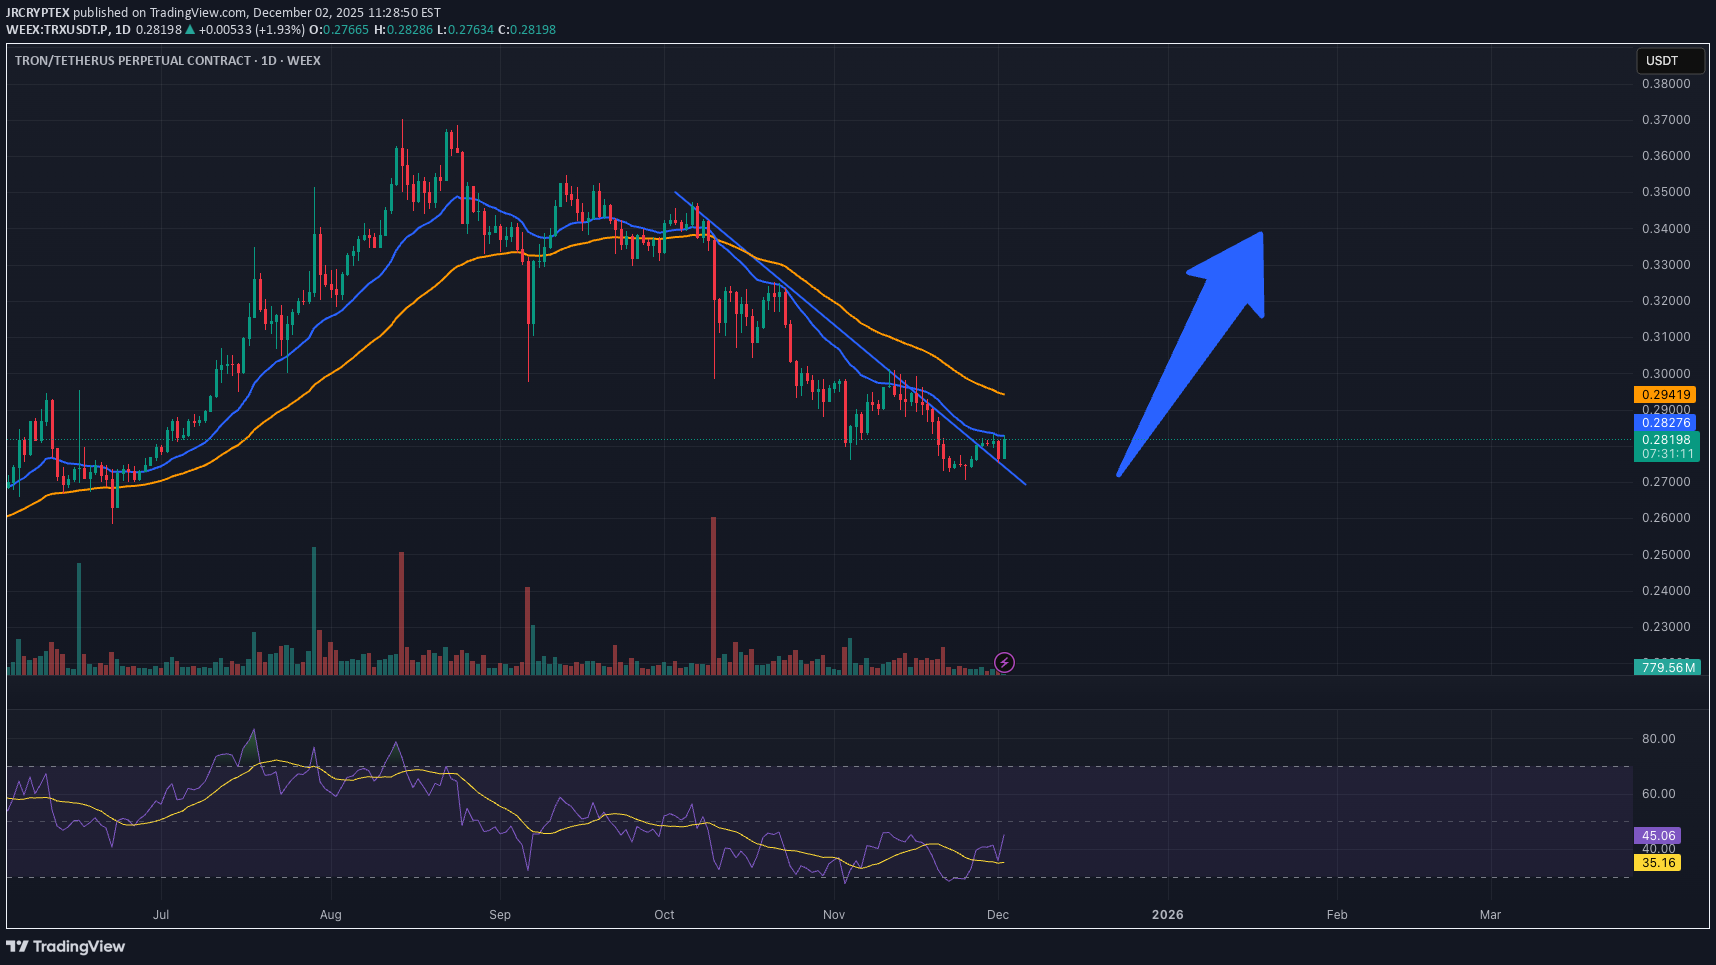
I'm looking for Tron to break out to the upside shortly. Currently at a crucial support level and breaking out of the down trend. If we can get above the EMAs, I see a big bounce to the upside.
پیشبینی انفجار قیمت TRXUSDT: با این استراتژی، سودی تا خط زرد تضمینی است!
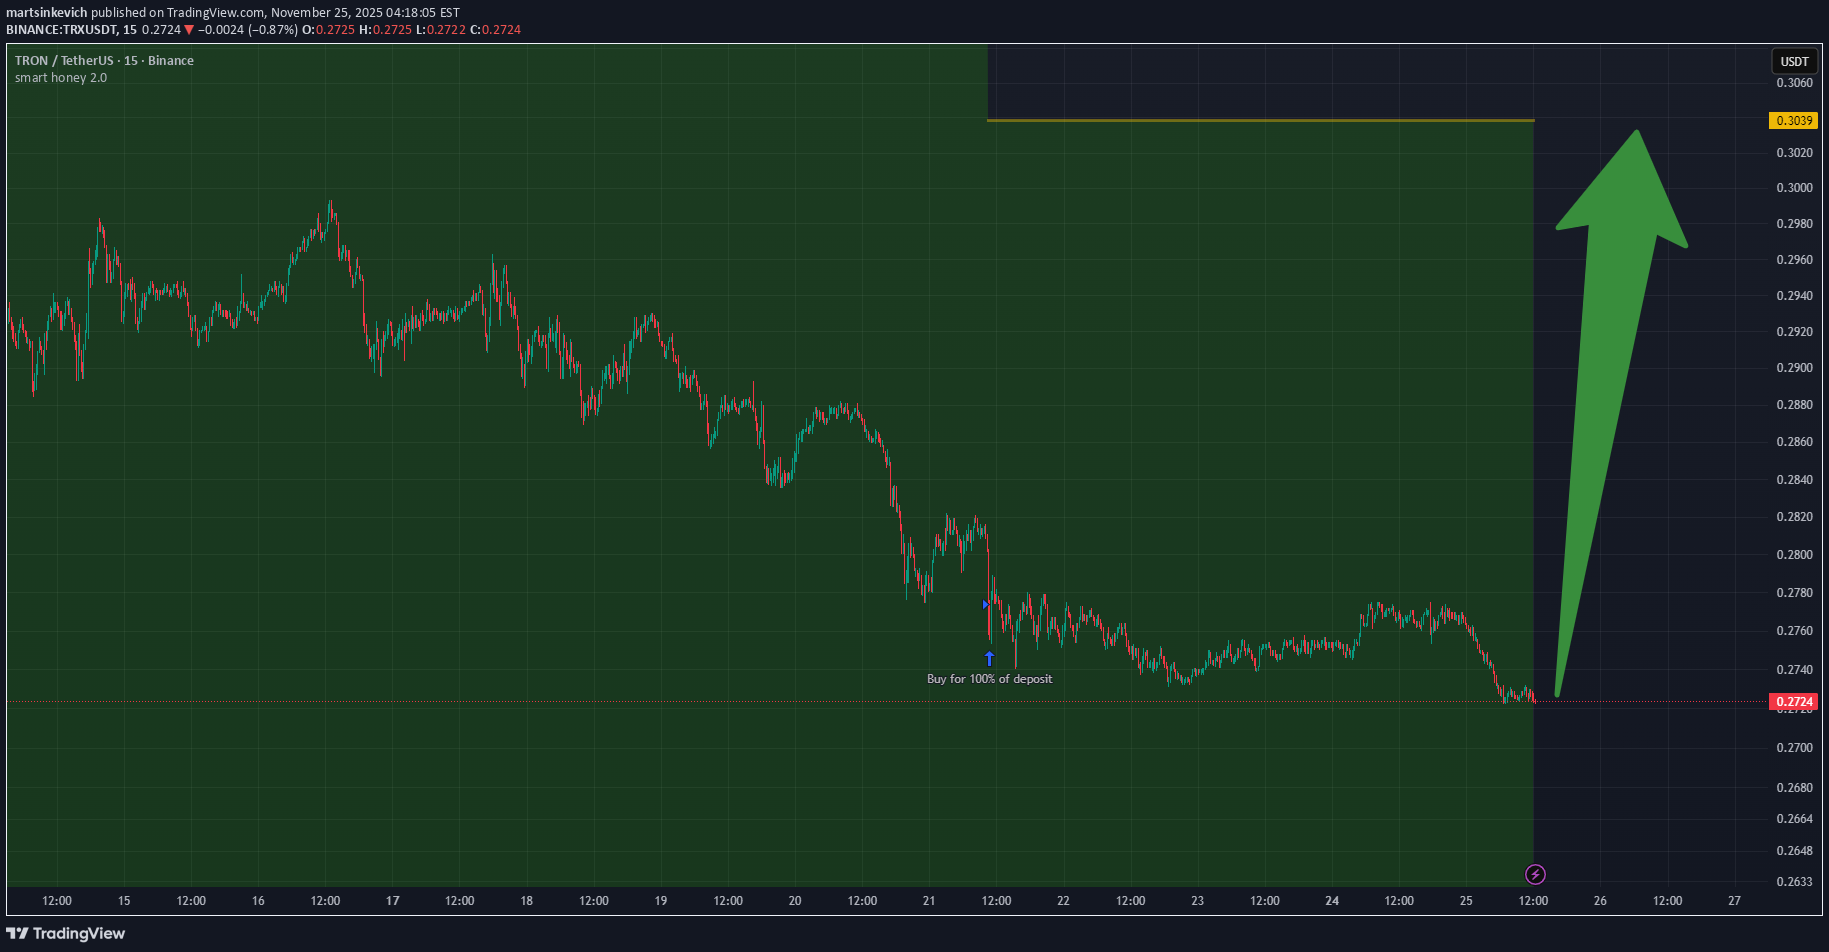
If you backtest the entire history of TRXUSDT using Smart Honey 2.0, you will see that there were 4 similar situations. From this, I conclude that TRX price will rise to the yellow line in the near future Settings for smart honey 2.0 tp = 1.5 sensitivity = 2.7

TradingShot
ترون (TRX) بعد از 2.5 سال سقوط کرد! آیا چرخه نزولی تایید شده است؟
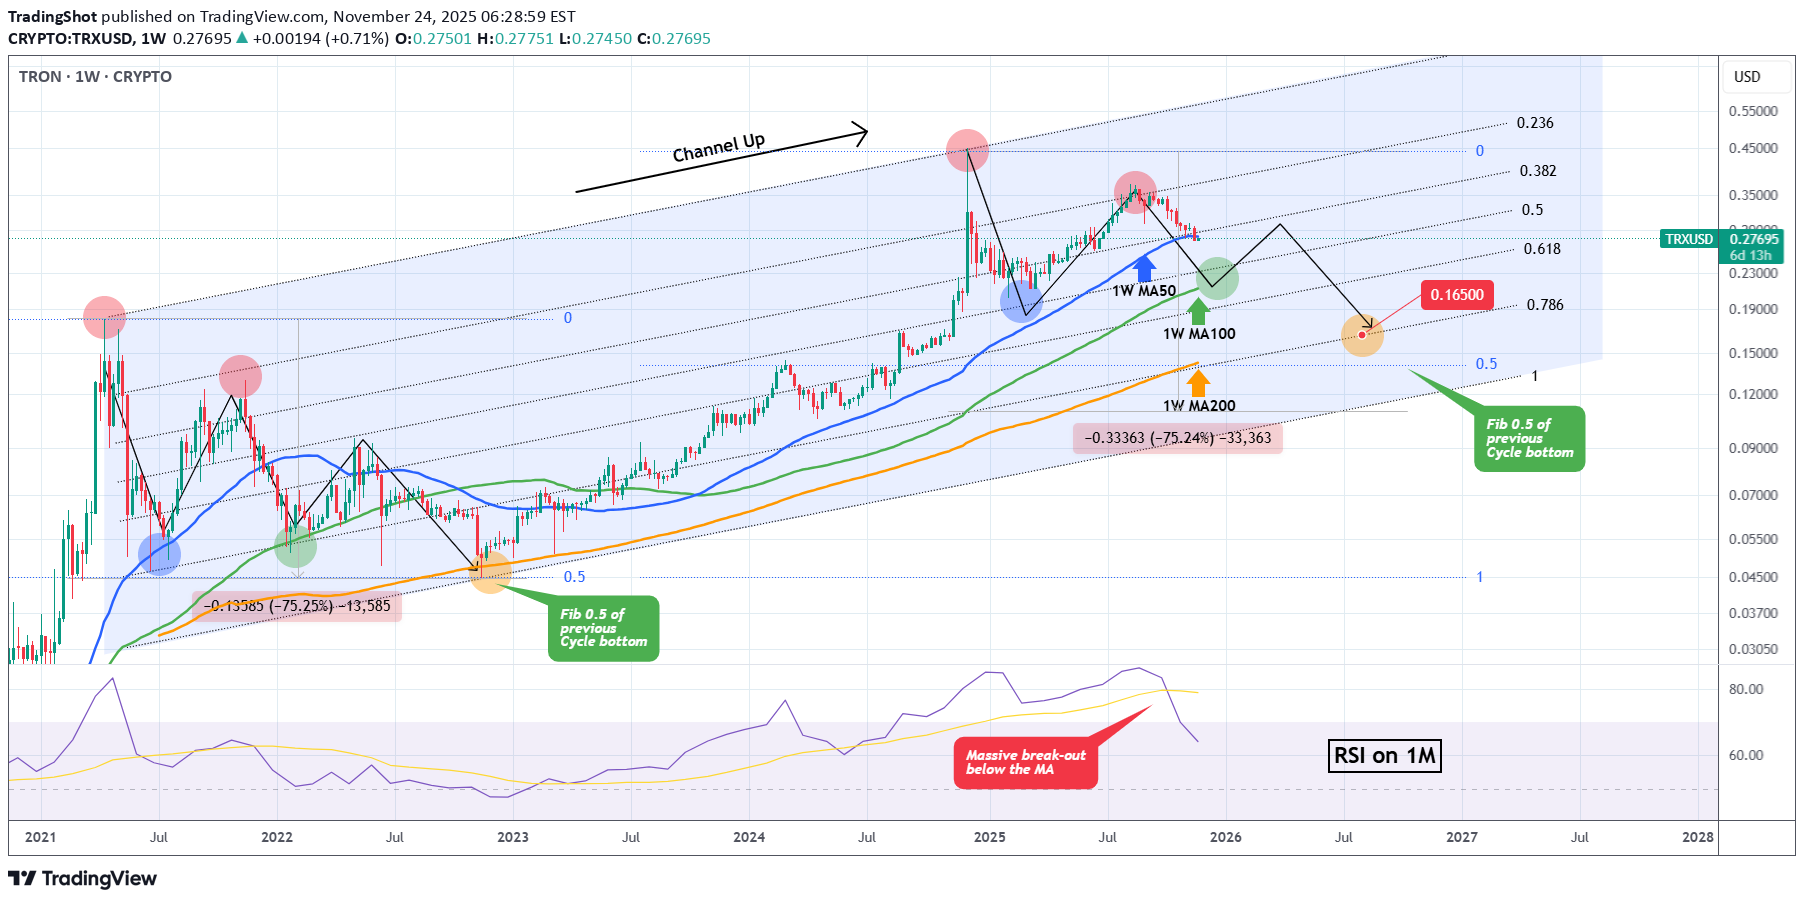
Tron (TRXUSD) closed last week below its 1W MA50 (blue trend-line) for the first time since March 20 2023. Those +2.5 years it has been riding the new Bull Cycle within a Channel Up that peaked on the December 02 2024 1W candle, around the majority of the altcoin market. The current 1W MA50 break seems similar to the December 13 2021 one that was also initiated after a 0.236 Fibonacci level rejection and confirmed the subsequent Bear Cycle. With the 1M RSI brutally falling below its MA, we believe the market may have again confirmed the new Bear Cycle and the next target (as then) is the 1W MA100 (green trend-line). Our long-term projection for a Cycle bottom is the 0.786 Fib, unless the 1W MA200 (orange trend-line) gets hit after August 2026. If not we believe the market may bottom around at least 0.16500, which is still a more optimistic scenario as it falls even above the 0.5 Fibonacci retracement level from the November 14 2022 (previous) bottom. --- ** Please LIKE 👍, FOLLOW ✅, SHARE 🙌 and COMMENT ✍ if you enjoy this idea! Also share your ideas and charts in the comments section below! This is best way to keep it relevant, support us, keep the content here free and allow the idea to reach as many people as possible. ** --- 💸💸💸💸💸💸 👇 👇 👇 👇 👇 👇

davidjulien369
تحلیل دقیق معامله خرید بلندمدت TRX: استراتژی ICT و وایکوف برای سود 1.52 درصدی
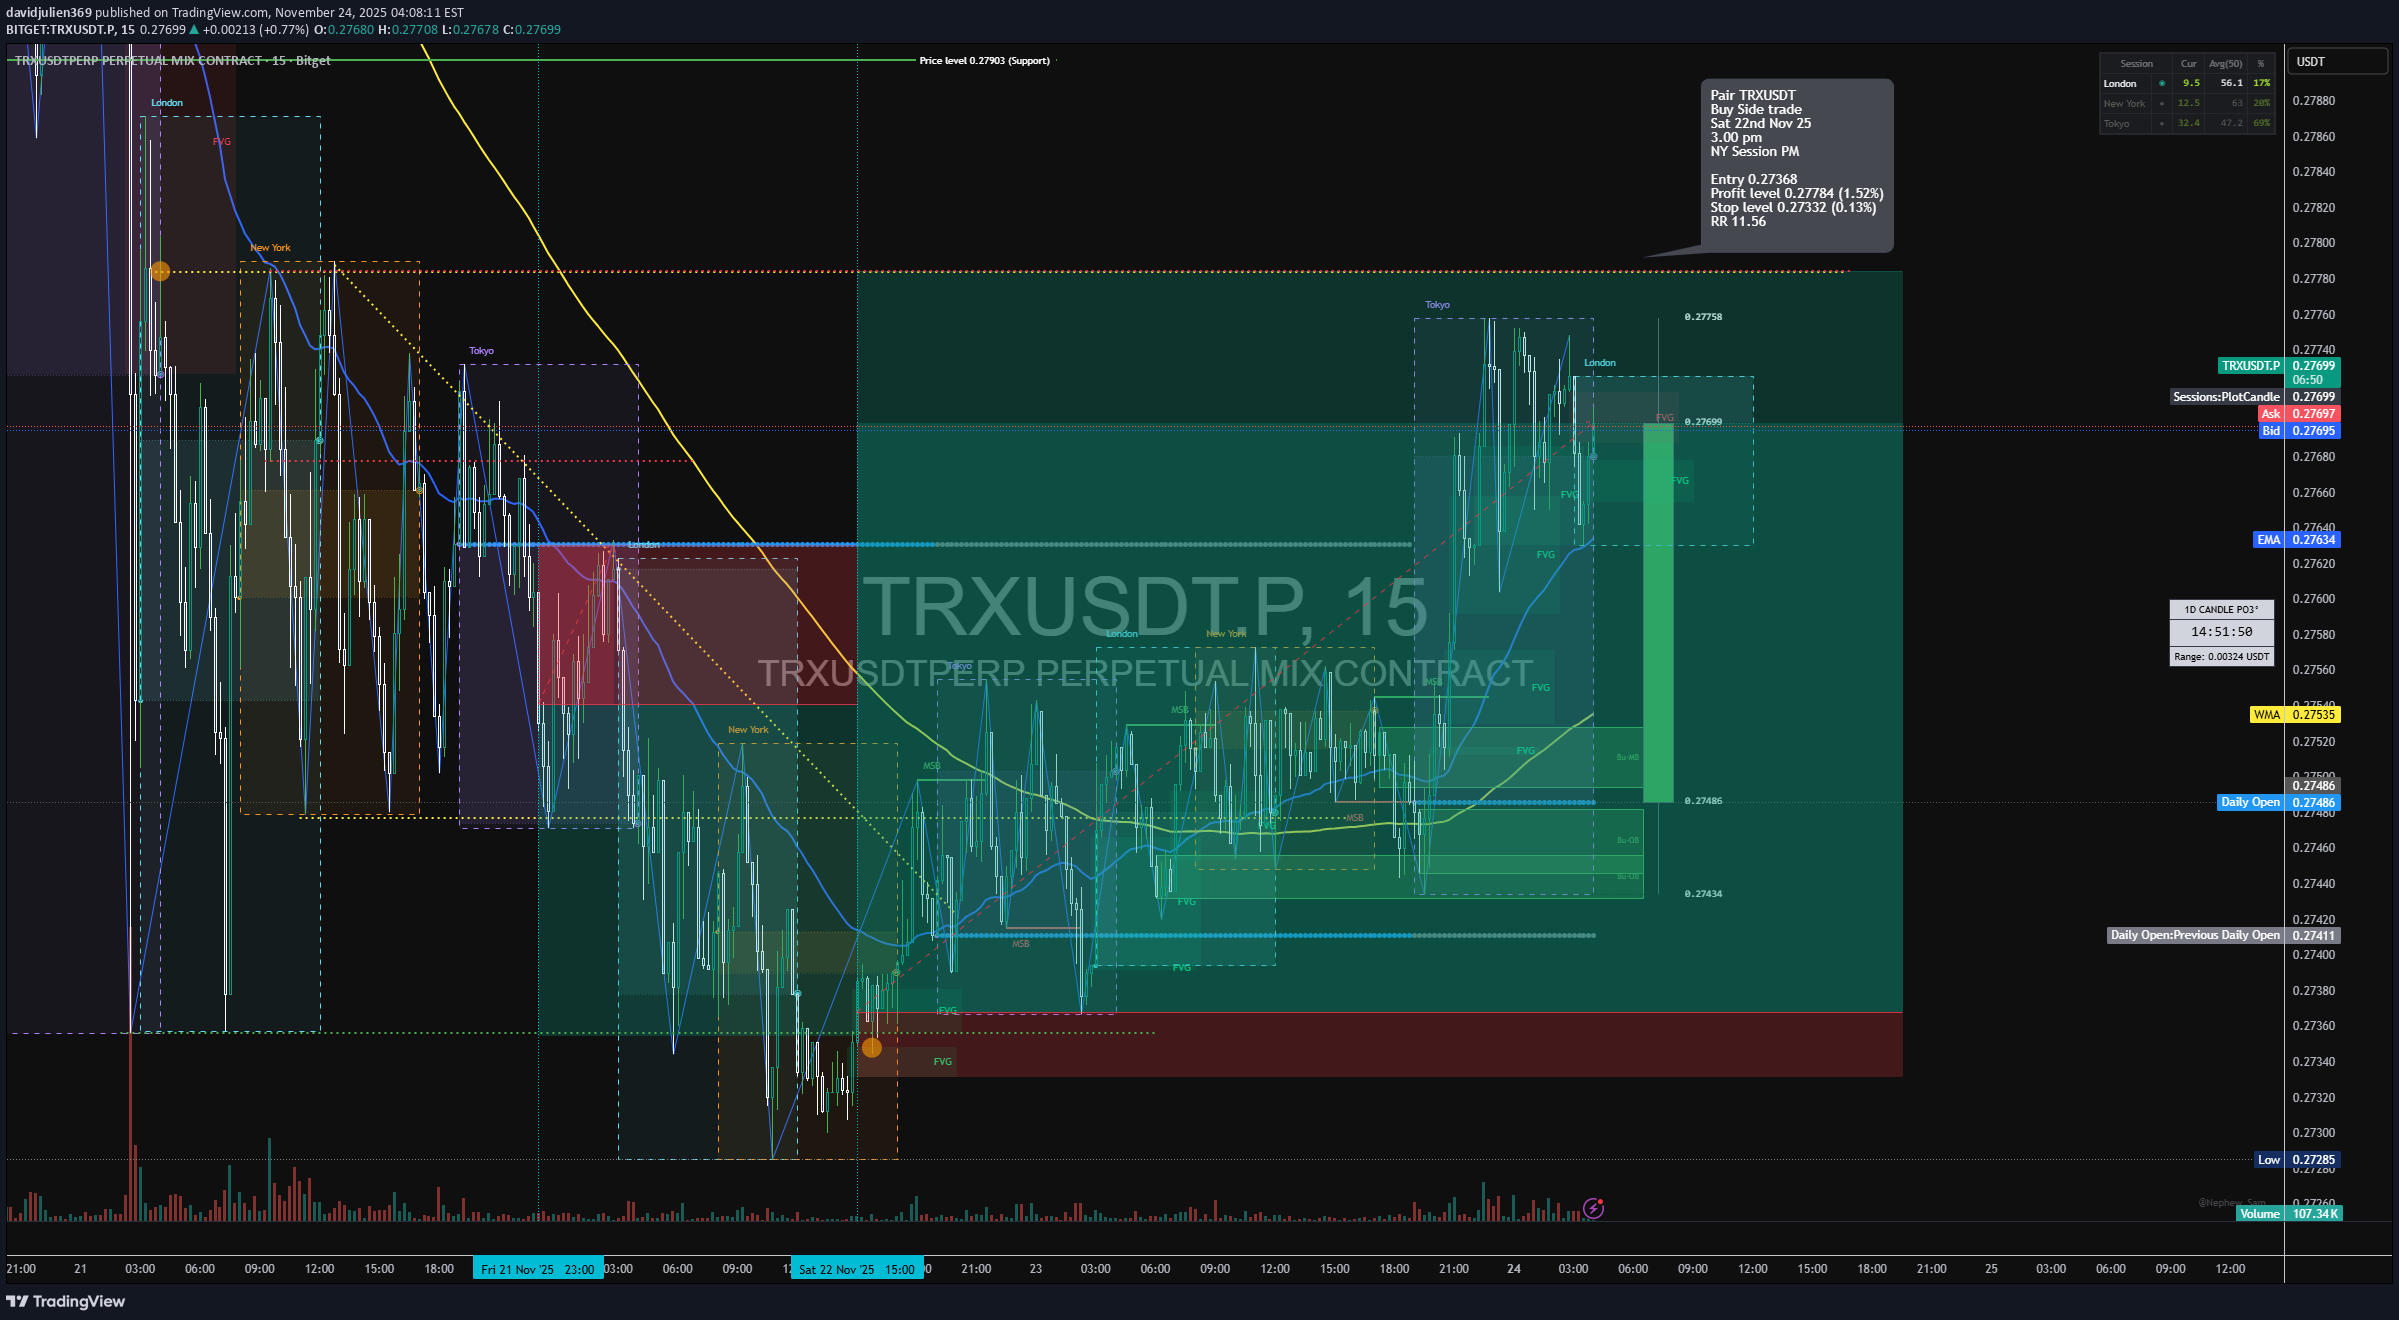
15min 📘 TRXUSDT.P – Trade Journal Entry (15-Min Chart) Sat 22nd Nov 25 — 3:00 pm — NY Session PM Buyside Trade 🟦 TRADE SUMMARY (Tab 1 — Blue) Pair: TRXUSDT.P Direction: Buyside Trade Date: Sat 22nd Nov 25 Time: 3:00 pm Session: NY Session PM Timeframe: 15m 🟩 TRADE PARAMETERS (Tab 2 — Green Transparent) Entry: 0.27588 Profit Level: 0.27784 (+1.52%) Stop Level: 0.27352 (–0.13%) Risk-to-Reward: 11.56 R 30min 🟨 MARKET CONTEXT & STRUCTURE 1. Trend Context TRX recovered from a heavy markdown cycle seen on the 30m structure. The 15m chart shows a micro accumulation zone beneath the 200 EMA, then a displacement above the structure. NY PM session creates a clean shift in order flow, reclaiming: The NY AM high, the FVG left during the earlier breakdown and the intraday session midpoint 2. Key Structure Points BOS at 0.2754 marks a bullish transition. The 50 EMA flips upward and crosses the 200 EMA — momentum confirmation. Series of higher lows formed after the BOS → clear buyside continuation model. 🟪 LIQUIDITY Sell-Side Liquidity Removed Liquidity swept below 0.2738, creating a final inducement. NY PM grabs sell-side beneath the Asian and London session lows. This clears the path for Algorithmic Repricing. Buyside Liquidity Targets First cluster at 0.2775–0.2780 HTF resistance levels at 0.2795–0.2802 TP lands inside the first premium inefficiency. Liquidity Narrative Summary Sweep → Displacement → FVG → OB Tap → Expansion (buyside model) 🟧 ICT MODEL BREAKDOWN Model Used: Sell-Side Sweep → BOS → FVG → PD Array → Buyside Delivery 1. Inducement London + Tokyo lows + NY early lows all swept before entry. 2. Displacement Strong bullish displacement candle breaks above the 0.27540 BOS level. 3. Entry Type Entry sits directly inside a: Bullish FVG Discount Retracement (OTE zone) Order Block Retest Aligned with session timing (NY PM) 4. Target Logic TP hits first internal buyside inefficiency. Secondary targets remain valid at 0.2795–0.2810. 🟫 WYCKOFF ALIGNMENT PhaseTRX Reaction Phase ASelling climax & AR Phase BAccumulation under 50/200 EMA Phase CSpring: final liquidity sweep at 0.2738 Phase DSOS + LPS zone (Entry 0.27588) Phase EMarkup into buyside targets 🟩 VOLUME & CONFIRMATION Volume spikes confirmed the BOS. Retracement into FVG shows volume tapering → bullish absorption. No heavy sell volume returned — confirming algorithmic buy program. 🟥 OUTLOOK / CONTINUATION If TRX holds above 0.2750–0.2753, further markup remains likely. Extended upside zones: 0.2800 0.2820–0.2830 Invalidation: Break below 0.2734 kills the buyside ideaStop level moved (0.85%)Trade updated Pair TRXUSDT Sell Side trade Sat 22nd Nov 25 3.00 pm NY Session PM Entry 0.27368 Profit level 0.27784 (1.52%) Stop level 0.27332 (0.13%) RR 11.56 Target reached Mon 24th Nov 25 8.00 am Profit level 0.27601 (0.85%) RR 6.47 Trade Duration 1 day, 17 hours, 0 minutes

Sinadarvishzadeh
فوری: حباب ترکید! چرا باید همین حالا پوزیشن خود را ببندید؟
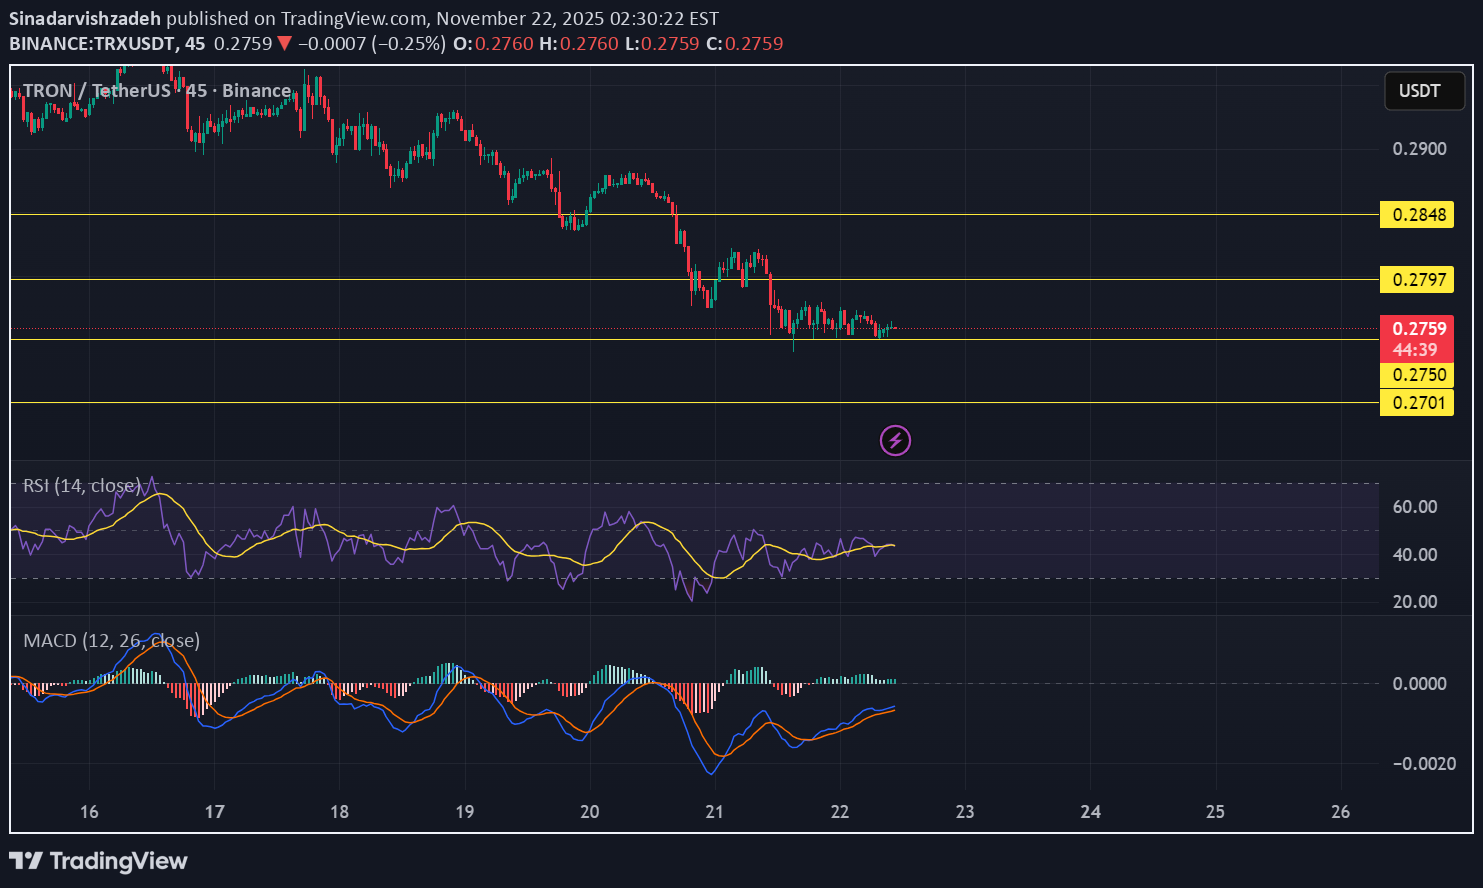
the bubble is getting emptied and we cannot risk staying in the position. im closing the position so should you i will explain the reason: the chart till now had to start moving , since it didnt this means the bubble of over sold has been emptied and now the market is most likely to continue moving downwards or upwards but the probability of our sl being hit is more likely now thats why we should close the position. stay focused stay sharp
Disclaimer
Any content and materials included in Sahmeto's website and official communication channels are a compilation of personal opinions and analyses and are not binding. They do not constitute any recommendation for buying, selling, entering or exiting the stock market and cryptocurrency market. Also, all news and analyses included in the website and channels are merely republished information from official and unofficial domestic and foreign sources, and it is obvious that users of the said content are responsible for following up and ensuring the authenticity and accuracy of the materials. Therefore, while disclaiming responsibility, it is declared that the responsibility for any decision-making, action, and potential profit and loss in the capital market and cryptocurrency market lies with the trader.