
TradingShot
@t_TradingShot

What symbols does the trader recommend buying?
Purchase History
پیام های تریدر
Filter
TradingShot
BITCOIN Realized Price shows where the bottom might be.

Bitcoin (BTCUSD) has always priced its bottom below its Realized Price (red trend-line) on every signal Bear Cycle it had. In fact the bottom was considerably lower than the Realized Price. The last two Bear Cycles (2022 and 2018) have had fairly similar bottoms, dropping by -33.80% and -35.45% respectively from the moment the price broke below the Realized Price. Based on where the Realized Price is now (which by the time BTC hits it, will be lower) a rounded up -30% decline would have us reach $39000. The Realized Price deviation band (orange cloud) however would be just under $45000 towards the end of the year (which is roughly when we expect the Bear Cycle to end) As a result, a fair bottom zone could be $45000 - $39000. Do you think that's a feasible level to expect? Feel free to let us know in the comments section below! --- ** Please LIKE 👍, FOLLOW ✅, SHARE 🙌 and COMMENT ✍ if you enjoy this idea! Also share your ideas and charts in the comments section below! This is best way to keep it relevant, support us, keep the content here free and allow the idea to reach as many people as possible. ** --- 💸💸💸💸💸💸 👇 👇 👇 👇 👇 👇
TradingShot
BITCOIN Can it reach $50000 during this Bear Cycle?

Bitcoin (BTCUSD) has already started its new Bear Cycle since its October All Time High (ATH). We're past that, we've covered this extensively during the past 3 months. What's more important now is to cover the next stages, which is something we've started doing recently, in order to get a better understanding of the potential course of this Bear Cycle. Right now BTC is consolidating within its 1W MA50 (blue trend-line) and 1W MA100 (green trend-line), which is a familiar pattern during all prior Bear Cycle, where after a 1W MA50 rejection, it starts Stage 2 of the Cycle. The last Bear Cycle bottomed exactly on the 1W MA350 (black trend-line). The two before it, hit the 1W MA300 (red trend-line) before rebounding (and it was a secondary Low). As a result the 1W MA300-350 form a strong Support Zone and is the strongest candidate for the new bottom as well. Contact with the 1W MA350 (based on its current trajectory) should be made around $50000. A 45-50k potential Buy Zone would be more fair. In any case, based on BTC's parabolic growth curve and the diminishing Fibonacci extension on each Bull Cycle Top, we expect the next ATH to be on its 1.382 Fib extension, i.e. around $180000. Is that a trading plan you would follow if you were a long-term investor? Feel free to let us know in the comments section below! --- ** Please LIKE 👍, FOLLOW ✅, SHARE 🙌 and COMMENT ✍ if you enjoy this idea! Also share your ideas and charts in the comments section below! This is best way to keep it relevant, support us, keep the content here free and allow the idea to reach as many people as possible. ** --- 💸💸💸💸💸💸 👇 👇 👇 👇 👇 👇
TradingShot
S&P500 This is the level that confirms the Bear Cycle.

The S&P500 (SPX) has reached a point where it could be on the verge of initiating a new Bear Cycle as the price action that led to the end of 2025 (mostly Q4) has been very similar with the one in late 2021 that kick-started the 2022 Bear Cycle. What confirmed that Bear Cycle was the market closing a 1W candle below the 1D MA100 (red trend-line). This is extremely critical as it has already proven its role as a catalyst during the most recent short-term pull-back in November, where it held upon tested on the week of November 17 2025 and thus rebounded. This is exactly what took place in November 2021, with the index eventually closing a 1W candle below the 1D MA100 almost 2 months later on the week of January 17 2022. That confirmed the 2022 Bear Cycle as the sell-off was accelerated and in just 1 week, the market even hit the 1W MA50 (blue trend-line). The structure between the two fractals is so far very similar, with a huge 1W RSI Bearish Divergence (Lower Highs against price's Higher Highs) leading the index towards a potential Top. If the price action continues to repeat that of 2022, then we are looking at the very real possibility of a -27.60% overall correction within roughly 12 months time, with the first potential Target being the 1W MA200 (orange trend-line) around 5350 and second the full -27.60% extension at 5050. Those two levels technically form the potential Buy Zone for the next Bull Cycle. The metric though that cannot be ignored as far as long-term buying is concerned, is the 1W RSI, which has historically given optimal buy opportunities when it turned oversold (i.e. 30.00 or below). If this level is hit before any of the above two Targets, we will be turning into long-term buyers again regardless. --- ** Please LIKE 👍, FOLLOW ✅, SHARE 🙌 and COMMENT ✍ if you enjoy this idea! Also share your ideas and charts in the comments section below! This is best way to keep it relevant, support us, keep the content here free and allow the idea to reach as many people as possible. ** --- 💸💸💸💸💸💸 👇 👇 👇 👇 👇 👇
TradingShot
XRPUSD Testing its 1W MA50. Rejection to 0.900 starting?

XRP (XRPUSD) is on a strong 2-week rise following a Low late in 2025 on the 1W MA100 (green trend-line). This rally is about to test its 1W MA50 (blue trend-line) for the first time in 2 months. Practically, the market has been ranging between the 1W MA50-100 Zone in a similar way it did back during the previous Bear Cycle. Basically this is not the first time we present to you this chart, we first published it 2 months ago claiming that XRP has already started its new Bear Cycle following its July 2025 All Time High (ATH) and that this Cycle is the Bearish Leg of the market's 5-year Channel Up pattern. If the market continues to replicate the 2021/22 structure, then this 1W MA50 test should produce a rejection that will take us to the 2nd stage of the Bear Cycle, which is a break below the 1W MA100 within 2 months time and an eventual bottom on the 0.618 Fibonacci retracement level and 1M MA100 (red trend-line) test at $0.9000. Notice also how similar the 1W RSI structures are among the two Bear Cycle fractals, with the current rebound taking place on he Symmetrical Support (blue arrows) just like it did on January 22 2022. ** Please LIKE 👍, FOLLOW ✅, SHARE 🙌 and COMMENT ✍ if you enjoy this idea! Also share your ideas and charts in the comments section below! This is best way to keep it relevant, support us, keep the content here free and allow the idea to reach as many people as possible. ** --- 💸💸💸💸💸💸 👇 👇 👇 👇 👇 👇
TradingShot
XAUUSD Geopolitics can push it to 4650.

Gold (XAUUSD) is rising aggressively today, assuming its role as a safe haven in the aftermath of Maduro's capture by the U.S. As long as this geopolitical tension continues, it will push Gold higher, with the technical also favoring such a move, as the long-term trend remains bullish with the 2-year Channel Up intact. Technically we are currently on its new Bullish Leg and will remain valid for as long as the 1D MA100 (green trend-line) holds. All three previous Bullish Legs have had their first Higher High Targets on the 1.5 Fibonacci extension, which gives us a short-term Target at 4650. --- ** Please LIKE 👍, FOLLOW ✅, SHARE 🙌 and COMMENT ✍ if you enjoy this idea! Also share your ideas and charts in the comments section below! This is best way to keep it relevant, support us, keep the content here free and allow the idea to reach as many people as possible. ** --- 💸💸💸💸💸💸 👇 👇 👇 👇 👇 👇
TradingShot
ETHEREUM Will it make this strong bullish break-out?

Ethereum (ETHUSD) is testing yet again its Lower Highs trend-line, which is the Resistance that started on the October 07 2025 All Time High (ATH). This has failed to break two times already, causing strong rejections but this time we may finally see it breaking. The reason, apart from the bullish RSI on Higher Lows, is that today's 1D candle is so far finding support on the 1D MA50 for the first time since the downtrend started and if it closes above it, it will be a first. The result can be a Channel Up, which technically is a Bear Flag inside the new Bear Cycle, whose potential symmetrical +31.47% Bullish Leg can target the 1D MA200 (orange trend-line) at 3600. Why is the 1D MA200 so important? Because it's been the technical Target of every first Dead-cat-bounce during ETH's previous Bear Cycles. --- ** Please LIKE 👍, FOLLOW ✅, SHARE 🙌 and COMMENT ✍ if you enjoy this idea! Also share your ideas and charts in the comments section below! This is best way to keep it relevant, support us, keep the content here free and allow the idea to reach as many people as possible. ** --- 💸💸💸💸💸💸 👇 👇 👇 👇 👇 👇
TradingShot
پایان دوران طلایی بیت کوین؟ اتفاق تاریخی که ۲۰۲۴ را سرخ کرد!
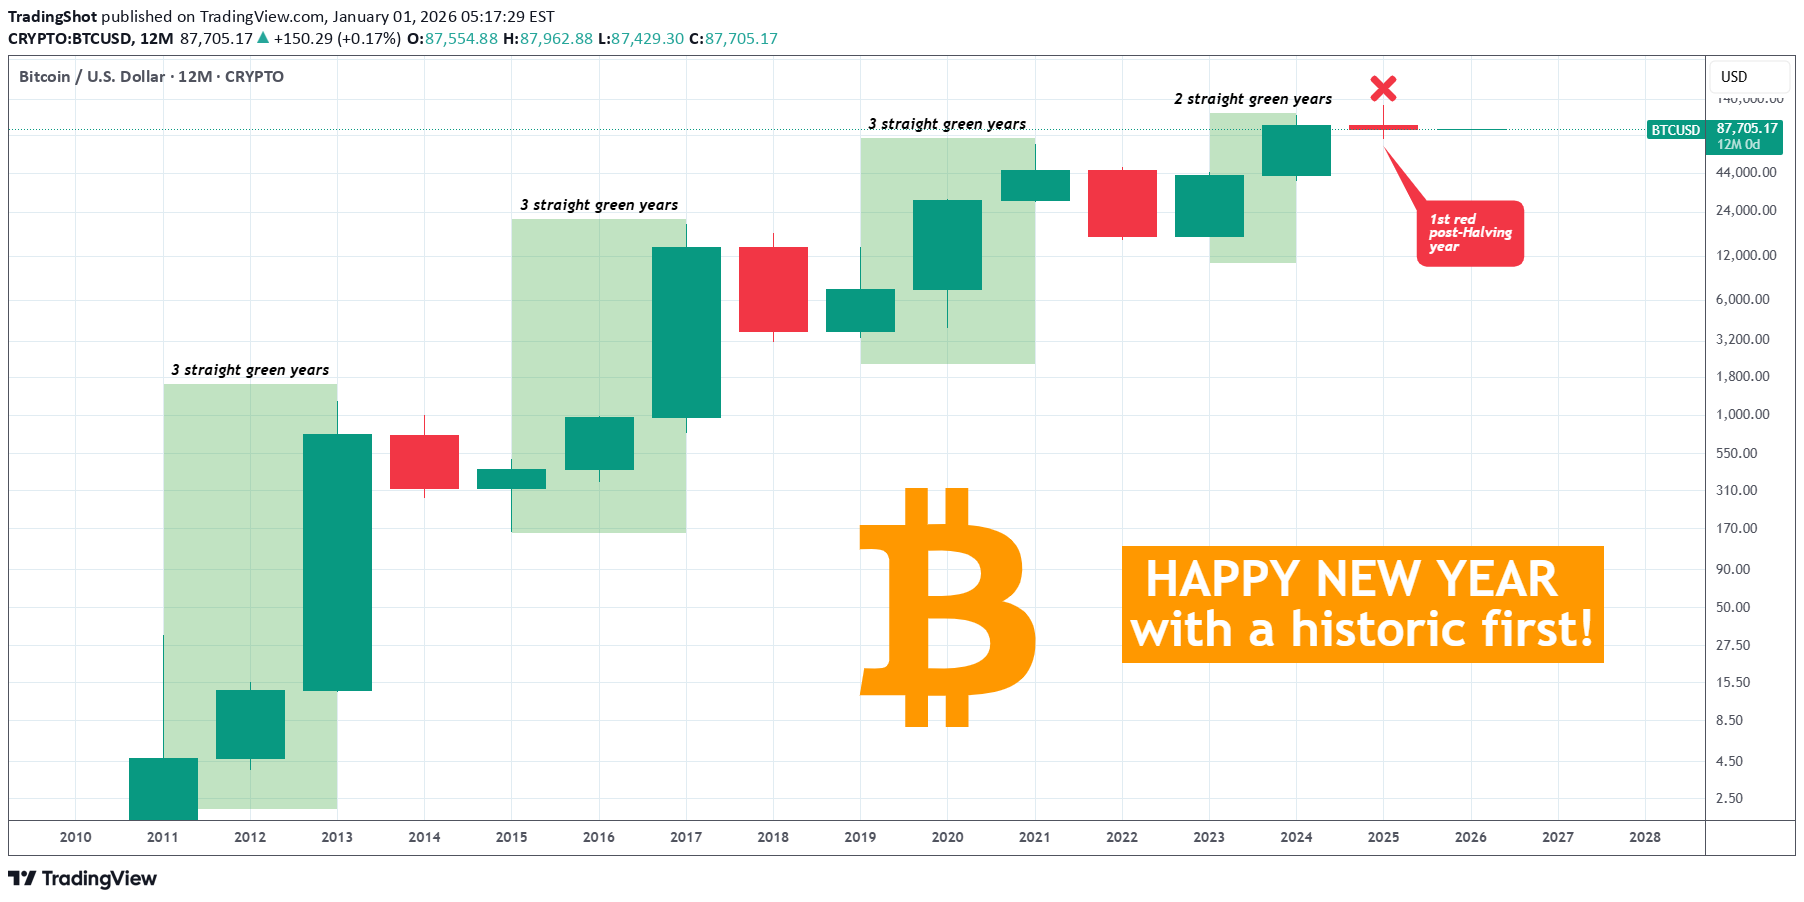
Happy New Year with our best wishes to you and your loved ones! Bitcoin (BTCUSD) closed the year with a feat that it has historically never done before. And that's closing a year in red (losses) within a Bull Cycle. So far, the traditional technical pattern was that after a Bear Cycle, BTC posted at least 3 straight green years. The last, post-Halving year was always green (gains). That held up until yesterday with a red yearly (12-month) candle after two bullish ones in 2023 and 2024. Could that be the end of the traditional 4-year Cycle Theory? Well we don't believe that quite yet. As long as the market makes a new All Time High (or at least Cycle High in the decades that will follow market maturity and mass adoption) on year 4, then the 4-year Cycle Theory should remain the dominant pattern. Nevertheless, that was a historic first for Bitcoin and we couldn't be more excited on what the future holds! Happy New Year again everybody! So does the fact that 2025 closed in losses worry you? Feel free to let us know in the comments section below! --- ** Please LIKE 👍, FOLLOW ✅, SHARE 🙌 and COMMENT ✍ if you enjoy this idea! Also share your ideas and charts in the comments section below! This is best way to keep it relevant, support us, keep the content here free and allow the idea to reach as many people as possible. ** --- 💸💸💸💸💸💸 👇 👇 👇 👇 👇 👇
TradingShot
STRATEGY Is this a 2000 Dotcom crash all over?

Strategy (MSTR) has been on a strong sell-off since its November 2024 All Time High (ATH). A little more than 1 year of downtrend is classified as a Bear Cycle and it may be no coincidence that this ATH was priced marginally above Strategy's previous ATH of March 2000. That was at the peak of the infamous Dotcom Bubble and its subsequent collapse. So are we having a 2000 crash all over again? Well, with Strategy's core business being exclusively Bitcoin related, we are poised to have a big one (since it follows BTC's Cycle to a certain extent) but not just as enormous as 2000's, which exceeded -99%, dropping the company to the brink of extinction. Technically, we can have a correction of -90% though, which is the decline that the previous Bear Cycle in 2022 suffered. After all the dominant multi-decade pattern since the Dotcom bottom, has been a Channel Up, with the recent ATH testing its top and the 1M MA200 (orange trend-line) marking its Lows, hence the best buy opportunities in the last 10 years. As a result, our long-term Target on MSTR remains $60.00, which would be a -90% correction from the Top, while also making direct contact with the 1M MA200. P.S. Notice also the similarities between the 1M RSI sequences. --- ** Please LIKE 👍, FOLLOW ✅, SHARE 🙌 and COMMENT ✍ if you enjoy this idea! Also share your ideas and charts in the comments section below! This is best way to keep it relevant, support us, keep the content here free and allow the idea to reach as many people as possible. ** --- 💸💸💸💸💸💸 👇 👇 👇 👇 👇 👇
TradingShot
رد شدن S&P 500: زنگ خطر برای آغاز خرسی سال 2026!
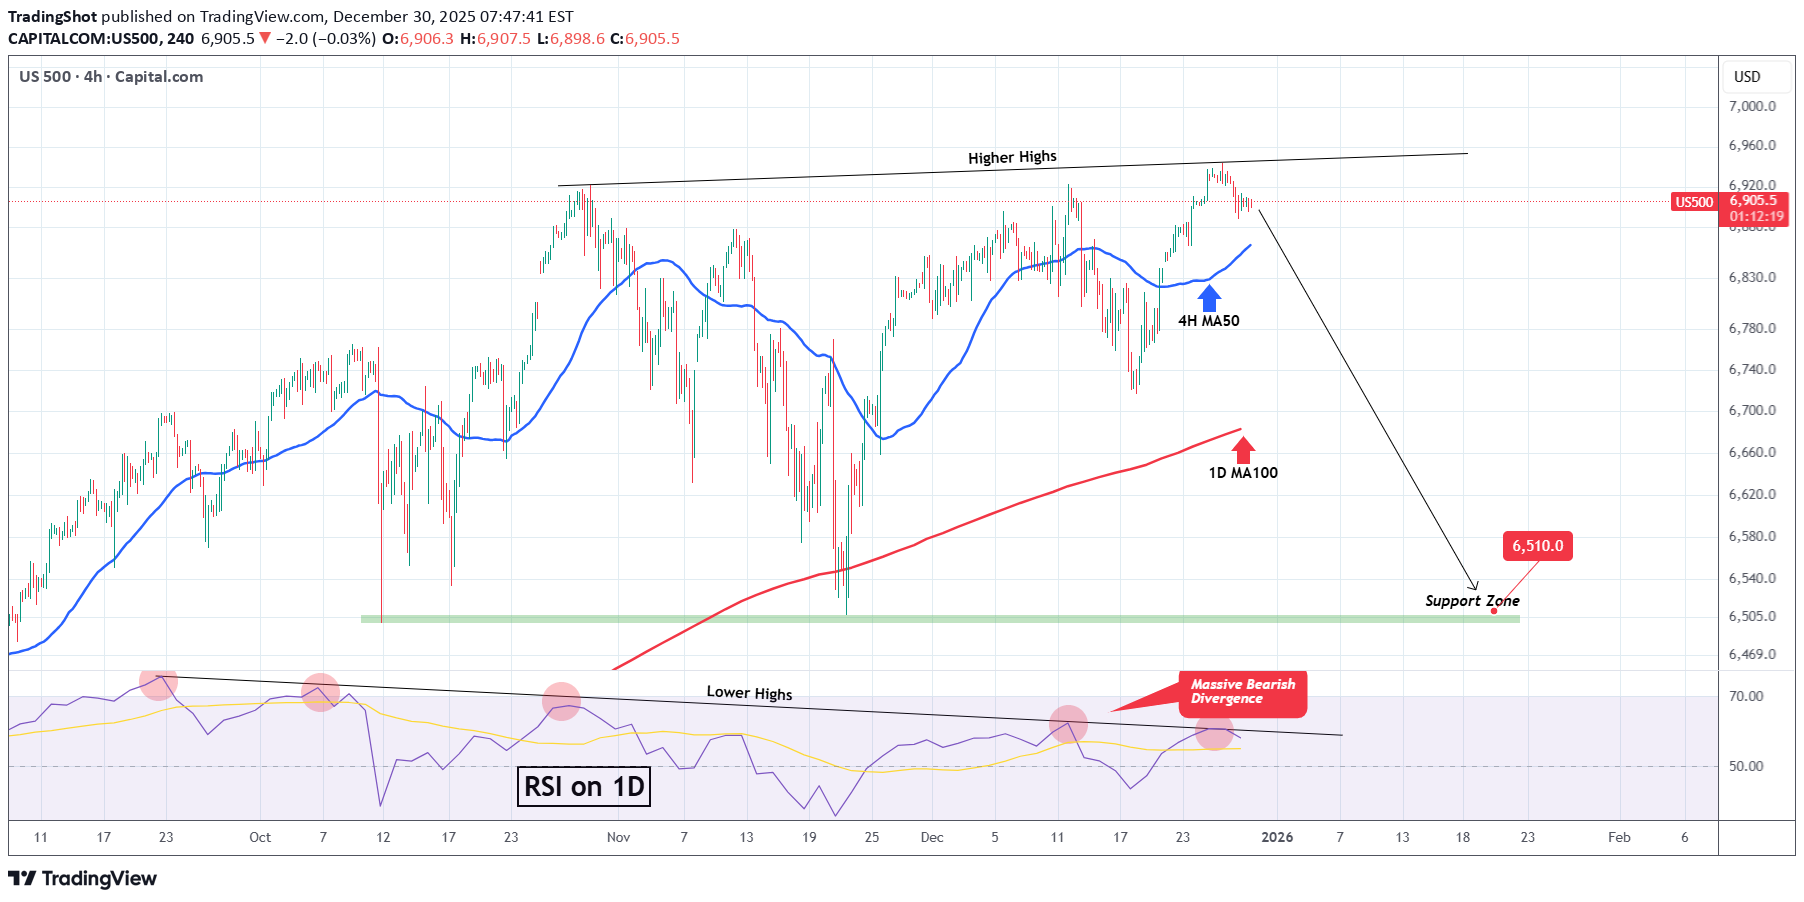
The S&P500 index (SPX) hit last Friday its Higher Highs trend-line and got rejected, so far not aggressively. The 1D RSI rejection though on a Lower Highs trend-line that goes as back as the September 22 High, illustrates a massive Bearish Divergence (Lower Highs against price's Higher Highs), has the potential to accelerate the decline first to the 1D MA100 (red trend-line) and then the lower Support Zone. As long as the Higher Highs trend-line holds, we expect the index to target 6510 (top of Support Zone) at least within January 2026. --- ** Please LIKE 👍, FOLLOW ✅, SHARE 🙌 and COMMENT ✍ if you enjoy this idea! Also share your ideas and charts in the comments section below! This is best way to keep it relevant, support us, keep the content here free and allow the idea to reach as many people as possible. ** --- 💸💸💸💸💸💸 👇 👇 👇 👇 👇 👇
TradingShot
BITCOIN It's really game over if it does that..
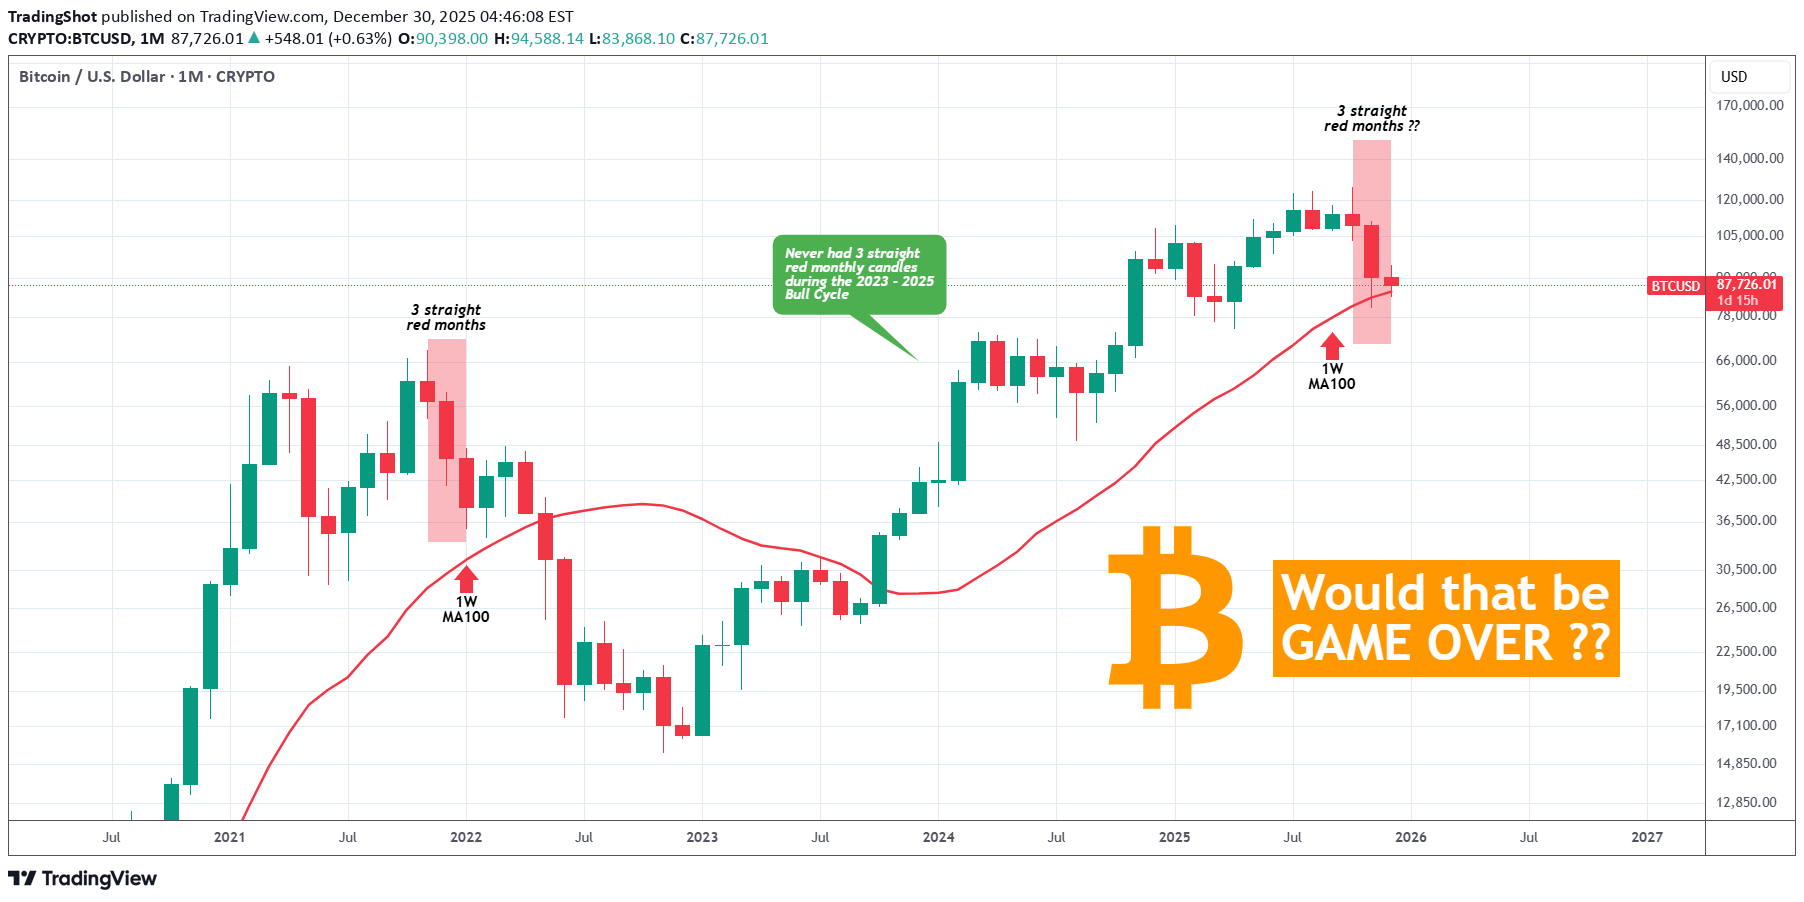
Not much analysis is needed to address today's topic. Bitcoin (BTCUSD) will close tomorrow not only the year (2025) but also the month (December). This is a critical closing as the 1M (monthly) candle is currently red and if it closes this way (i.e. roughly below $90300), BTC will complete three straight red months. Why this s important? Because during its 2023 - 2025 Bull Cycle, it never had three bearish 1M candles in a row and that could be a definitive confirmation that the new Bear Cycle is already underway. In fact it would be almost a perfect match with the first 3 months of the previous Bear Cycle, which were also 3 straight red ones (November 2021 - January 2022), also supported by the 1W MA100 (red trend-line). A lifeline of encouragement would be however that, following those first 3 red candles of the previous Bear Cycle, the market found support on the 1W MA100 and rebounded the next two months (but of course only to drop more aggressively in the later stages). It has to be noted also at this point that 3 straight red months has historically been a strong feature of Bear Cycle activity. In fact only twice Bitcoin displayed 3 straight red months during Bull Cycles: April - June 2021 and July - September 2019. So if December closes in red tomorrow, would that be GAME OVER for BTC? Feel free to let us know in the comments section below! --- ** Please LIKE 👍, FOLLOW ✅, SHARE 🙌 and COMMENT ✍ if you enjoy this idea! Also share your ideas and charts in the comments section below! This is best way to keep it relevant, support us, keep the content here free and allow the idea to reach as many people as possible. ** --- 💸💸💸💸💸💸 👇 👇 👇 👇 👇 👇
Disclaimer
Any content and materials included in Sahmeto's website and official communication channels are a compilation of personal opinions and analyses and are not binding. They do not constitute any recommendation for buying, selling, entering or exiting the stock market and cryptocurrency market. Also, all news and analyses included in the website and channels are merely republished information from official and unofficial domestic and foreign sources, and it is obvious that users of the said content are responsible for following up and ensuring the authenticity and accuracy of the materials. Therefore, while disclaiming responsibility, it is declared that the responsibility for any decision-making, action, and potential profit and loss in the capital market and cryptocurrency market lies with the trader.