
FireHoseReel
@t_FireHoseReel

What symbols does the trader recommend buying?
Purchase History
پیام های تریدر
Filter
FireHoseReel
FireHoseReel | BNB Daily Analysis #29

🔥 Welcome To FireHoseReel ! Let’s dive into Binance Coin (BNB) analysis. 👀 BNB 4H Overview BNB is currently trading inside a 4H range box and is consolidating near the lower part of the range. A newly formed resistance at $870 has been tested three times, but price has failed to break above it so far. 📊 Volume Analysis BNB volume has been declining within the range. However, each time price approaches the key resistance, volume increases slightly before getting rejected, confirming the strength of this level. ✍️ BNB Trading Scenarios 🟢 Long Scenario: A confirmed breakout above $870.39, accompanied by rising buy volume, could provide a solid long trading opportunity. 🔴 Short Scenario: A breakdown below the range low will not be easy. It would require a strong and clear 4H or daily whale candle. After a new structure forms, short triggers may appear. 🧠 Protect your capital first. No setup is worth blowing your account. If risk isn’t controlled, profit means nothing. Trade with rules, not emotions.
FireHoseReel
FireHoseReel | Optimism Near Key Breakout Level as Volume Builds

🔥 Welcome To FireHoseReel ! Let’s dive into Optimism (OP) analysis. ⛳️ OP Fundamental Overview Optimism (OP) helps people use Ethereum faster and cheaper by reducing fees and speeding up transactions for DeFi, NFTs, and apps. Ranked around top 80 on CoinMarketCap, it’s a strong mid-cap Layer-2. 👀 OP 4H Overview Optimism (OP) is trading inside a 4H range box and is currently positioned near the end of its bearish trend. A breakout above the descending curve trendline, followed by a break of the overhead resistances, could initiate a bullish 4H trend for OP. 📊 Volume Analysis As price approached the curve trendline and the dynamic resistance at $0.2825, volume increased noticeably. This suggests that a breakout of this zone could lead to a fast and impulsive price move. ✍️ OP Trading Scenarios 🟢 Long Scenario: A confirmed breakout above $0.2825 with increasing buy volume could allow price to break the top of the range and move toward the $0.3439 resistance. 🔴 Short Scenario: A breakdown below $0.2518 could trigger a fast move toward a lower support level. Strong selling volume confirmation would be required. 🧠 Protect your capital first. No setup is worth blowing your account. If risk isn’t controlled, profit means nothing. Trade with rules, not emotions.
FireHoseReel
FireHoseReel | BNB Daily Analysis #28
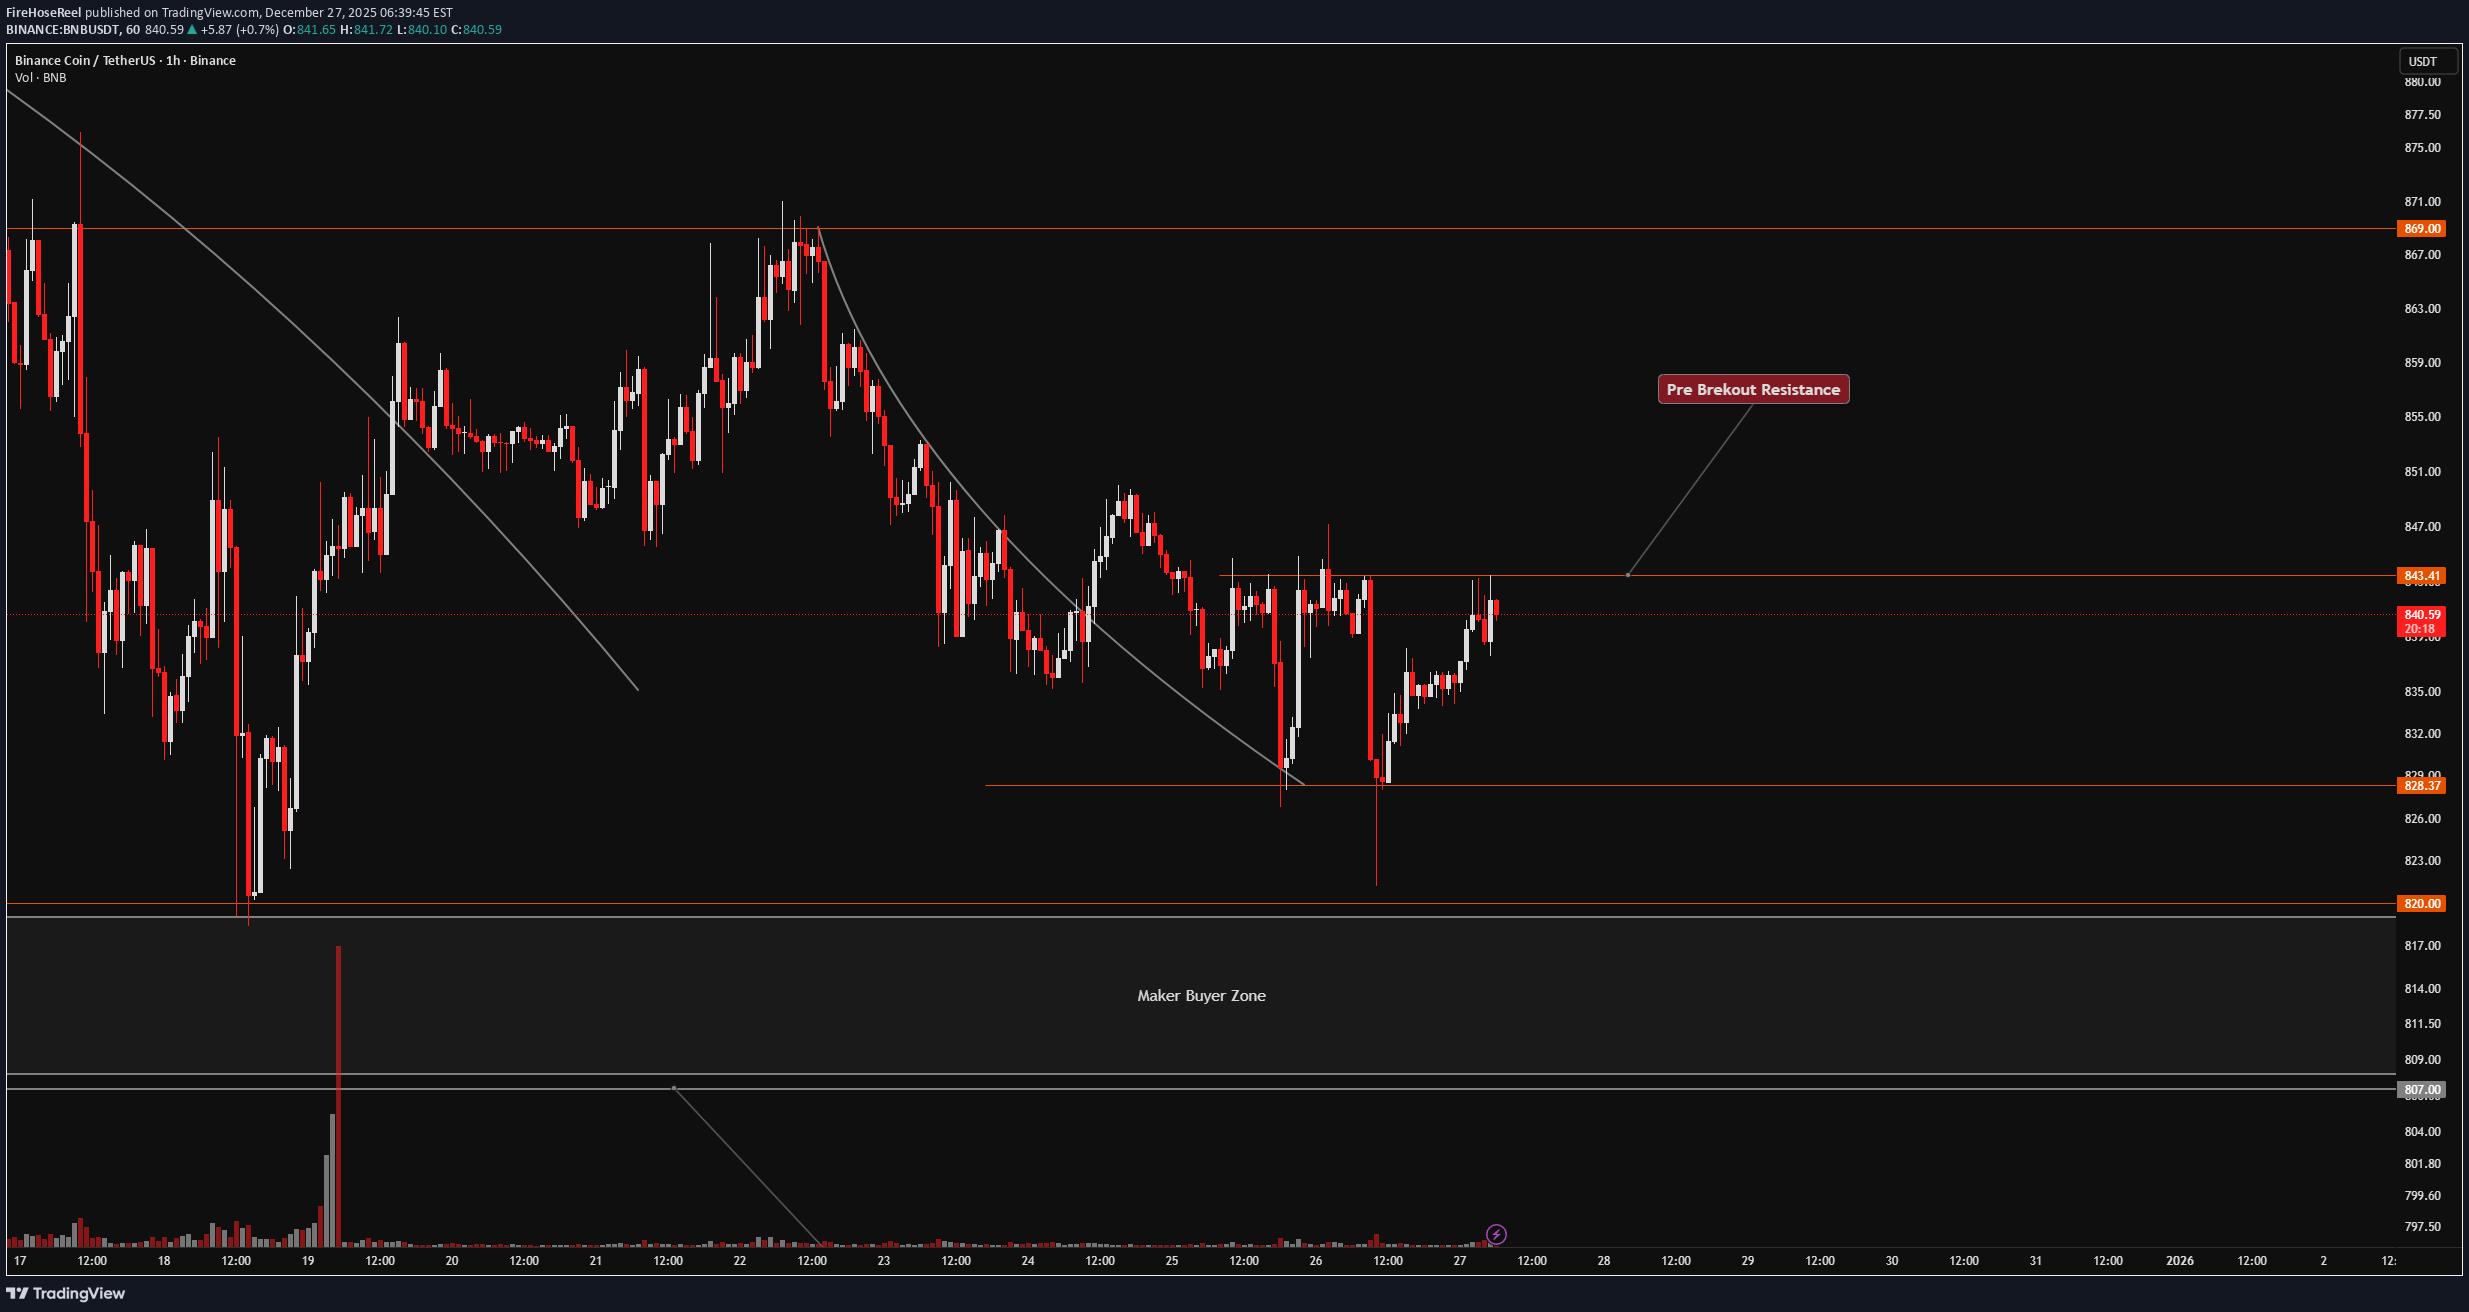
🔥 Welcome To FireHoseReel ! Let’s dive into Binance Coin (BNB) analysis. 👀 BNB 1H Overview BNB bounced strongly from the vicinity of its maker-buyer zone with a very long upper wick, which clearly highlights a key demand/support area. Price is currently trading below the multi-timeframe resistance at $843.11, which also acts as a pre-breakout zone. 📊 Volume Analysis Honestly, there’s not much meaningful insight to extract from BNB volume right now. The volume structure is extremely messy and unreliable, making proper analysis difficult. For that reason, I’m choosing not to rely on volume until it normalizes or the underlying cause becomes clear. ✍️ BNB Trading Scenarios 🟢 Long Scenario: A confirmed breakout above $843.11, accompanied by increasing buy volume, could trigger a high-risk long setup. 🔴 Short Scenario: If the maker zone breaks with a strong whale candle and heavy selling pressure, followed by continuation and a pullback, we can look for entry opportunities using proper setup candles. If price starts moving in that direction, I’ll update the analysis accordingly. 🧠 Protect your capital first. No setup is worth blowing your account. If risk isn’t controlled, profit means nothing. Trade with rules, not emotions.
FireHoseReel
تحلیل زکش (ZEC): آیا این ارز حریم خصوصی آماده شکستن مقاومت حیاتی است؟

🔥 Welcome To FireHoseReel ! Let’s dive into ZCash (ZEC) analysis. ⛳️ ZEC Fundamental Overview Zcash (ZEC) is a long-standing privacy-focused cryptocurrency, usually ranked around #16 on CoinMarketCap, enabling users to send private, non-traceable transactions with strong cryptographic privacy. 👀 ZEC 4H Overview On the 4-hour timeframe, ZEC is trading inside a range box with resistance at $457 and support at $374. Price has reached the upper-middle area of this range, and a breakout above the range high or the midline could drive the next move toward the following resistance or support level. 📊 Volume Analysis Zcash volume has declined over the past few days, but in the last few hours buyers have shown strength by forming a higher low. A strong volume blow-off candle has entered the market, indicating renewed buying interest. ✍️ ZEC Trading Scenarios 🟢 Long Scenario: ZEC is currently pressing against the mentioned resistance. A breakout above this level, supported by increasing buying volume and RSI crossing above the 70 momentum threshold into overbought territory, could confirm the breakout and open the path toward the next resistance. 🔴 Short Scenario: A breakdown below the box midline at $374, accompanied by visible selling pressure and RSI dropping below the 33 momentum zone, could trigger a move down toward the next support level. 🧠 Protect your capital first. No setup is worth blowing your account. If risk isn’t controlled, profit means nothing. Trade with rules, not emotions.
FireHoseReel
تحلیل روزانه BNB: نبرد حساس بین ۸۵۰ و ۸۳۵ دلار!
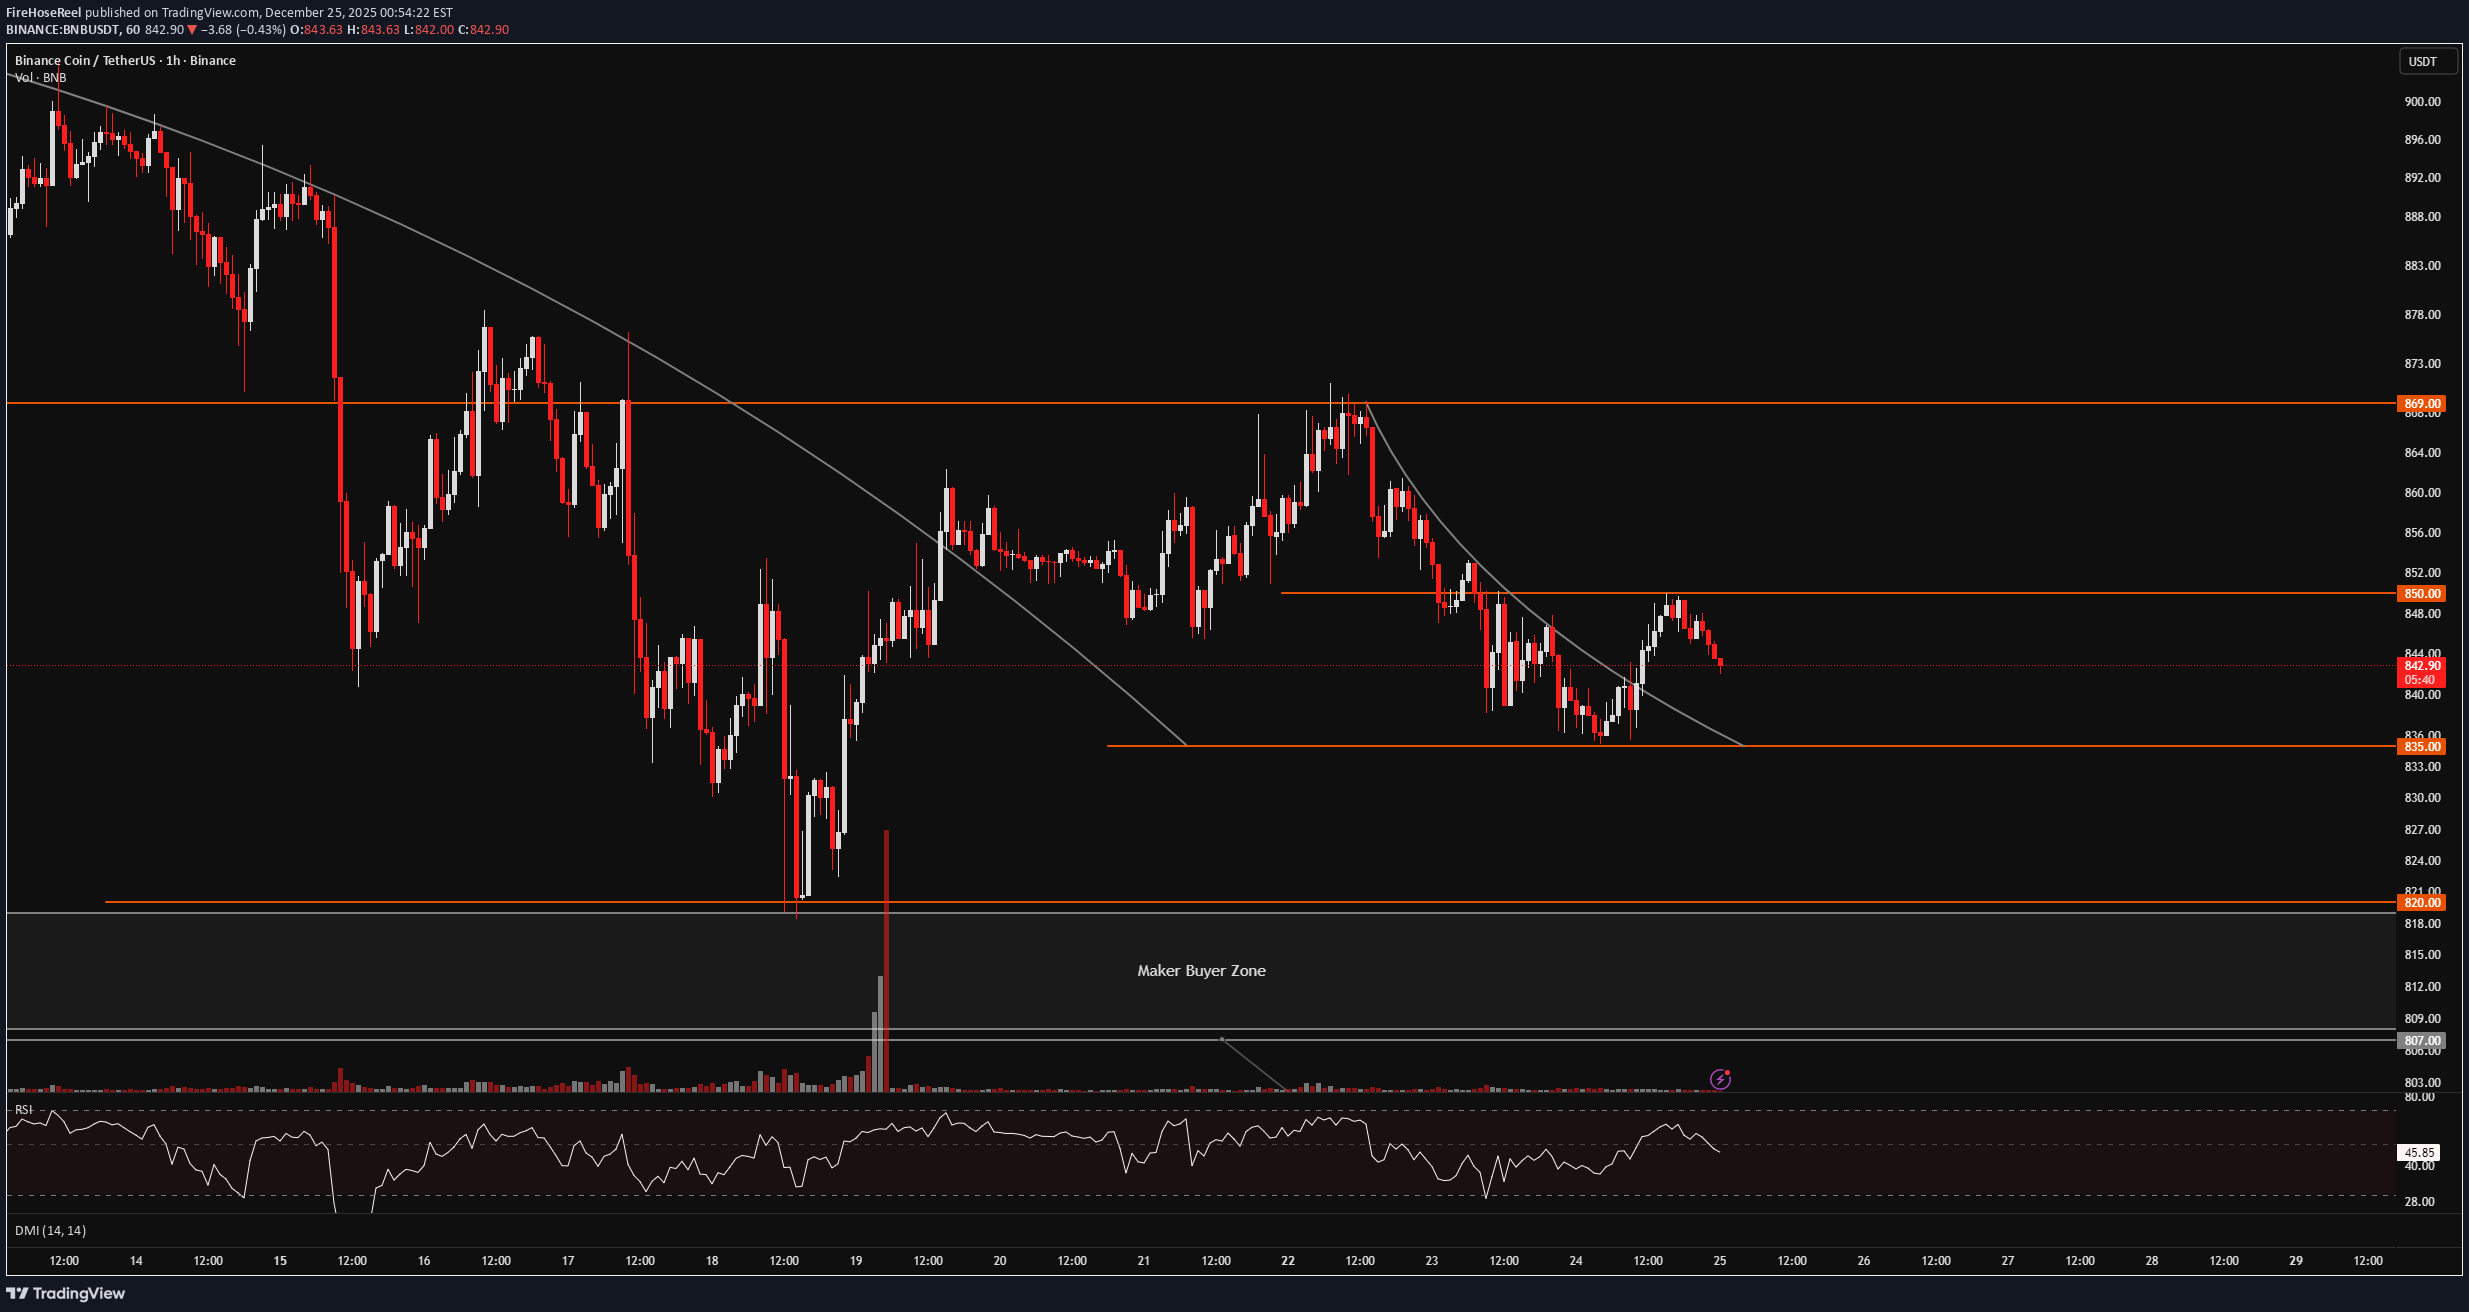
🔥 Welcome To FireHoseReel ! Let’s dive into Binance Coin (BNB) analysis. 👀 BNB 1H Overview After its recent declines, BNB is currently ranging on the 1-hour timeframe between the $850 resistance and the $835 support. A breakout from either side could lead to a move toward the next key resistance or support level. 📊 Volume Analysis On the 1-hour timeframe, BNB volume looks unclear to me. Volume has dropped significantly and doesn’t provide a strong or reliable signal at the moment, making it difficult to interpret what is happening from a volume perspective. ✍️ BNB Trading Scenarios 🟢 Long Scenario: A breakout above $850 accompanied by increasing buying volume could trigger a move toward $870, making it a valid long setup. 🔴 Short Scenario: A breakdown below the $835 support with visible selling volume could push price toward its next maker buyer zone, where we can then reassess market behavior. 🧠 Protect your capital first. No setup is worth blowing your account. If risk isn’t controlled, profit means nothing. Trade with rules, not emotions.
FireHoseReel
هشدار جدی برای هولدرهای WLD: آیا سقوط بزرگ در راه است؟ تحلیل دقیق رنج قیمتی!

🔥 Welcome To FireHoseReel ! Let’s dive into Worldcoin (WLD) analysis. ⛳️ WLD Fundamental Overview Worldcoin (WLD) is a digital identity and crypto project using biometric proof of personhood. Ranked #52 on CoinMarketCap, it has ~2.58B circulating supply, ~$1.24B market cap, and steady daily volume. 👀 WLD 4H Overview After recent sell-offs, WLD is trading below a descending curve trendline. Price is currently ranging between the $0.5587 resistance and $0.4728 support. A breakout from this structure could offer a solid trading opportunity. 📊 Volume Analysis Worldcoin is experiencing strong selling pressure, with sell-side momentum and fear outweighing buying interest. Sellers are currently driving price toward the lower boundary of the range. ✍️ WLD Trading Scenarios 🟢 Long Scenario: There are two resistance-based long setups to choose from. The first is our pre-breakout trigger at the orange trendline around $0.5247, which requires increasing buying volume to activate a long. The second and stronger long trigger is the monthly resistance at $0.5587. 🔴 Short Scenario: The short setup is straightforward. A breakdown below the daily support at $0.4728, confirmed by rising sell volume, could provide a valid short entry. 🧠 Protect your capital first. No setup is worth blowing your account. If risk isn’t controlled, profit means nothing. Trade with rules, not emotions.
FireHoseReel
FireHoseReel | WIF at Decision Point Will 0.317 Hold or Collapse

🔥 Welcome To FireHoseReel ! Let’s dive into Dogwifhat (WIF) analysis. ⛳️ WIF Fundamental Overview Dogwifhat (WIF) is a Solana-based meme coin focused on community-driven trading and speculation. Ranked #121 on CoinMarketCap, it has ~998.8M supply and strong daily volume fueled by hype. 👀 WIF 4H Overview WIF is currently experiencing a strong bearish trend on higher timeframes. On the 4H timeframe, price is moving inside a large range (box) and is now attempting to break down below the lower boundary of that range. 📊 Volume Analysis During upward pullbacks, trading volume tends to decrease, while selling volume expands during bearish continuation. If the box support breaks, an increase in sell volume is expected to confirm the breakdown. ✍️ WIF Trading Scenarios 🟢 Long Scenario: A breakout above the descending curve trendline, followed by a reaction toward the $0.361 resistance, accompanied by a strong surge in buying volume, could initiate a bullish leg relative to the recent decline. 🔴 Short Scenario: A breakdown below the box structure and loss of the $0.317 support, confirmed by increasing sell volume, could provide a solid short opportunity. 🧠 Protect your capital first. No setup is worth blowing your account. If risk isn’t controlled, profit means nothing. Trade with rules, not emotions.
FireHoseReel
تحلیل روزانه لحظه آخری BNB: آیا پامپ بعدی در راه است یا سقوط قریبالوقوع؟

🔥 Welcome To FireHoseReel ! Let’s dive into Binance Coin (BNB) analysis. 👀 BNB 4H Overview BNB has reached the vicinity of its key resistance but was rejected after forming a lower high compared to the previous peak. Price is now rotating downward and moving toward the lower boundary of the range (box). 📊 Volume Analysis As price approached the $876.76 resistance, buying volume weakened and failed to support a breakout. This lack of demand caused a rejection from the level, allowing sellers to take control of price action. ✍️ BNB Trading Scenarios 🟢 Long Scenario: Our risky pre-breakout trigger has shifted slightly lower and is now located above the newly formed lower high at $869.32. A breakout above this level, accompanied by rising buying volume, would activate our long trigger. 🔴 Short Scenario: A breakdown of the maker buyer zone, ranging from $819.90 to $807.46, is expected to occur with a strong impulsive (whale) candle. If this level is broken, we will wait for a pullback to enter short positions. 🧠 Protect your capital first. No setup is worth blowing your account. If risk isn’t controlled, profit means nothing. Trade with rules, not emotions.
FireHoseReel
FireHoseReel | ONE Compression Below 0.0037 Signals Expansion

🔥 Welcome To FireHoseReel ! Let’s dive into Harmony (ONE) analysis. ⛳️ ONE Fundamental Overview Harmony (ONE) is a layer-1 blockchain focused on fast, low-fee transactions and sharding scalability. ONE is currently ranked around #330 on CoinMarketCap and is used for fees, staking, and governance. 👀 ONE 4H Overview ONE has been trading inside a 4H range and is now testing the top of the range and its key resistance at $0.0037. A breakout above this level could trigger a bullish leg, potentially retracing part of the previous downside move. 📊 Volume Analysis During the recent declines, ONE showed strong selling pressure. Now, as price trades just below resistance, the move toward this level has been supported by rising buy volume, which increases the probability of a breakout. ✍️ ONE Trading Scenarios 🟢 Long Scenario: A breakout above $0.0037, with sustained buying volume and active buyer participation, along with RSI breaking above 60.1, could provide a solid long setup. 🔴 Short Scenario: A breakdown below $0.00347, combined with increasing sell volume, a strong rejection from the current resistance, and RSI dropping below 45.85, could activate a short trigger. 🧠 Protect your capital first. No setup is worth blowing your account. If risk isn’t controlled, profit means nothing. Trade with rules, not emotions.
FireHoseReel
LDO Forming Higher Low Under Daily Resistance

🔥 Welcome To FireHoseReel ! Let’s dive into Lido DAO (LDO) analysis. ⛳️ LDO Fundamental Overview Lido DAO (LDO) is a leading liquid-staking governance token ranked around #84 on CoinMarketCap, enabling ETH staking rewards while keeping assets liquid and driving DeFi participation. 👀 LDO 4H Overview LDO bounced from a monthly support level and moved higher, forming a higher low at $0.5267. Price is now trading just below its daily resistance at $0.5591. 📊 Volume Analysis After testing the daily resistance, LDO experienced declining volume and selling pressure. Following the higher low formation, buyers stepped in again. If buying volume continues, the $0.5591 resistance could be broken. ✍️ LDO Trading Scenarios 🟢 Long Scenario: A breakout above $0.5591 with increasing buy volume, along with RSI breaking above 56.58, increases the probability of a breakout and can trigger a long setup. 🔴 Short Scenario: A breakdown below the current low at $0.5267, combined with rising sell volume and RSI dropping below 41.94, can activate a short setup. 🧠 Protect your capital first. No setup is worth blowing your account. If risk isn’t controlled, profit means nothing. Trade with rules, not emotions.
Disclaimer
Any content and materials included in Sahmeto's website and official communication channels are a compilation of personal opinions and analyses and are not binding. They do not constitute any recommendation for buying, selling, entering or exiting the stock market and cryptocurrency market. Also, all news and analyses included in the website and channels are merely republished information from official and unofficial domestic and foreign sources, and it is obvious that users of the said content are responsible for following up and ensuring the authenticity and accuracy of the materials. Therefore, while disclaiming responsibility, it is declared that the responsibility for any decision-making, action, and potential profit and loss in the capital market and cryptocurrency market lies with the trader.