
John_Isige
@t_John_Isige

What symbols does the trader recommend buying?
Purchase History
پیام های تریدر
Filter
استارکنت (STRK): آیا شکست ۰.۲۴۶۷ قیمت را به کجا میبرد؟
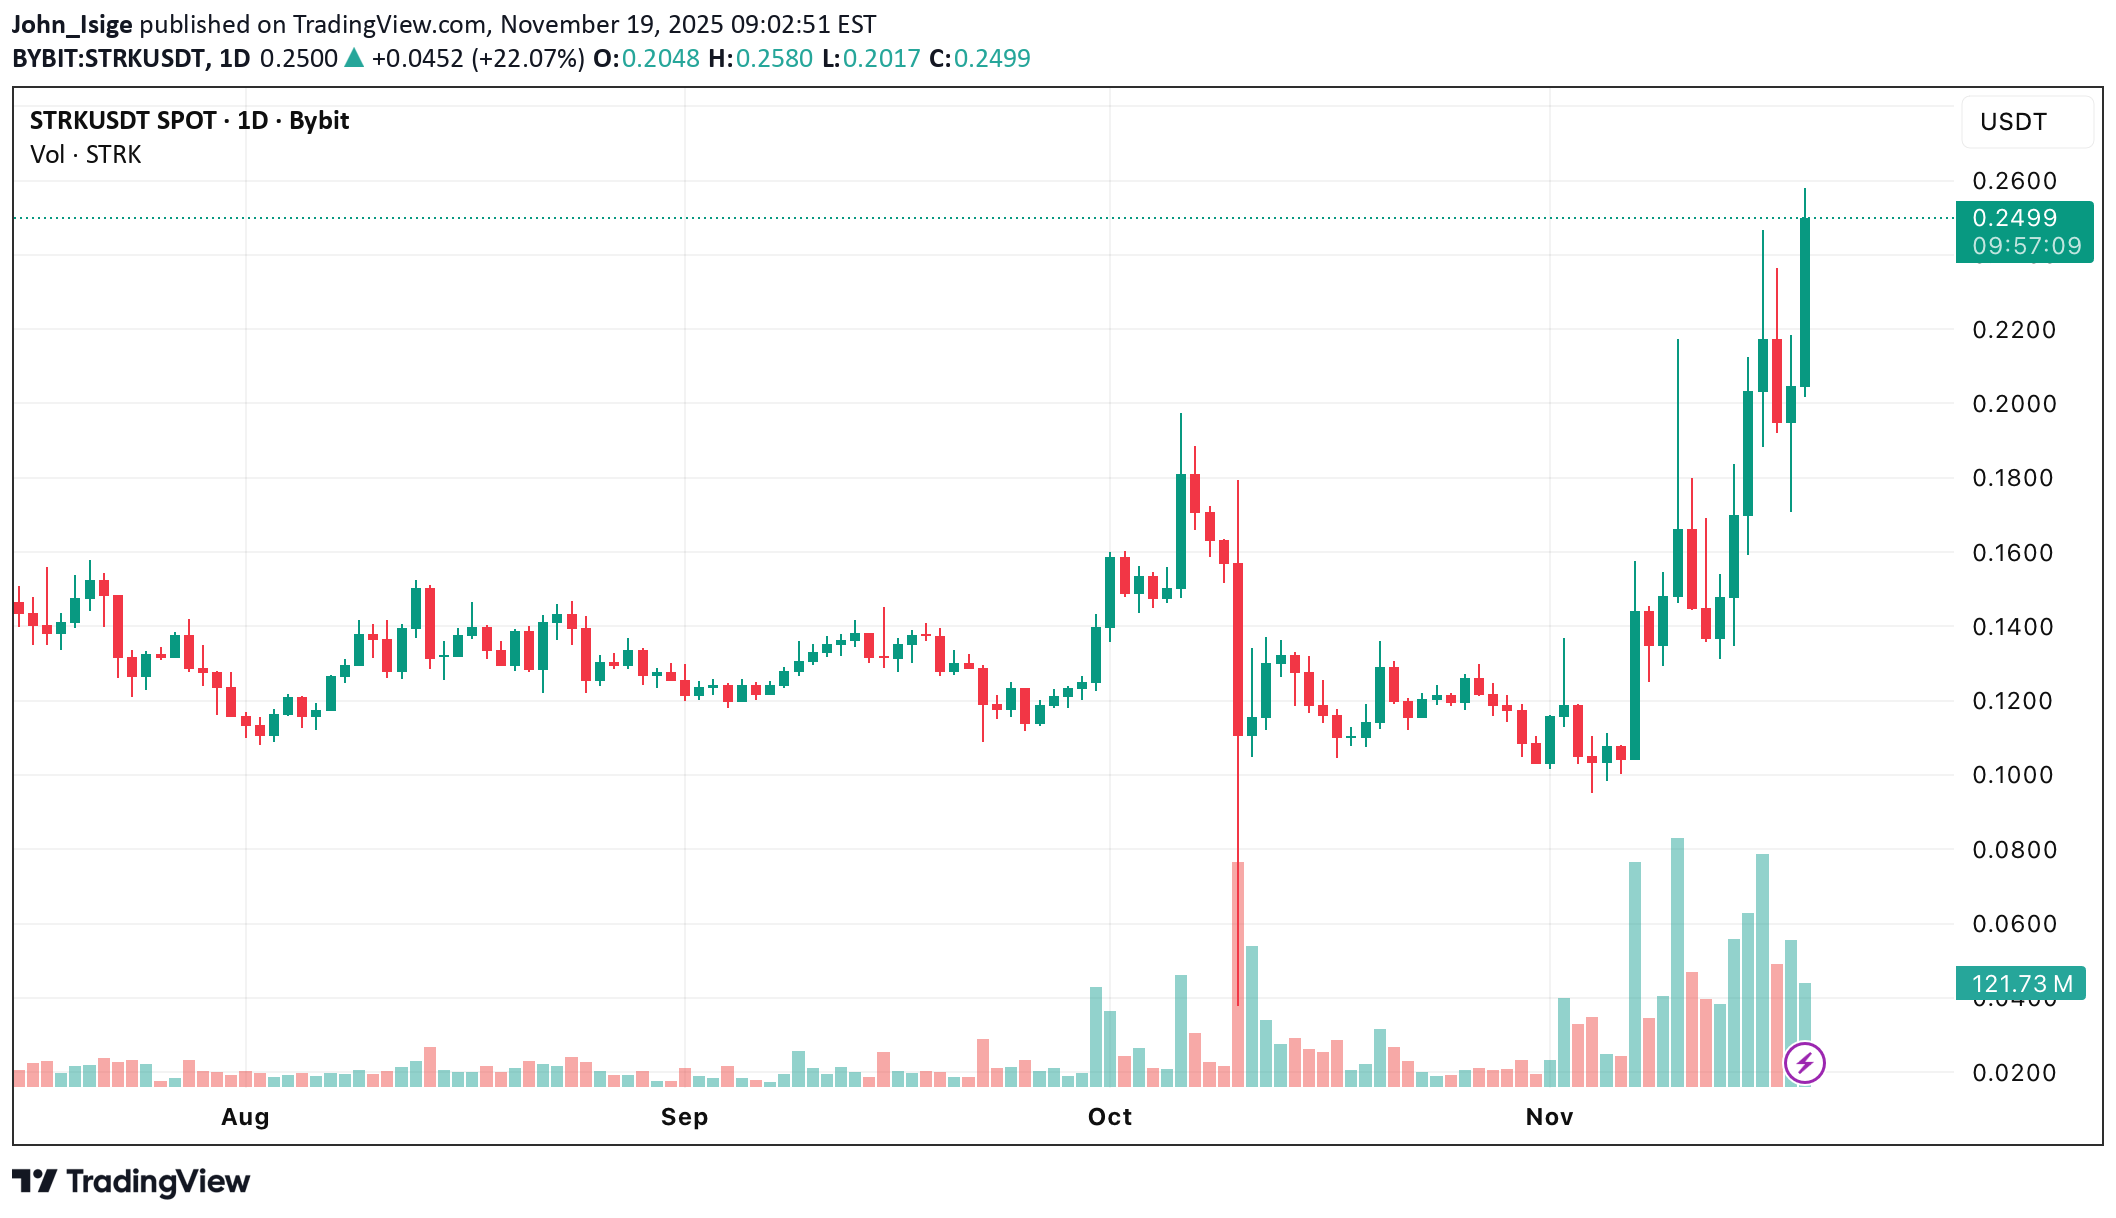
Starknet (STRK) continues its strong rebound after broad market sell-offs, maintaining a clean short-term uptrend. Price action remains constructive, holding firmly above the 20-day EMA (0.2074) and forming higher highs and higher lows — a classic bullish structure. Over the past 24 hours, STRK traded between 0.2321–0.2459, with the latest close at 0.2417, well above yesterday’s 0.1911. Rising volume supports the move, while market cap is now $1.09B. Key Technical Signals •Price above 20-EMA → trend intact •RSI (61) → bullish momentum without overbought stress •Momentum histogram → strengthening positive impulse •Bollinger width at 0.064 → volatility rising but controlled Immediate resistance sits at 0.2393–0.2467, and this zone is the key trigger for the next trend leg. ⸻ Scenario Outlook (TradingView Style) 🔵 Neutral Scenario (40%) •Range: 0.205 – 0.260 •Trigger: RSI stays between 50–65, price consolidates above EMA-20 •Invalidation: 0.195 •Key Levels: •EMA-20 at 0.2074 •Upper Bollinger at 0.2440 •Fibonacci support at 0.1560 Neutral bias holds as long as STRK respects 0.2074 and volatility remains stable (<150M volume). ⸻ 🟢 Bullish Scenario (35%) •Target: 0.247 – 0.350 •Trigger: •Breakout above 0.2467 •Daily candle closes above key resistance •Volume >150M •RSI pushes above 70 •Invalidation: 0.20 •Long-term reference: ATH at 4.41 USD A clean break of 0.2467 could ignite momentum toward 0.30–0.35. ⸻ 🔴 Bearish Scenario (25%) •Target: 0.12 – 0.20 •Trigger: •Drop below EMA-20 (0.2074) •RSI dips under 50 •Breakdown below 0.1560 Fibonacci •Invalidation: 0.26 •Key Levels: •Lower Bollinger at 0.1796 •Fib support 0.1560 Below 0.195, pressure increases sharply and sellers regain control. ⸻ Short-Term Outlook The structure remains bullish above 0.2074, and a breakout above 0.2467 will likely attract new buyers and unlock upside toward 0.30–0.35. Below 0.195, the trend weakens and risk shifts toward 0.1560.
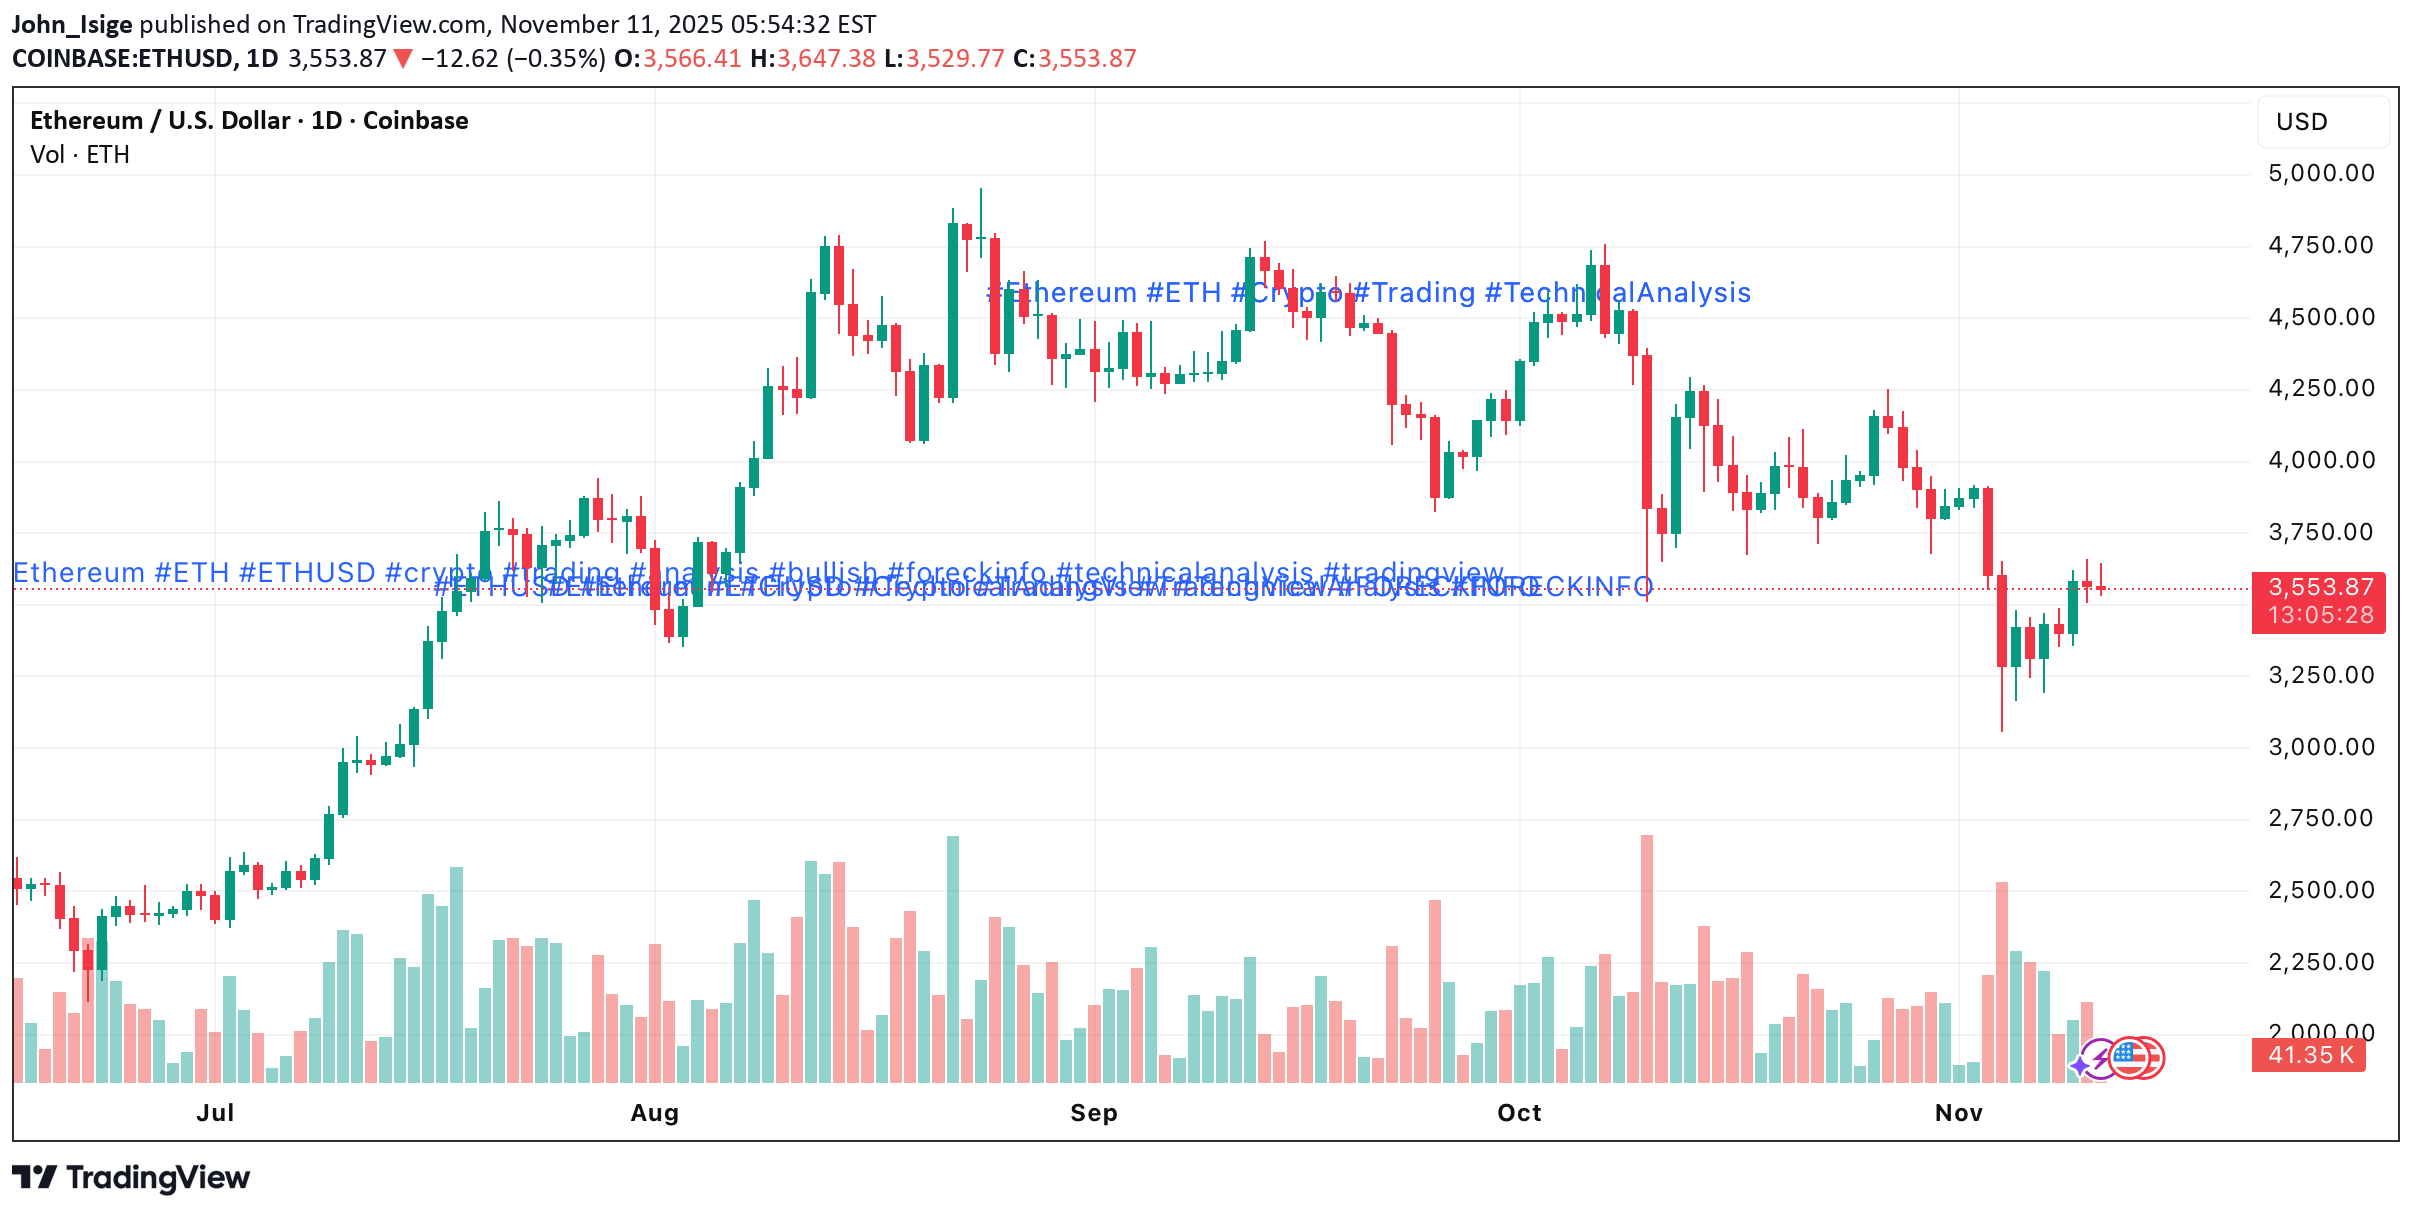
فروپاشی بزرگ اتریوم: آیا قیمت ETH به ۲۵۰۰ دلار میرسد؟
Ethereum extended its decline last week and broke below 3,125 (Murray [2/8]), updating the July low with a drop to 2,950. The market remains dominated by risk-off sentiment as the Fed signals the possibility of pausing rate cuts in December, geopolitical tension increases, and uncertainty around AI-driven tech investments grows. The Fear & Greed Index sits at 11 (extreme fear), while ETF outflows intensified: •ETH ETFs: –$1.4B (≈7% of AUM) •BTC ETFs: –4% On-chain activity also confirms weakening demand: ETH deposits fell 13% to a four-month low, and weekly DEX volume declined 27% to $17.4B. The fundamental backdrop continues to favor the bears. ⸻ Technical Setup ETH/USD broke below its descending channel and consolidated under 3,125, opening a clear path to deeper downside targets: Bearish Structure •Price trades below the mid-Bollinger band •Bollinger Bands point downward •MACD expands in the negative zone •Stochastic remains flat inside oversold conditions Unless ETH reclaims 3,750, the trend remains decisively bearish. ⸻ Key Levels Resistance: 3,750 · 4,375 · 5,000 Support: 3,125 · 2,500 · 2,187 ⸻ Trading Plan 🔻 Primary Scenario — SELL STOP •Entry: 2,960 •TP1: 2,500 •TP2: 2,187 •SL: 3,300 •Bias: bearish continuation •Timeframe: Weekly (5–7 days) 🔼 Alternative Scenario — BUY STOP •Entry: 3,770 •TP1: 4,375 •TP2: 5,000 •SL: 3,360 •Bias: reversal only above 3,750 ⸻ ETH remains in a strong downtrend after losing the 3,125 support zone. A move below 2,960 confirms continuation toward 2,500 → 2,187, while only a breakout above 3,750 would signal a potential trend reversal.
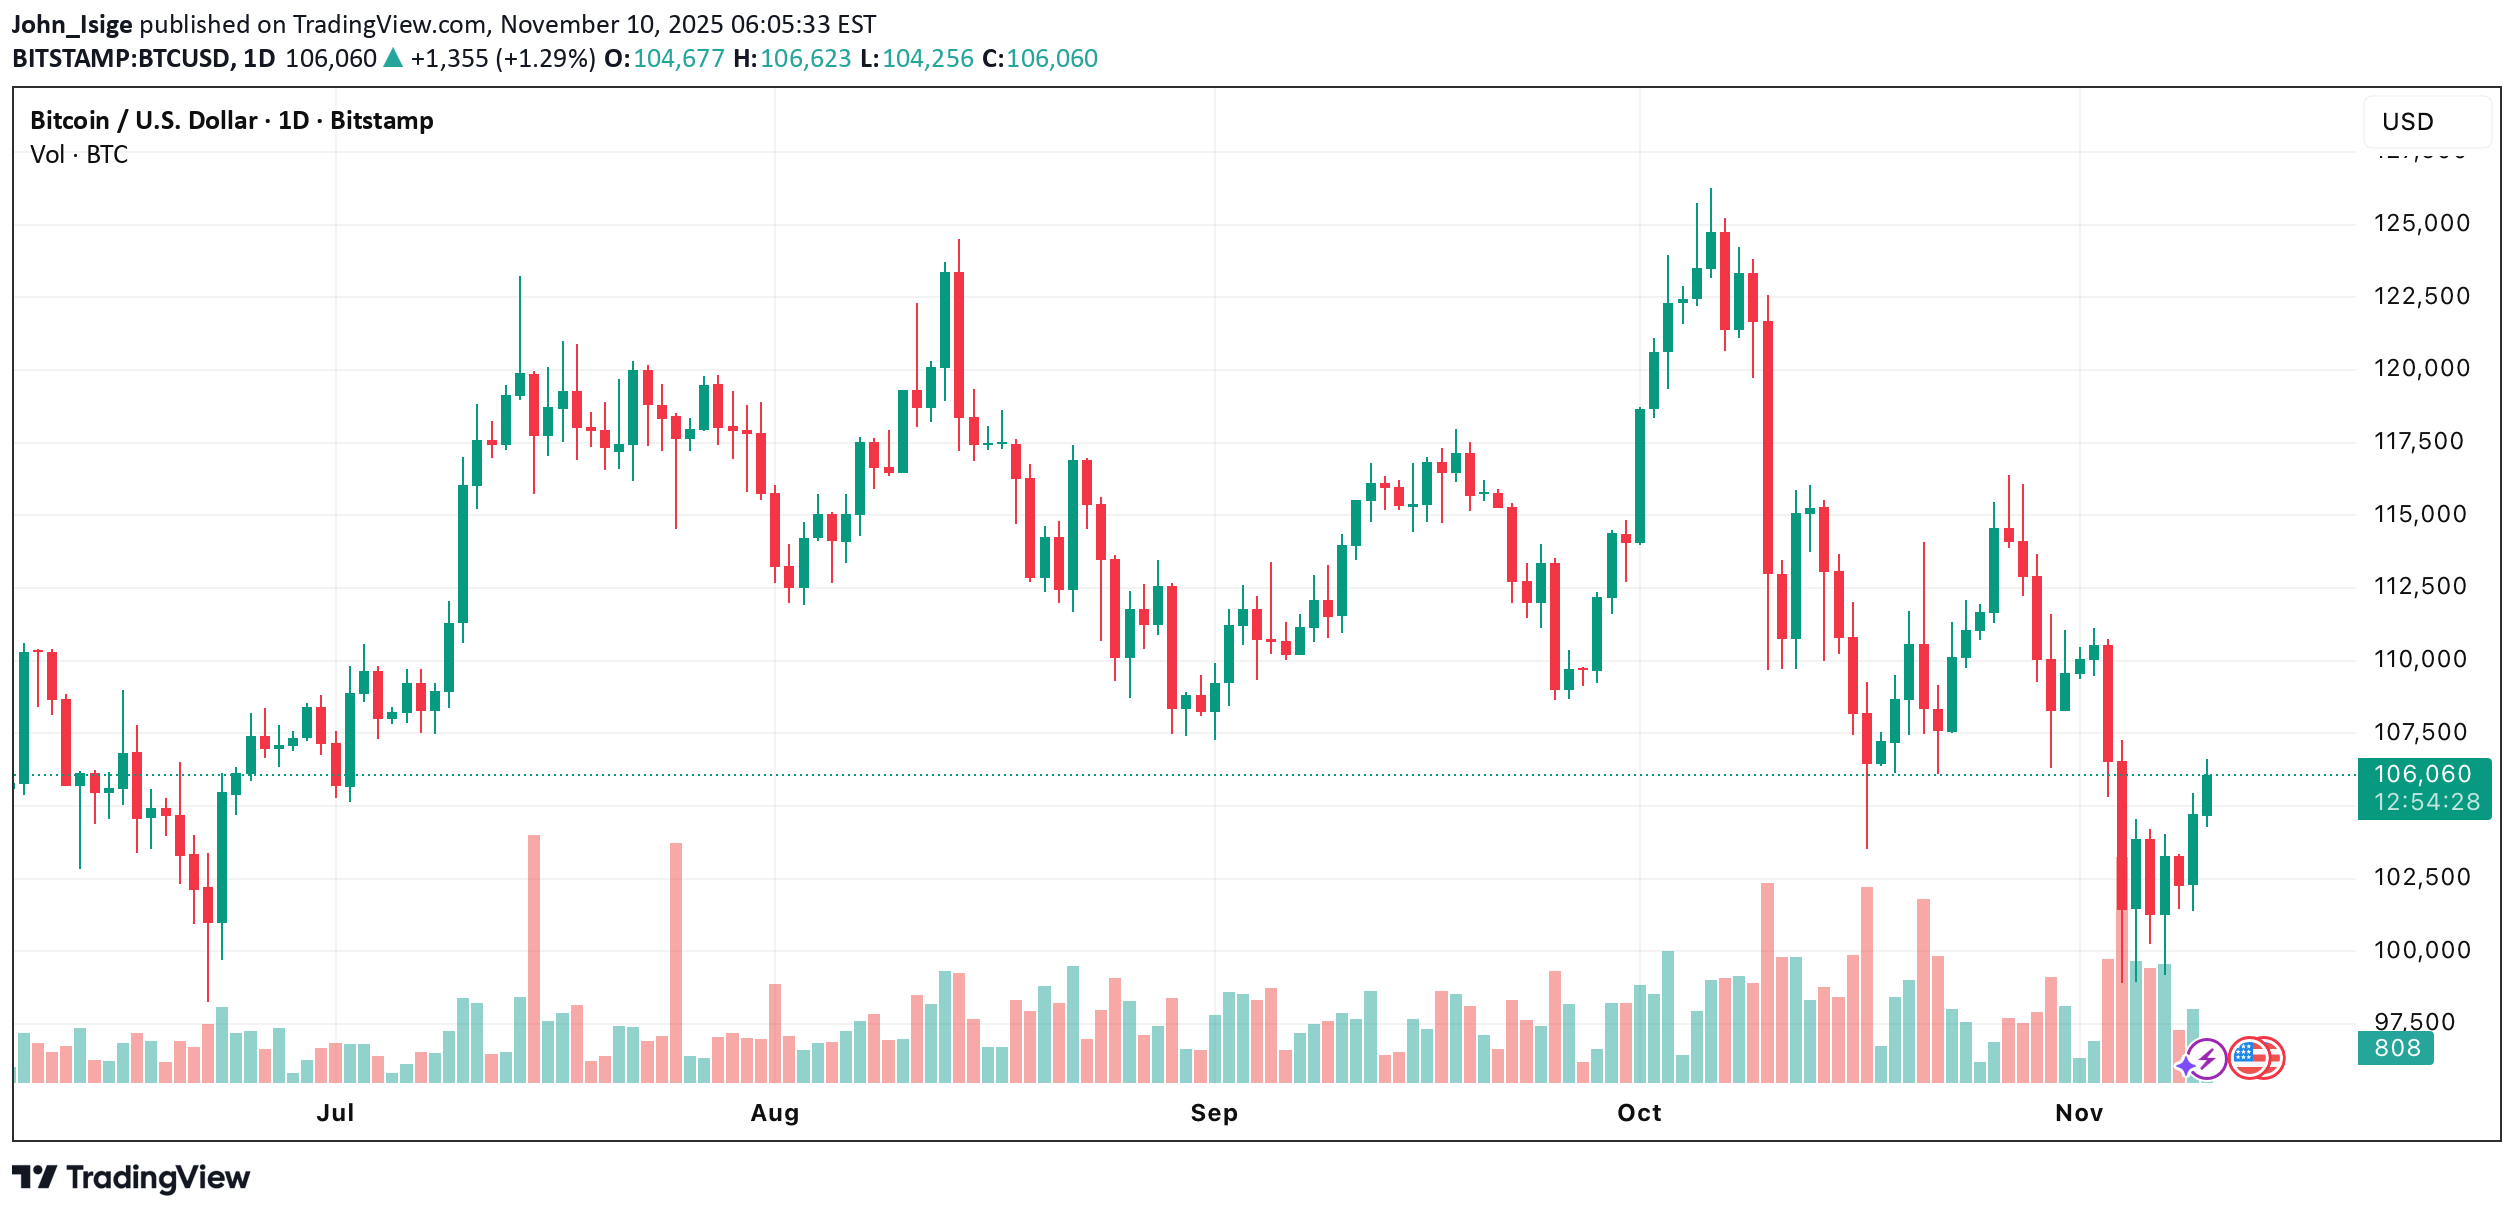
بیت کوین سقوط کرد: از دست رفتن تمام سودهای سالانه و زنگ خطر ریزش عمیقتر!
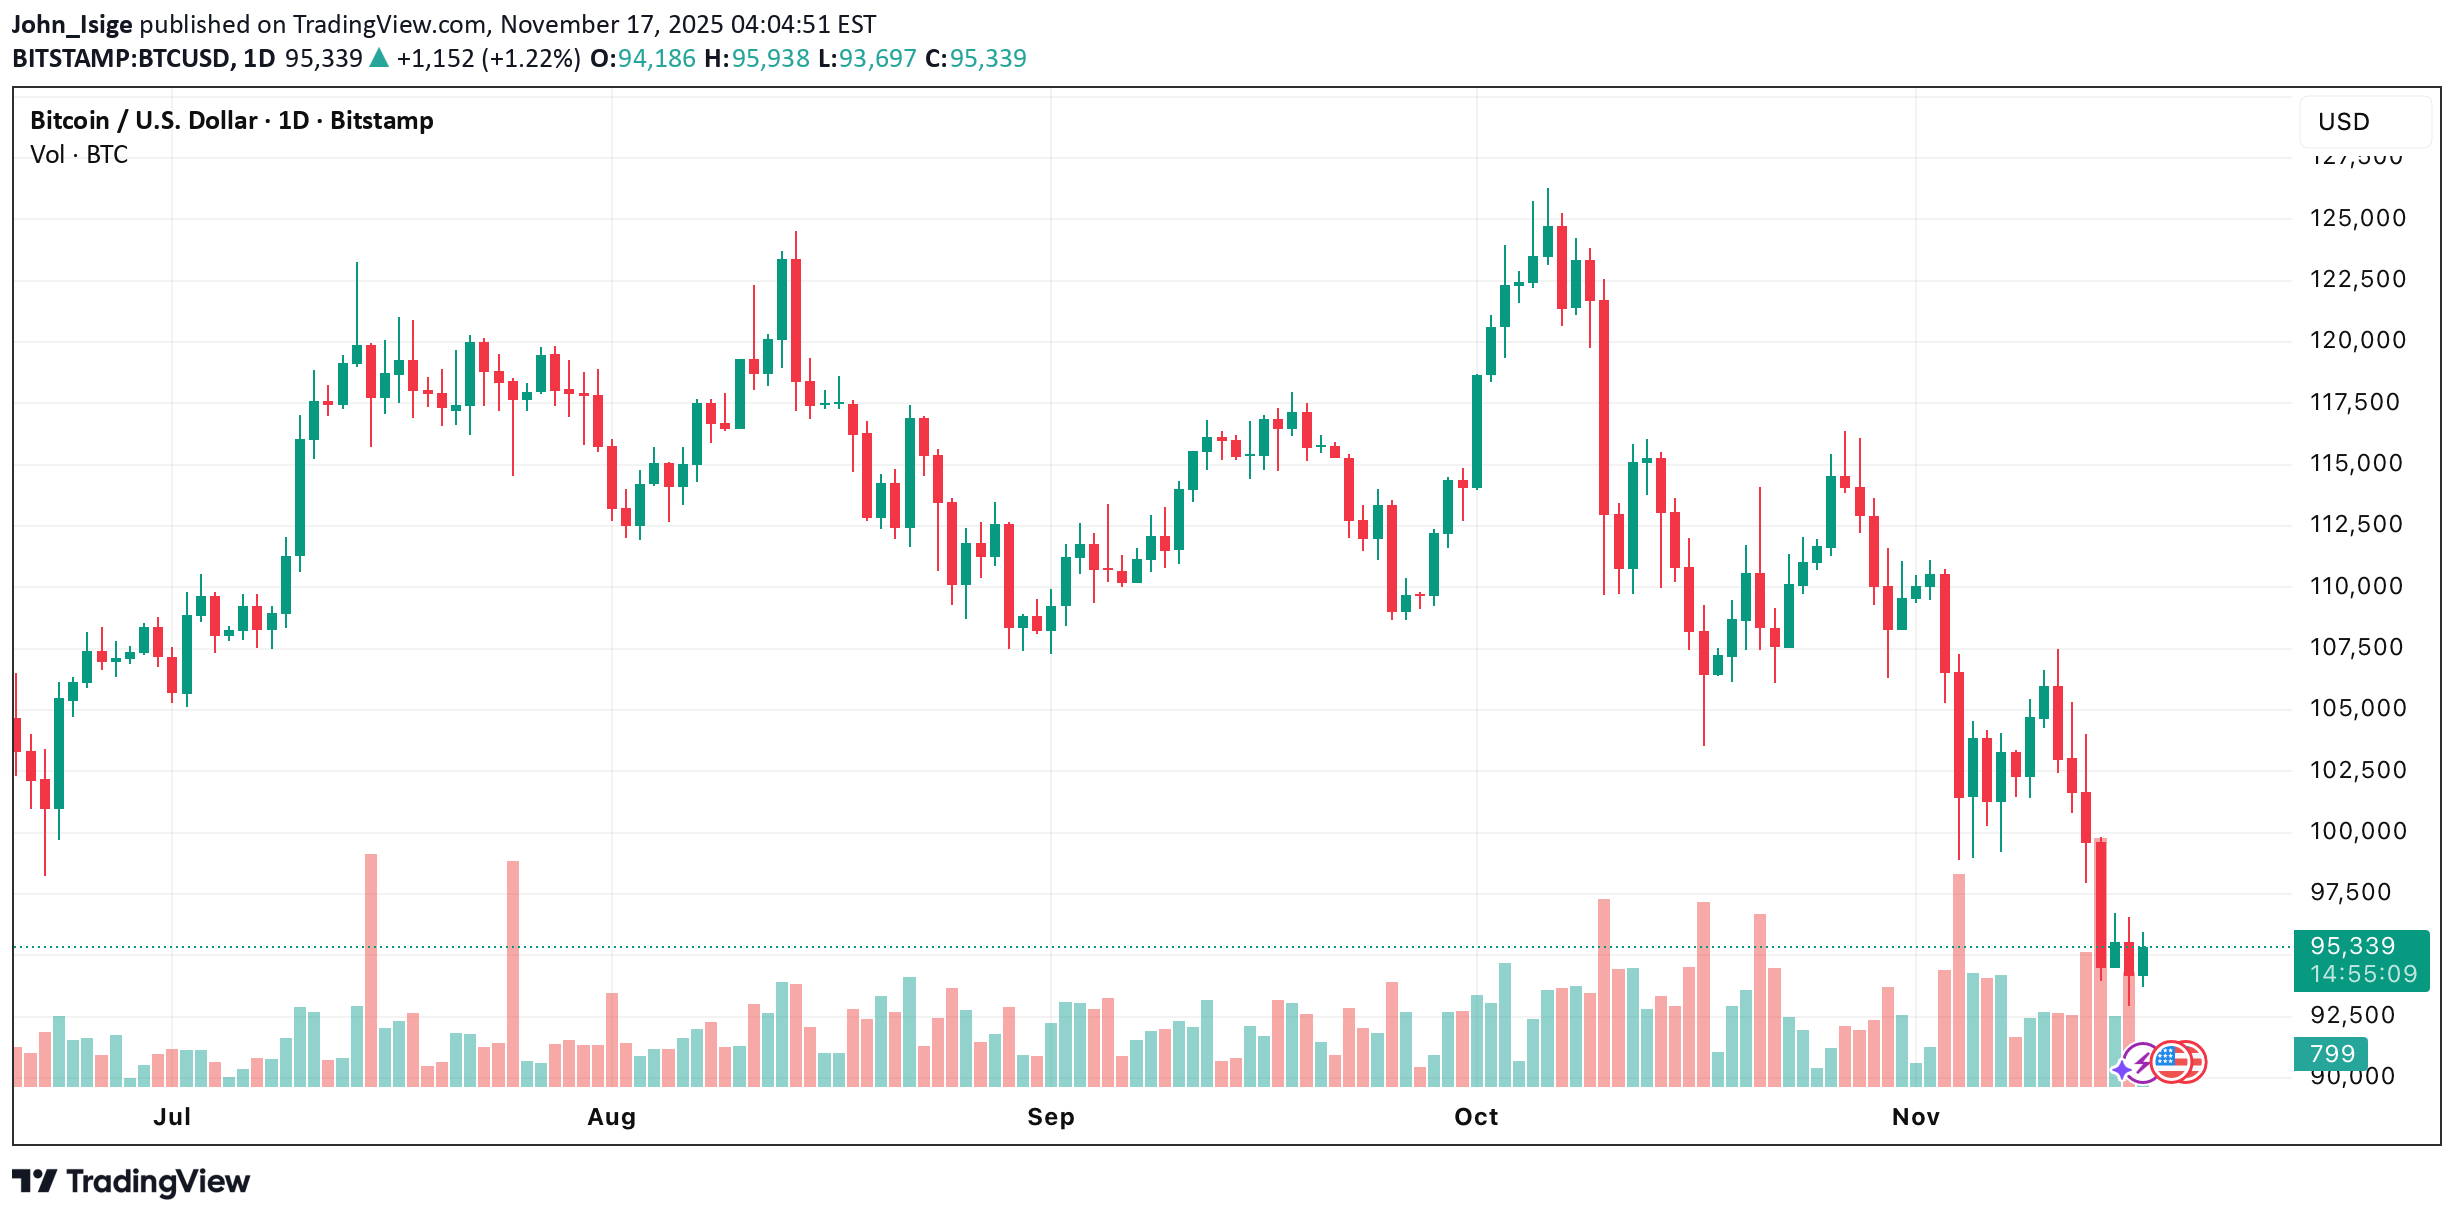
BTC/USD fell to 93,750 (Murray –1/8) last week, wiping out nearly all gains accumulated this year. The decline was driven by two major factors: 1. Fed pause risk grows — dollar strengthens The probability of a December rate cut has dropped to 49%, according to CME FedWatch. Even previously dovish members — such as Boston Fed’s Susan Collins — now support a pause to assess the impact of earlier cuts. A stronger USD continues to pressure risk assets, including Bitcoin. 2. Profit-taking from large investors After the post-election crypto rally driven by the crypto-friendly Trump administration, major holders began locking in profits. Fear & Greed Index: •14 (“Extreme Fear”) now •10 over the weekend ETF outflows: •–$1.636B from Bitcoin ETFs over the last 3 sessions → confirming sustained selling pressure. ⸻ Technical Picture BTC/USD is attempting to break below the descending channel, moving under its lower boundary. A confirmed breakdown below 93,750 (Murray –1/8) would accelerate the bearish trend. On the weekly timeframe, price has fallen below the 50-week MA, which previously acted as major dynamic support — increasing the probability of deeper declines. Indicators •Bollinger Bands: pointing downward → trend pressure remains bearish •MACD: expanding in the negative zone •Stochastic: exiting oversold, allowing a short-term bounce — but limited upside Overall, momentum remains strongly bearish. ⸻ Key Support & Resistance Levels Resistance •100,000 •106,250 •112,500 Support •93,750 •87,500 •81,250 ⸻ Trading Scenarios (Weekly) Base Scenario — SELL STOP Entry: 93,400 TP1: 87,500 TP2: 81,250 Stop-loss: 98,200 Bias: bearish continuation Horizon: 5–7 days ⸻ Alternative Scenario — BUY STOP Entry: 100,500 TP1: 106,250 TP2: 112,500 Stop-loss: 95,200 Bias: bullish reversal only above 100,000 ⸻ TradingView-Style Summary Bitcoin remains in a strong downtrend after losing dynamic weekly support and breaking near-critical levels. A move below 93,750 opens the way toward 87,500 → 81,250, while only a breakout above 100,000 would signal the first signs of recovery.
اتریوم زیر ۳۷۵۰ دلار در محاصره خرسها: سقوط به ۲۵۰۰ دلار یا جهش به ۵۰۰۰ دلار؟
Ethereum (ETH/USD) remains under medium-term bearish pressure, continuing to correct within its descending channel against the backdrop of a long-term uptrend. Last week, the pair tested the 3,125.00 level (Murray [2/8], 50% Fibonacci retracement) after temporarily breaking below the channel’s lower boundary but failed to consolidate there. Currently, ETH is trading near 3,750.00 (Murray [4/8]), supported by the midline of the Bollinger Bands. A confirmed breakout above this level could trigger an upward recovery toward the upper boundary of the descending channel near 4,375.00 (Murray [6/8]) and potentially 5,000.00 (Murray [8/8]). However, given prevailing sentiment, the base scenario remains bearish — the pair is more likely to resume its decline along the channel’s lower edge, with another possible breakout downward. For bears, the key level remains 3,125.00. A daily or weekly close below it would likely open the path to 2,500.00 (Murray [0/8]) and 2,187.50 (Murray [–1/8]), extending the correction. ⸻ Technical Outlook •Bollinger Bands: Pointing downward — confirming strong bearish momentum. •MACD: Stable in negative territory — trend remains under seller control. •Stochastic: Rising but already overbought — potential for reversal in the short term. •Weekly Chart: ETH continues to trade below the Bollinger midline, keeping downside risks intact. ⸻ Support and Resistance •Resistance: 3,750.00 / 4,375.00 / 5,000.00 •Support: 3,125.00 / 2,500.00 / 2,187.50 ⸻ Trading Scenarios Main Scenario — Sell Stop •Entry: 3,110.00 •Take Profit: 2,500.00 / 2,187.50 •Stop Loss: 3,540.00 •Bias: Bearish continuation below 3,125.00 •Timeframe: 5–7 days Alternative Scenario — Buy Stop •Entry: 3,770.00 •Take Profit: 4,375.00 / 5,000.00 •Stop Loss: 3,360.00 •Bias: Bullish reversal above 3,750.00 ⸻ 💬 ETH remains technically weak below 3,750.00. A breakdown under 3,125.00 would confirm further downside toward 2,500.00, while a close above 3,750.00 could trigger a short-term recovery toward 4,375.00.
تحلیل هفتگی بیت کوین: آیا ریزش ادامه دارد یا منتظر صعود هستیم؟
BTC/USD continues to move within a descending channel. •A breakout above 109,375.00 (Murray [5/8]), aligned with the midline of the Bollinger Bands, could trigger an upward move toward 115,625.00 (Murray [6/8]), 121,875.00 (Murray [7/8]), and 125,000.00 (Murray [8/8]). •Conversely, a sustained break below 100,000.00 (Murray [0/8]) would likely extend the decline toward 93,750.00 (Murray [–2/8], Fibonacci 61.8% correction). Resistance levels: 109,375.00 — 115,625.00 — 121,875.00 — 125,000.00 Support levels: 100,000.00 — 93,750.00 ⸻ Technical Outlook •Bollinger Bands: Sloping downward — consistent with continued bearish pressure. •MACD: Stable in the negative zone — momentum favors sellers. •Stochastic: Rising toward overbought territory, hinting at a possible near-term reversal. ⸻ Trading Scenarios Primary Scenario (Sell Stop) •Entry: 99,960.00 •Take Profit: 93,750.00 •Stop Loss: 104,400.00 •Bias: Bearish continuation below 100,000.00 •Timeframe: 5–7 days Alternative Scenario (Buy Stop) •Entry: 109,400.00 •Take Profit: 115,625.00 / 121,875.00 / 125,000.00 •Stop Loss: 105,300.00 •Bias: Bullish reversal above 109,375.00 ⸻ 💬 Bitcoin remains under selling pressure within its descending channel. A break below 100,000.00 could accelerate the move toward 93,750.00, while a close above 109,375.00 would mark the first sign of a potential bullish reversal.
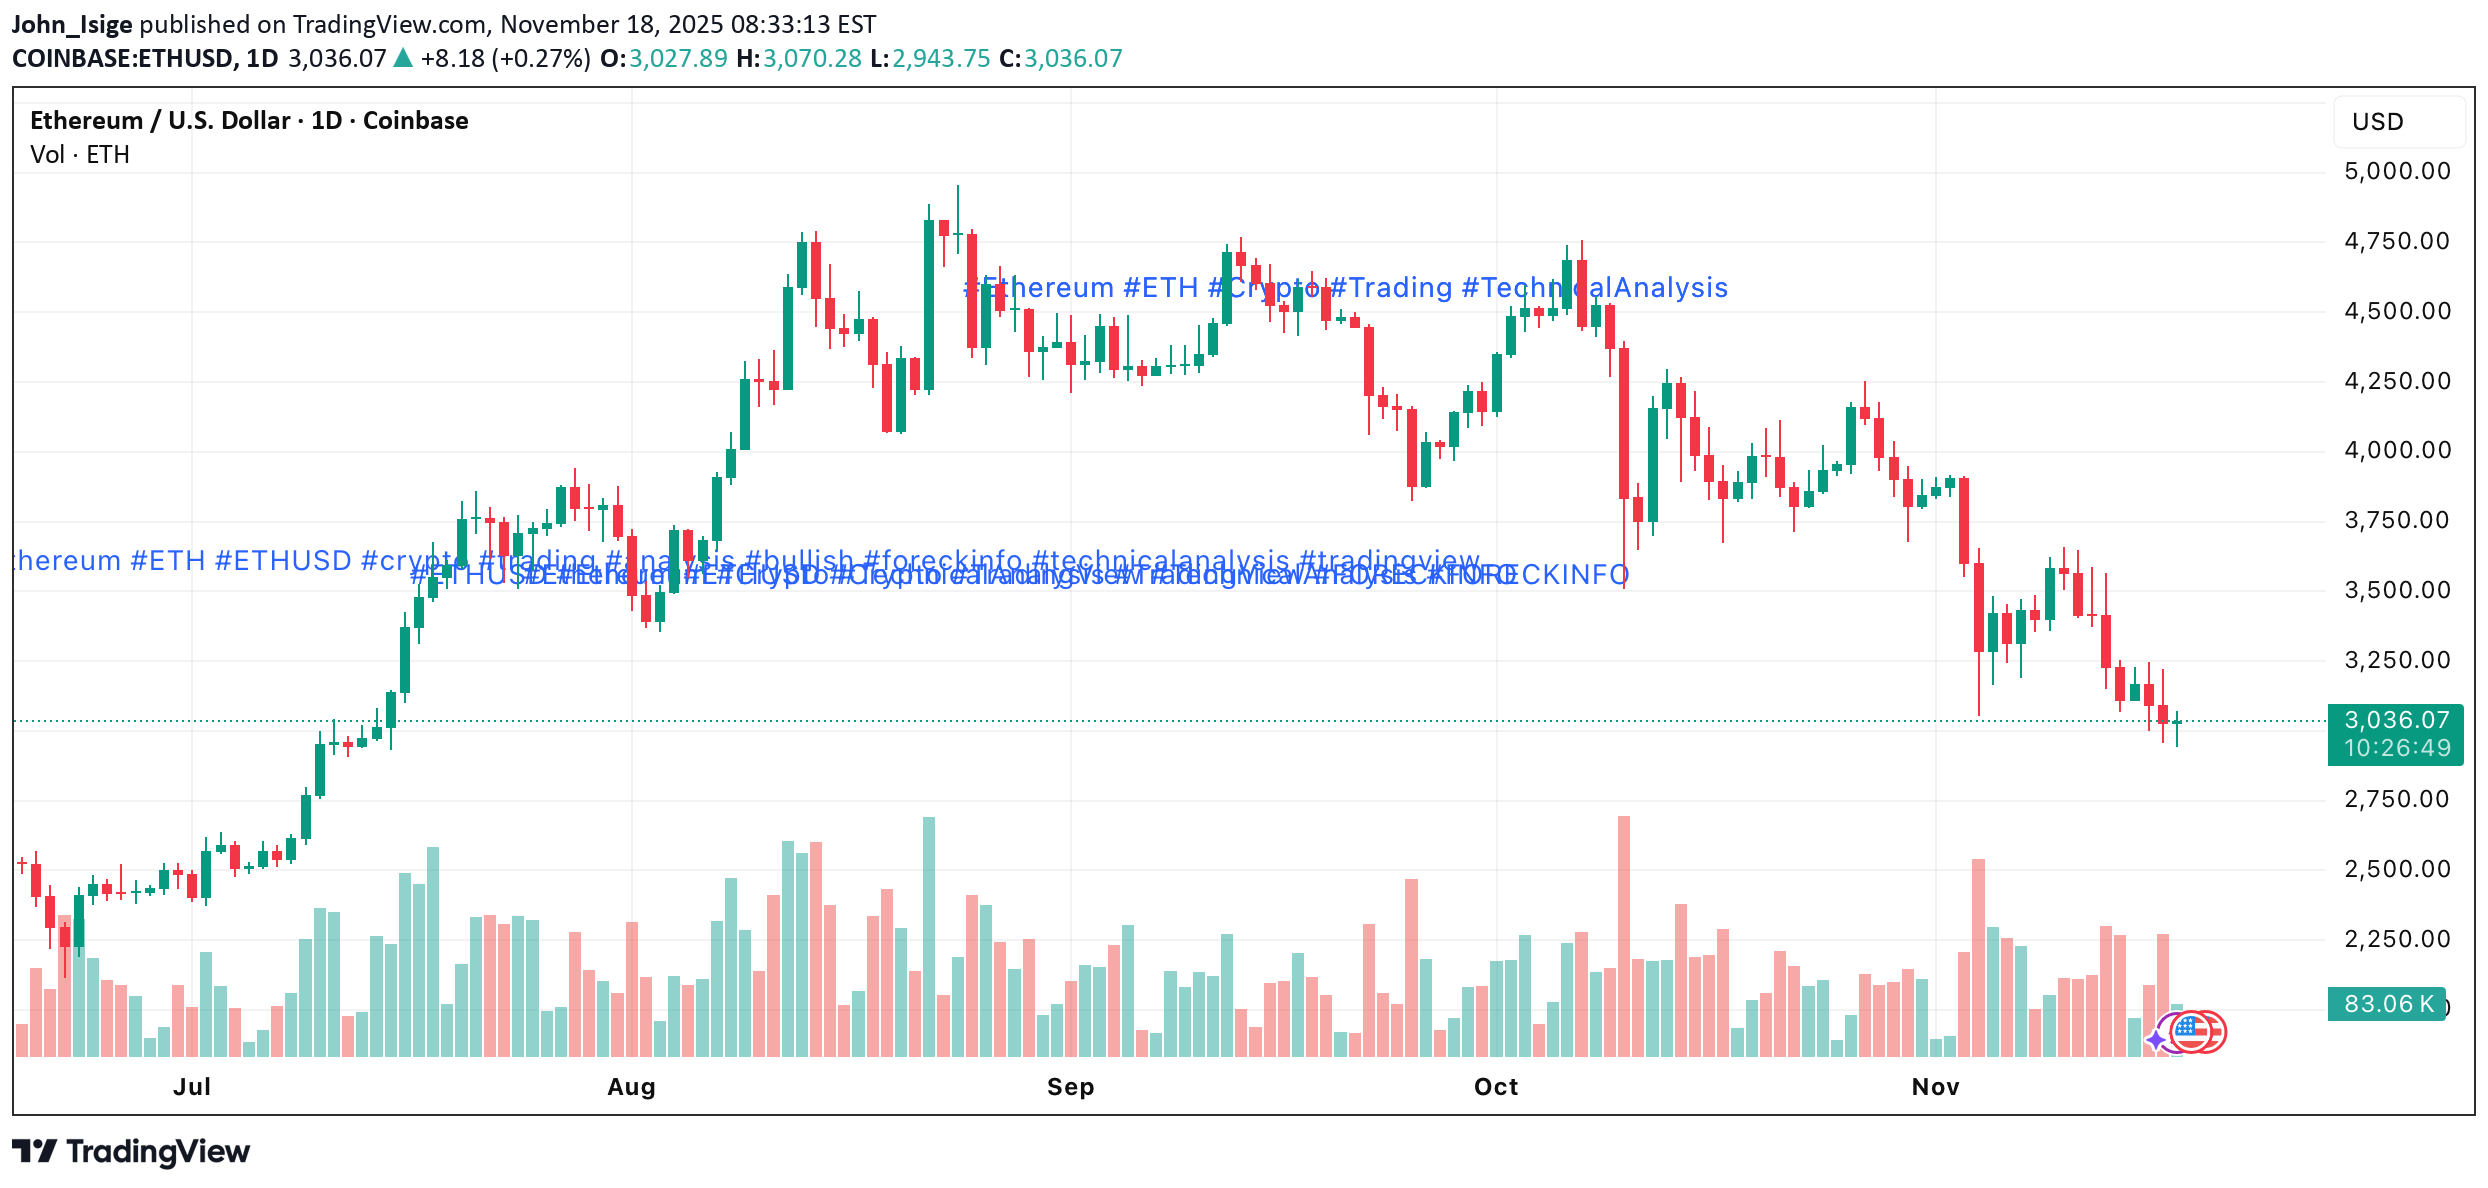
اتریوم در آستانه سقوط: آیا حمایت حیاتی 3168 دلار دوام میآورد؟
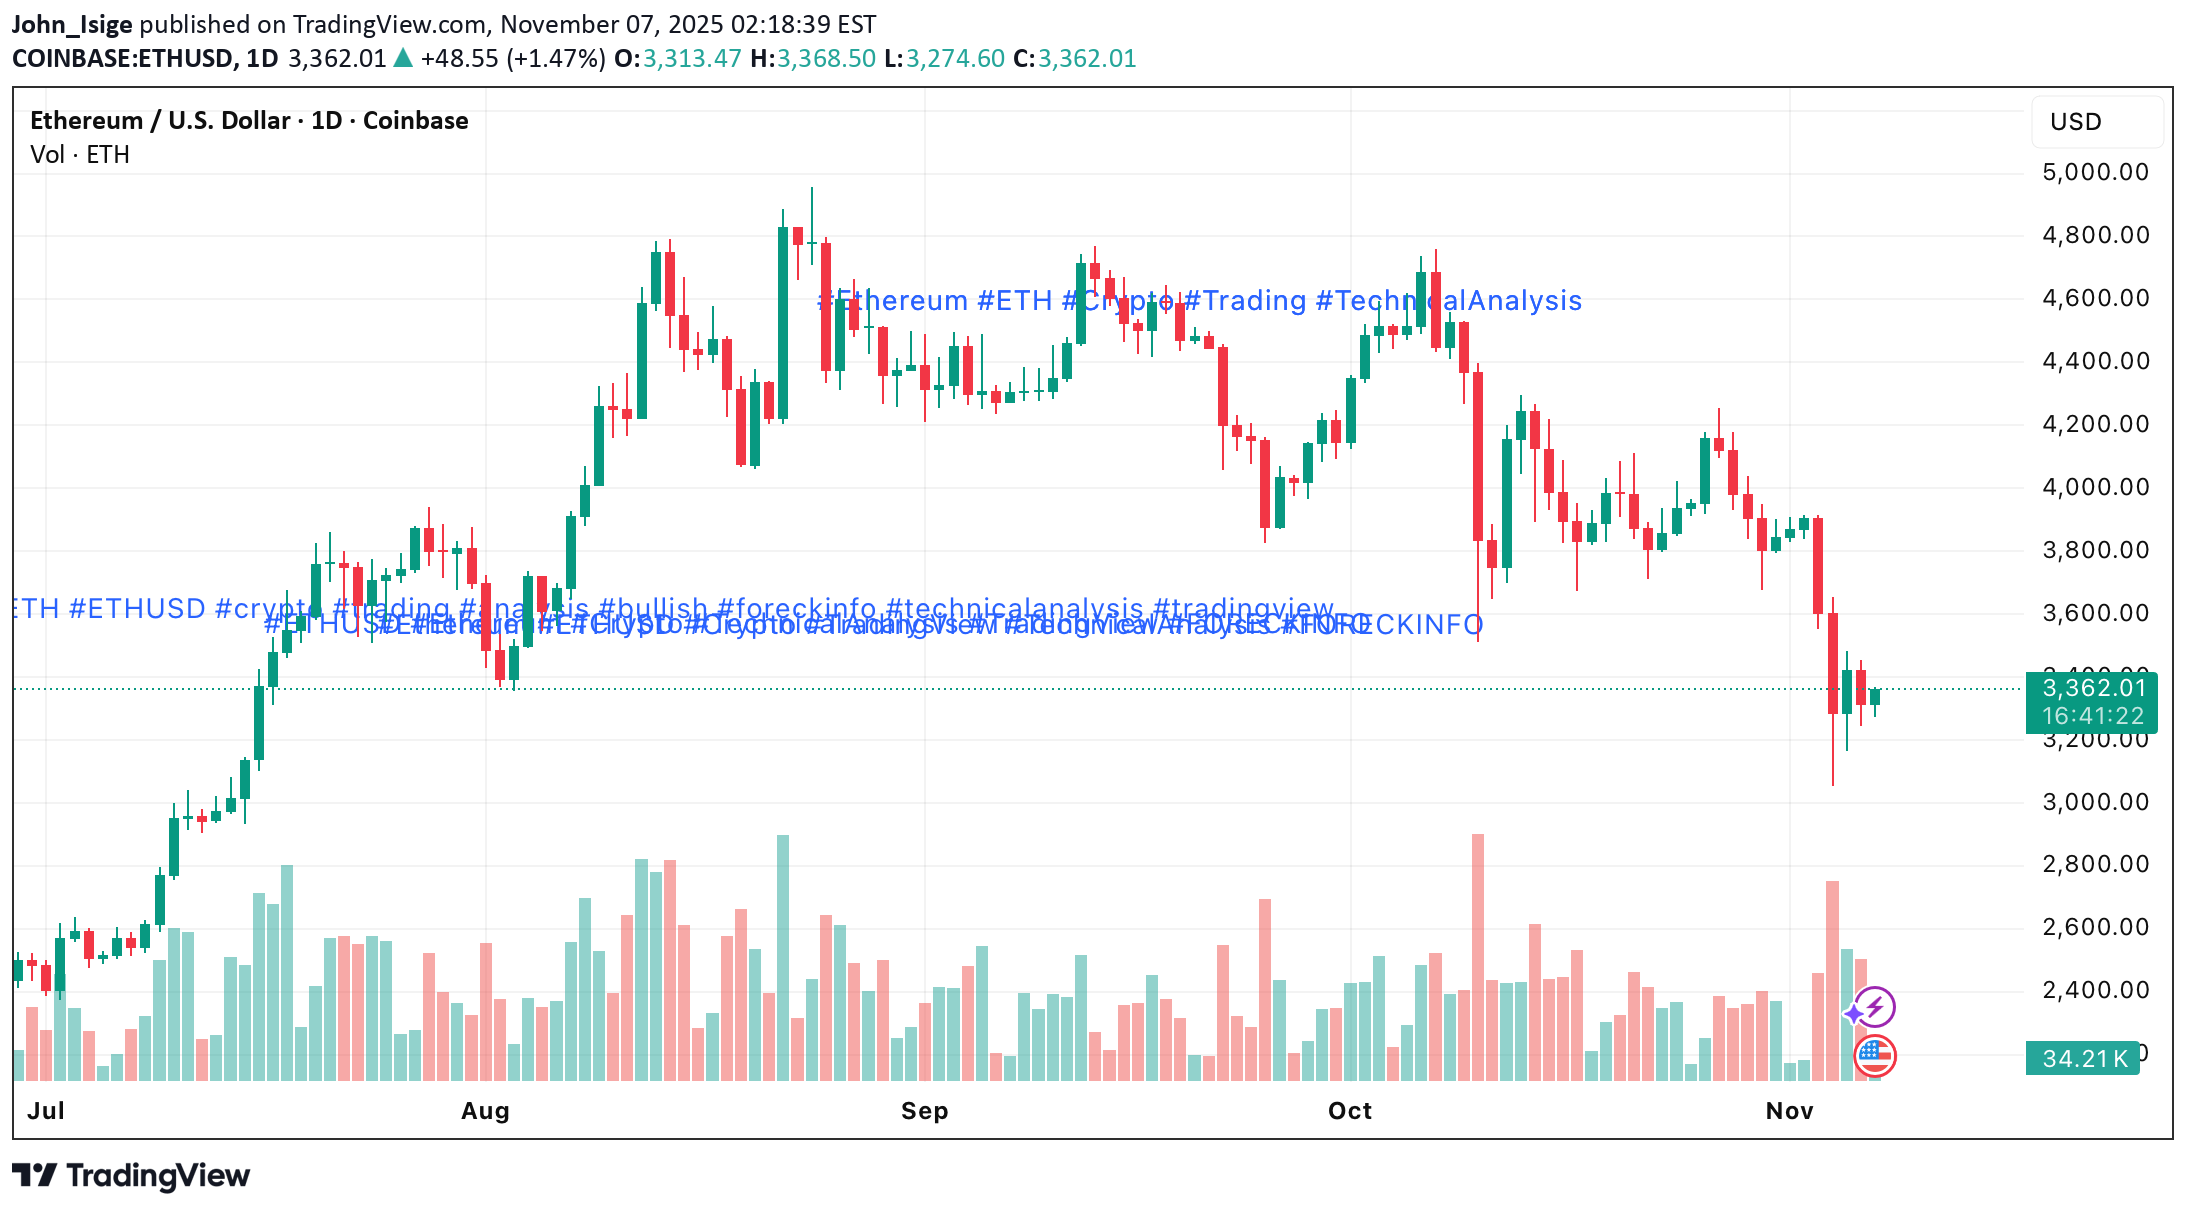
Ethereum (ETH/USD) continues to feel the ripple effects of Bitcoin’s recent sell-off, dropping to $3,061 — its lowest level since mid-July. Despite a brief rebound toward $3,382, the altcoin remains under pressure, trading below its 200-day EMA for the first time since early summer — a strongly bearish technical signal. Heavy outflows of over $835M from spot Ethereum ETFs underline a growing lack of confidence among institutional investors, even as the Ethereum Treasury Bitmine continues to accumulate holdings above 3.4 million ETH. The current chart structure remains fragile, and the much-anticipated “year-end rally” now appears increasingly at risk. For bulls to regain control, ETH must reclaim the $3,500–$3,603 zone — the confluence of the October low, the lower trend channel boundary, and the EMA200. Failure to close above this resistance would leave the pair vulnerable to renewed selling pressure toward the key support area near $3,168. ⸻ Bullish Scenario — Levels to Watch •$3,500–$3,603 → Critical resistance zone and EMA200 test. •$3,711 → 38% Fibonacci retracement and prior October support. •$3,910–$3,991 → Blue resistance zone with the 50% Fib retracement and 50-day EMA. •$4,098 → Supertrend level; breakout here would mark a mid-term reversal. •$4,248–$4,483 → Extended Golden Pocket and profit-taking zone. •$4,606–$4,750 → Ultimate bullish targets, requiring a daily close above moving averages. If ETH successfully defends $3,287 and breaks through $3,603, a move toward $3,711 would confirm renewed bullish momentum. A sustained rally above $3,910 could open the path toward $4,098 and $4,248, but bulls will likely face profit-taking near these upper resistance zones unless strong ETF inflows return to the market. ⸻ Bearish Scenario — Risk Zones •$3,399–$3,365 → Initial short-term support. •$3,168–$3,061 → Key defensive zone for bulls; a breakdown here signals deeper losses. •$2,905–$2,862 → Yellow zone, origin of July’s rally — potential short-term demand area. •$2,663 → Mid-level structural support. •$2,565–$2,458 → Dark green zone, 61% Fibonacci retracement — ultimate bearish target. The breakdown from the descending channel earlier this week confirms that bears remain in control. A clear move below $3,168 would likely extend the correction toward $2,905 and potentially $2,565, marking the Golden Pocket of the current retracement. ⸻ Technical Indicators •RSI (Daily): Deep in bearish territory — momentum remains weak. •RSI (Weekly): Near the neutral boundary; a further decline could trigger a new sell signal. •MACD: Still negative, showing no clear signs of bullish divergence. •Moving Averages: The 20-day EMA (red) and 200-day EMA (blue) are trending downward, confirming medium-term weakness. ⸻ 💬 Ethereum remains trapped in a bearish structure below its key moving averages. Unless bulls can reclaim the $3,500–$3,600 resistance area, further declines toward $3,061 or even the $2,800 zone remain likely. A daily close above $3,603 would be the first sign that buyers are regaining control.
تحلیل هفتگی اتریوم: آیا سقوط به زیر ۳۵۴۰ دلار قطعی است؟
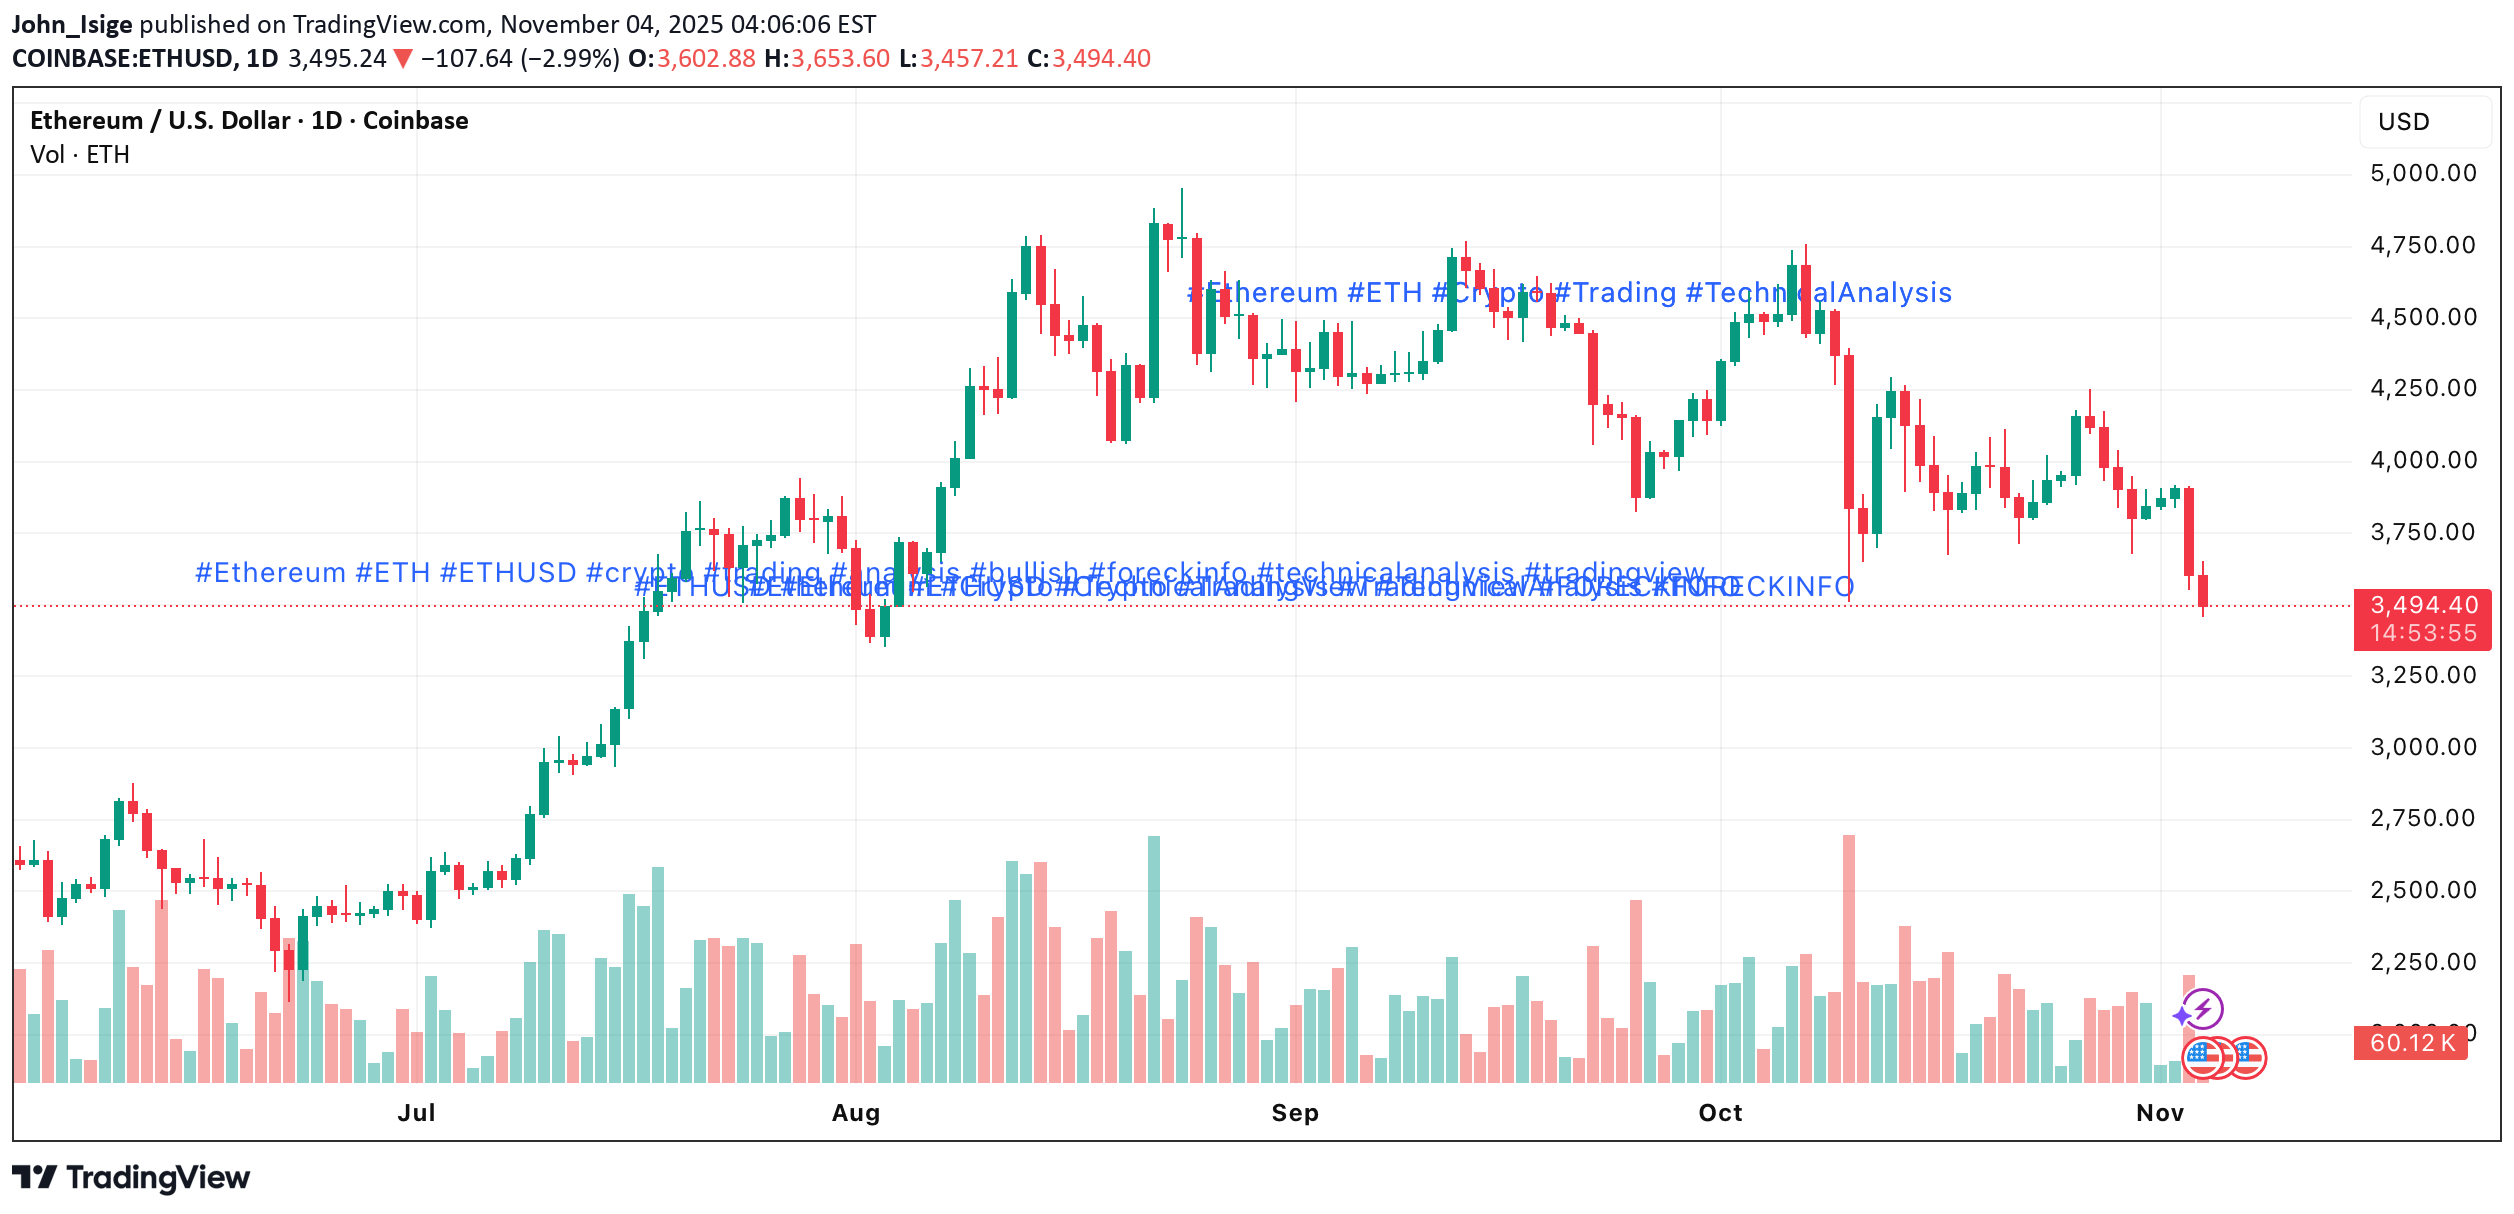
ETH/USD continues to trade within a medium-term downtrend, retracing against its broader long-term bullish structure. Last week, the pair tested the lower boundary of the descending channel near 3,540.00 (Fibonacci 38.2% correction). A confirmed break below this area could trigger an extension toward 3,125.00 (Murray level [2/8], Fibonacci 50.0%) and 2,500.00 (Murray level [0/8]). However, if bulls manage to lift the price above 4,062.50 (Murray level [5/8], Fibonacci 23.6%) and reclaim the middle Bollinger Band, ETH/USD could exit its bearish channel, opening the way to 4,687.50 (Murray [7/8]) and 5,000.00 (Murray [8/8]). ⸻ Technical Setup •Bollinger Bands are turning downward — confirming sustained bearish pressure. •MACD histogram expands in the negative zone — momentum remains on the downside. •Stochastic Oscillator is approaching oversold territory — a short-term correction cannot be ruled out. Resistance levels: 4,062.50 — 4,687.50 — 5,000.00 Support levels: 3,540.00 — 3,125.00 — 2,500.00 ⸻ Trading Plan Primary Scenario (Sell Stop) •Entry: 3,470.00 •Take Profit: 3,125.00 / 2,500.00 •Stop Loss: 3,740.00 •Bias: Bearish continuation below 3,750.00 •Timeframe: Weekly Alternative Scenario (Buy Stop) •Entry: 4,065.00 •Take Profit: 4,687.50 / 5,000.00 •Stop Loss: 3,660.00 •Bias: Bullish reversal above 4,062.50 ⸻ 💬 ETH remains under pressure within its descending channel. A drop below 3,540.00 could accelerate the decline toward 3,125.00, while a breakout above 4,062.50 would signal a potential bullish reversal toward 4,687.50 and 5,000.00.
اتریوم در آستانه سقوط یا خیزش؟ کلید حمایت و مقاومتهای حیاتی ETH را ببینید
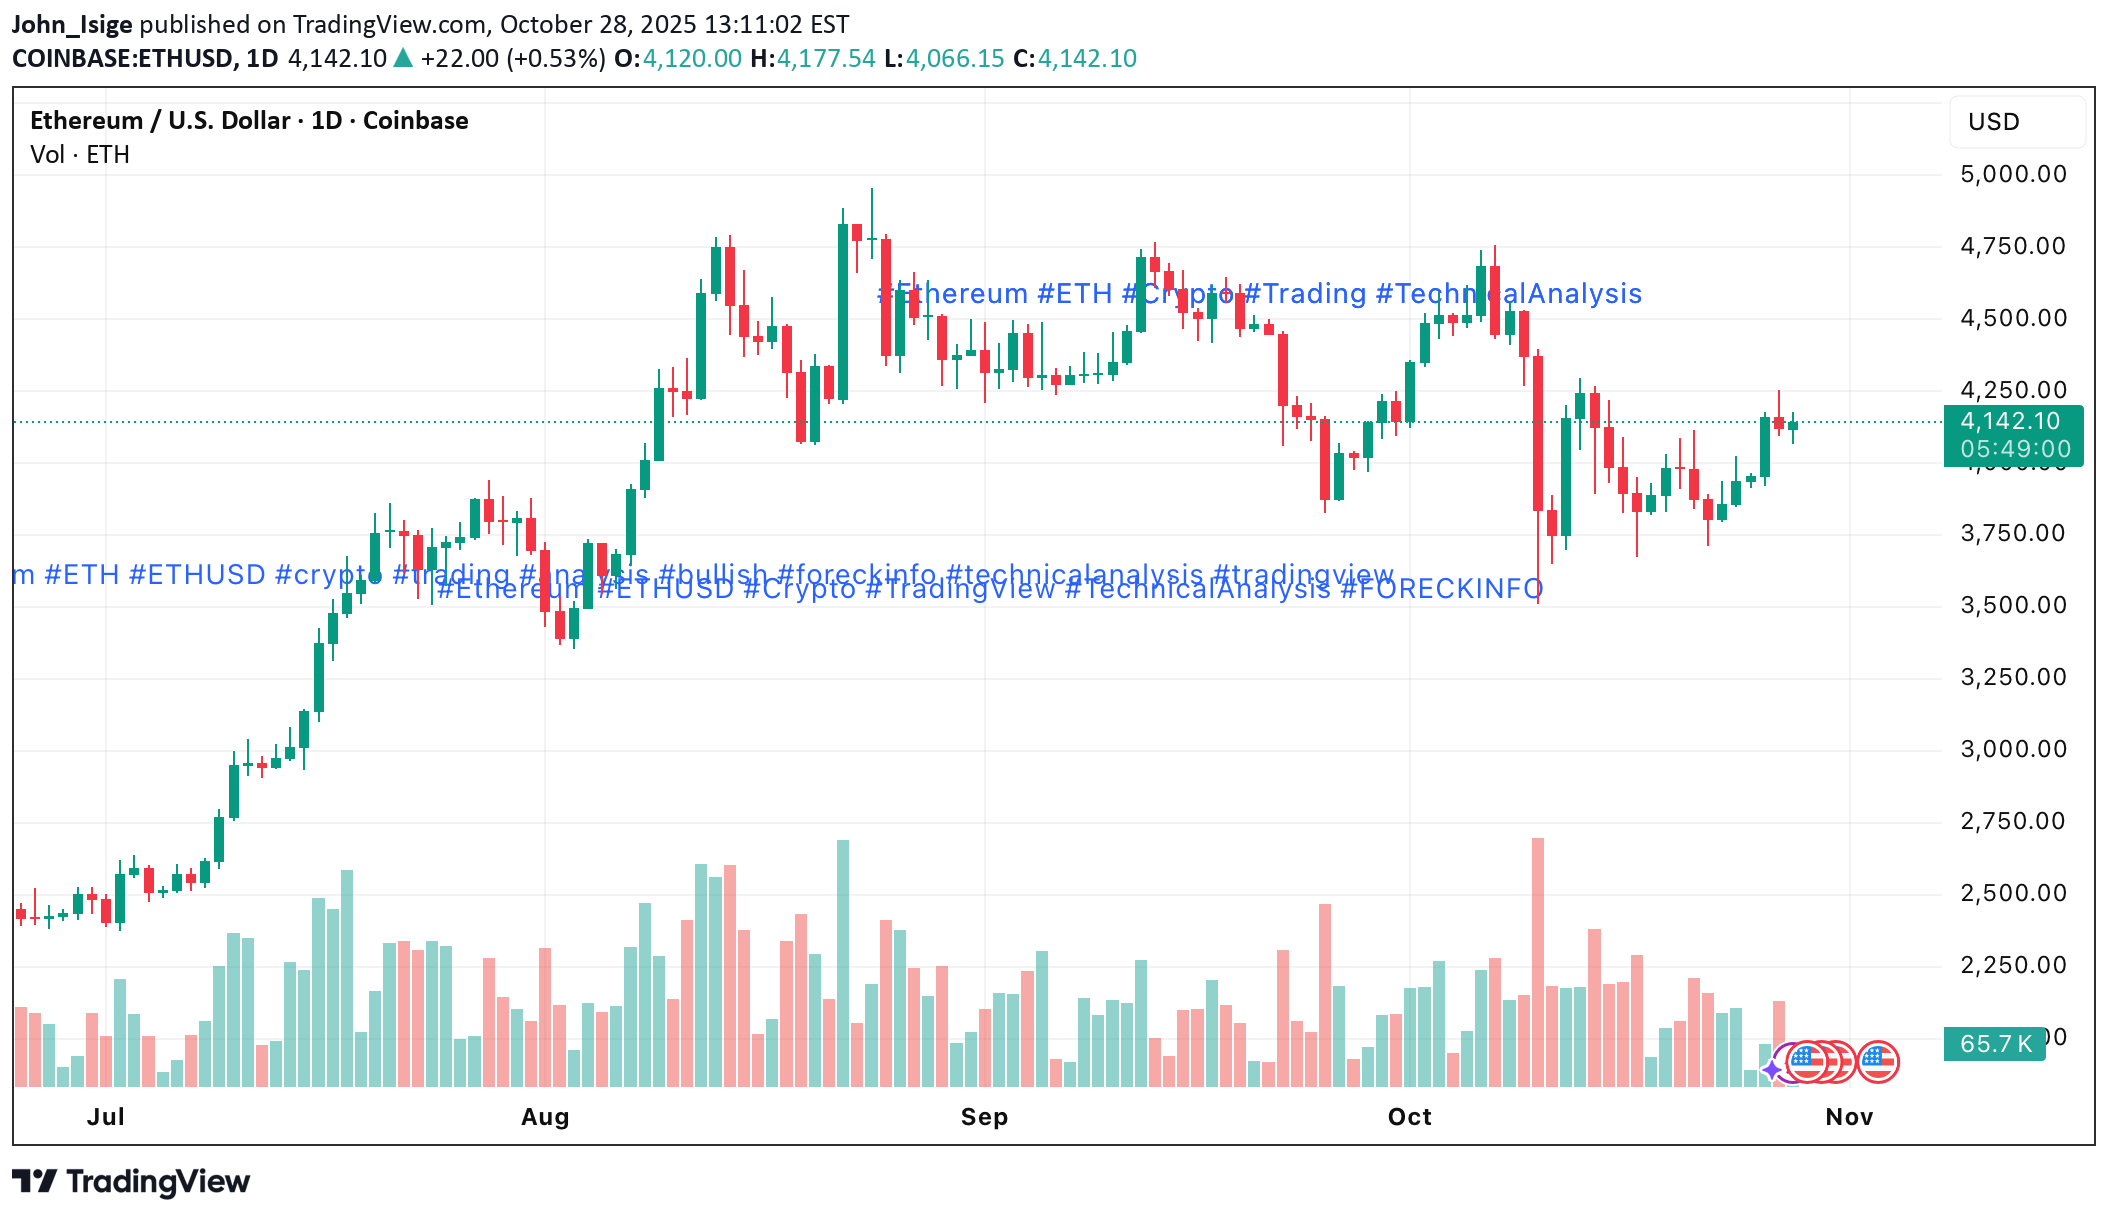
Ethereum (ETH/USD) remains within a medium-term downtrend, consolidating after testing the 3,750 zone (Murray level [4/8]) near the lower boundary of the descending channel last week. Despite multiple attempts, bears failed to push the price lower, leading to a rebound and short-term stabilization. Currently, ETH is trading above 3,962.50 (Murray level [5/8], 23.6% Fibonacci retracement), supported by the middle Bollinger Band. However, confirmation of a trend reversal would only come if the price secures a breakout above 4,375.00 (Murray level [6/8]) — a move that would also break the upper boundary of the descending channel and open the path toward 5,000.00 (Murray level [8/8]) and 5,625.00 (Murray level [+2/8]). On the downside, the key bearish level remains 3,750.00; a break below it could accelerate the decline toward 3,125.00 (Murray level [2/8], 50.0% Fibonacci retracement) and 2,500.00 (Murray level [0/8]). ⸻ Technical Setup •Bollinger Bands are turning downward, reflecting a continuation of bearish pressure. •MACD remains in negative territory, though its histogram is flattening — suggesting short-term consolidation. •Stochastic has entered the overbought zone and is starting to turn down, hinting at a potential pullback. Resistance levels: 4,375 — 5,000 — 5,625 Support levels: 3,750 — 3,125 — 2,500 ⸻ Trading Plan Primary Scenario (Sell Stop) •Entry: 3,749.95 •Take Profit: 3,125 / 2,500 •Stop Loss: 4,075 •Bias: Bearish below 3,750 •Timeframe: Weekly Alternative Scenario (Buy Stop) •Entry: 4,375.05 •Take Profit: 5,000 / 5,625 •Stop Loss: 3,960 •Bias: Bullish above 4,375 ⸻ 💬 ETH/USD continues to trade under medium-term pressure. A breakout above 4,375 would shift sentiment bullish, while a move below 3,750 opens the door to deeper correction targets near 3,125 and 2,500.
بیت کوین در آستانه تصمیم فدرال رزرو: آیا مقاومت کلیدی شکسته میشود؟
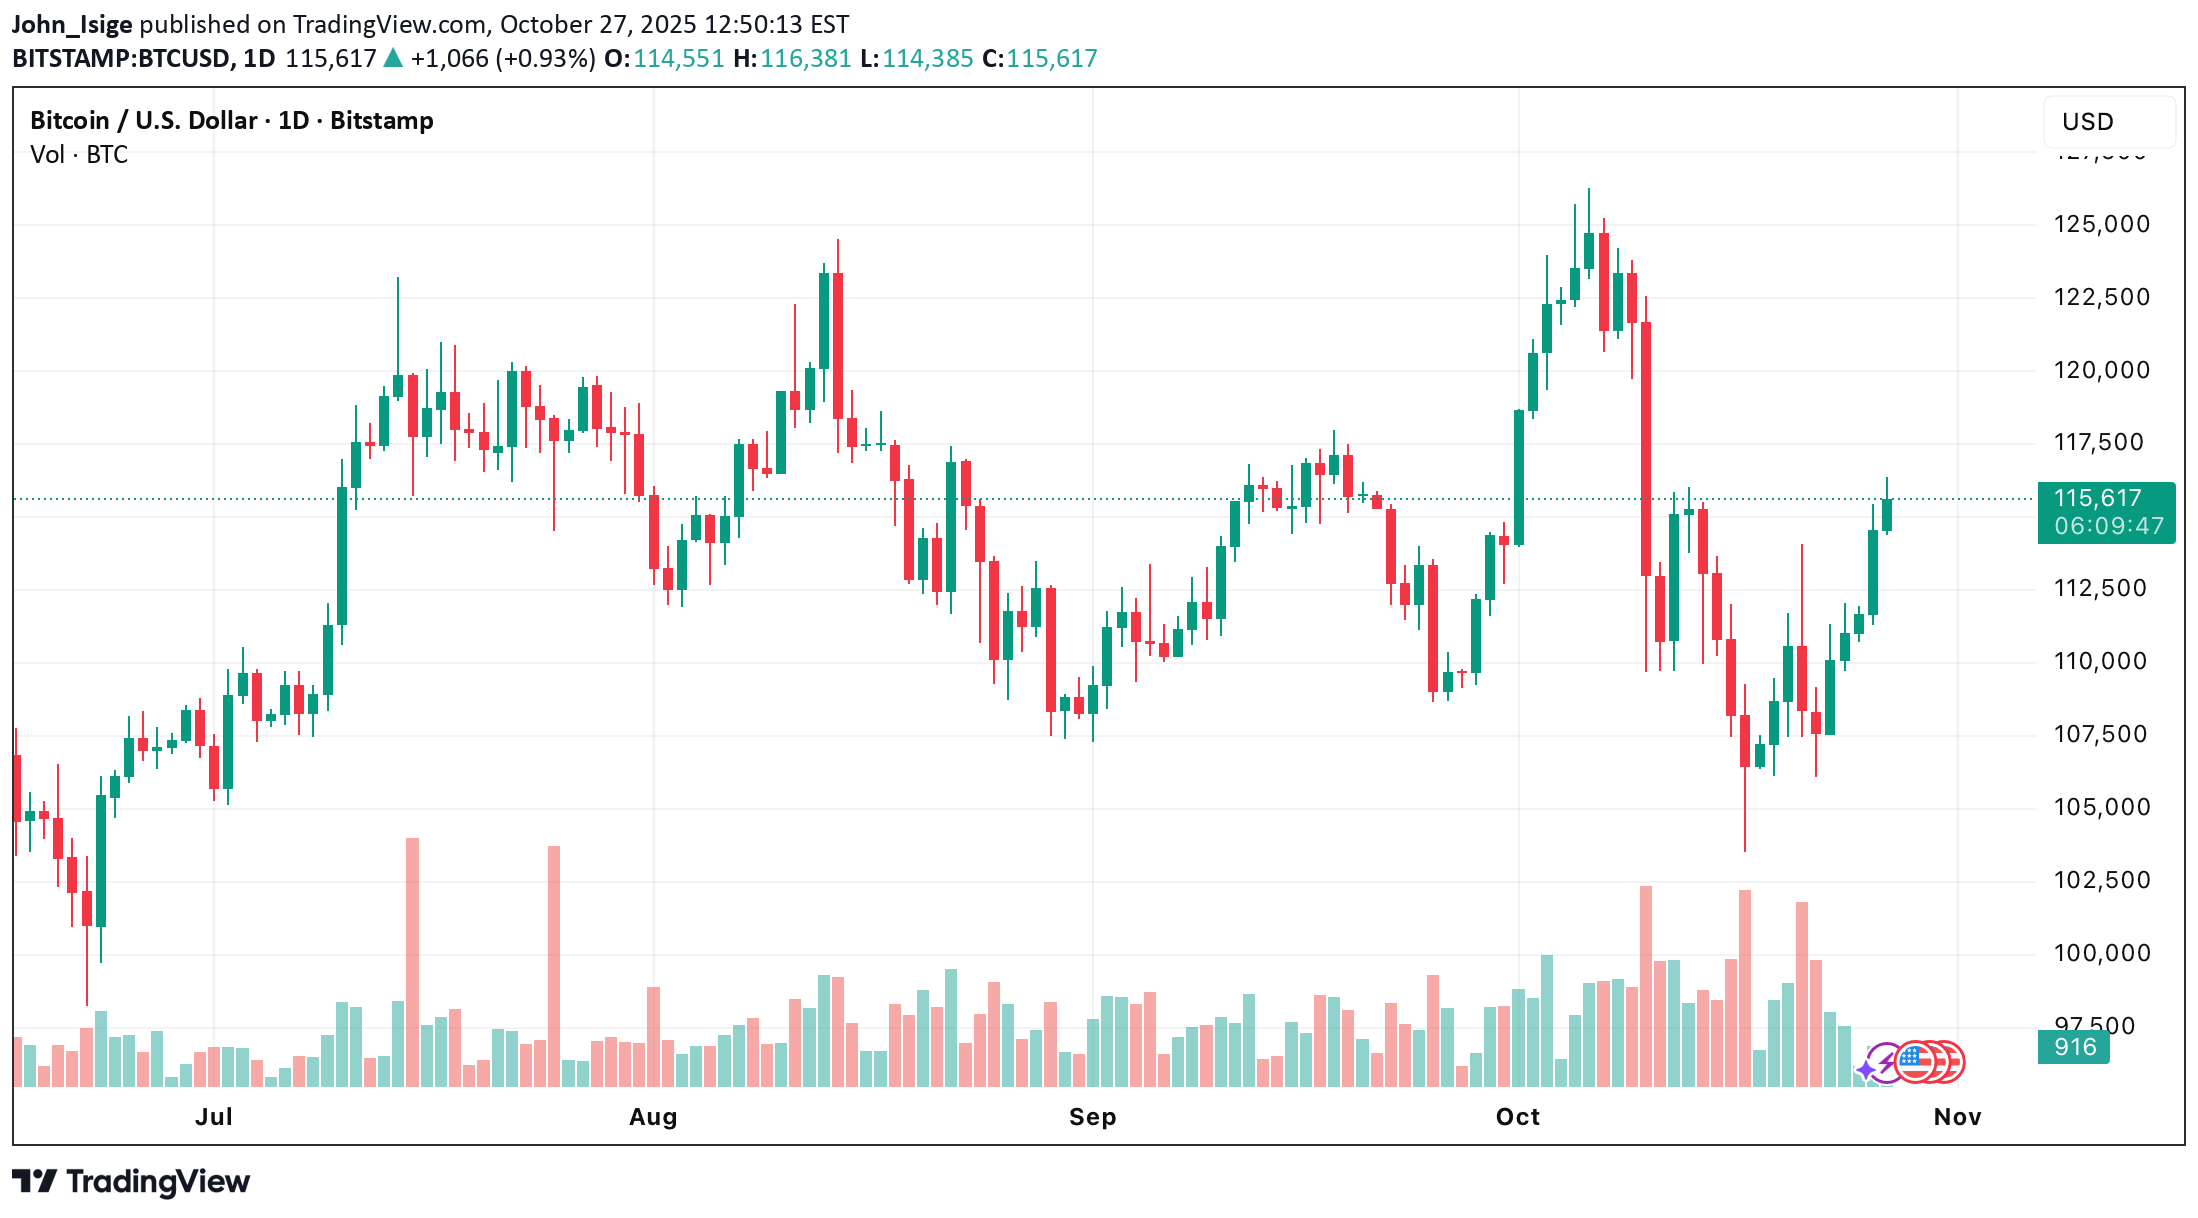
Bitcoin (BTC/USD) resumed its upward movement last week, testing the 115,625 area (Murray level [5/8]) as investors rotated back into risk assets. The renewed momentum followed growing expectations that the Federal Reserve will cut interest rates by 25 basis points at its Wednesday meeting and possibly ease further in December. Market sentiment was also boosted by signals of progress in U.S.–China trade relations ahead of the APEC summit in Seoul on October 31, where U.S. President Donald Trump and Chinese President Xi Jinping are expected to meet. Chinese official Li Chengang noted that a preliminary consensus had been reached on key issues such as export controls, fentanyl, and transport tariffs, while U.S. Treasury Secretary Scott Bessent told CBS that the proposed 100% tariffs on Chinese imports are “off the table.” Trump himself stated that both sides are “close to a trade deal.” These developments reduced fears of further escalation and lowered the risk of a global economic slowdown. As a result, the U.S. dollar weakened, while risk appetite improved across equities and crypto markets. The Crypto Fear & Greed Index climbed back into neutral territory for the first time in weeks, reaching 51. ⸻ Technical Setup BTC/USD broke above the middle Bollinger Band and is now testing the 115,625 resistance zone (Murray level [5/8]). •A confirmed breakout above this level would likely extend the rally toward 121,875 (Murray level [7/8]) and 125,000 (Murray level [8/8]). •For bears, the critical zone lies at 112,500 (Murray level [4/8]), reinforced by the midline of the Bollinger Bands. A breakdown below this area could trigger a pullback toward 106,250 (Murray level [2/8]) and 100,000 (Murray level [0/8]). Indicators: •Bollinger Bands: starting to flatten after a downward expansion. •MACD: approaching a bullish crossover, hinting at renewed momentum. •Stochastic: rising but nearing the overbought zone, suggesting potential short-term exhaustion. Resistance levels: 115,625 — 121,875 — 125,000 Support levels: 112,500 — 106,250 — 100,000 ⸻ Trading Plan Primary Scenario (Buy Stop) •Entry: 115,625.05 •Take Profit: 121,875 / 125,000 •Stop Loss: 113,200 •Bias: Bullish above 115,625 •Timeframe: Weekly Alternative Scenario (Sell Stop) •Entry: 112,499.95 •Take Profit: 106,250 / 100,000 •Stop Loss: 115,000 •Bias: Bearish below 112,500 💬 Bitcoin remains in focus ahead of the Fed’s rate decision and the U.S.–China summit. A break above 115,625 could signal a renewed leg higher, while failure to hold 112,500 risks deeper correction.
کاردانو (ADA) در آستانه انفجار؟ نشانههای صعودی قدرتمند در نمودار ظاهر شدند!
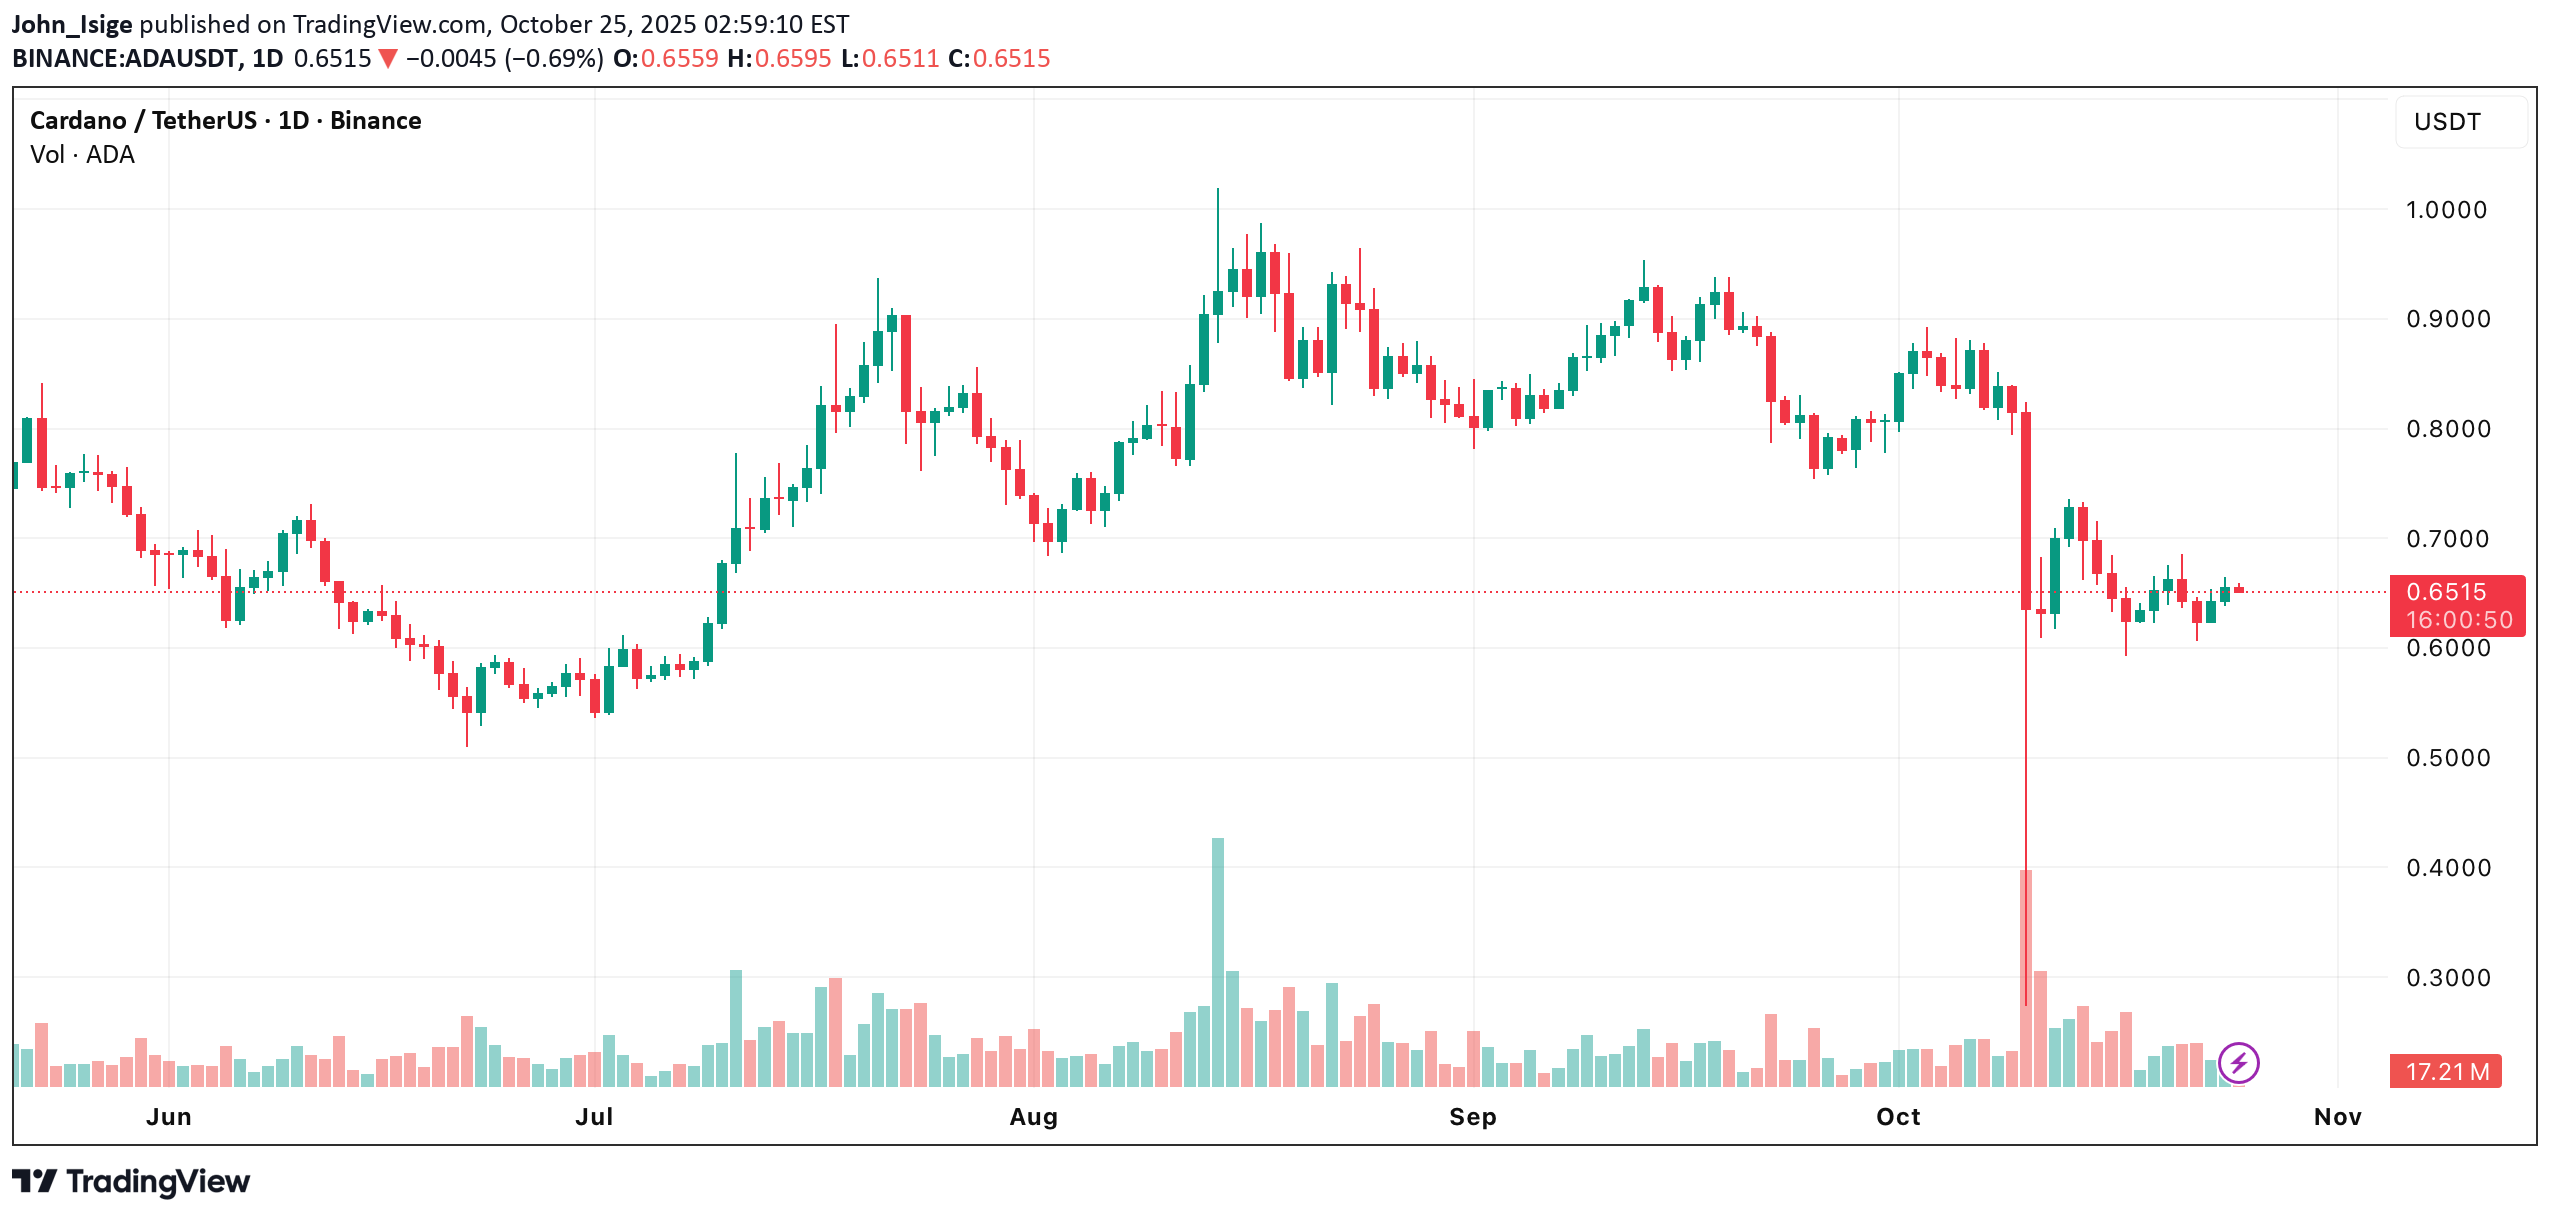
Cardano (ADA) shows signs of stabilization, forming a clean W-pattern on the daily chart — a potential signal of renewed bullish momentum. After weeks of consolidation, ADA is now approaching a key decision area near the 50-day EMA, with the broader structure hinting at a possible breakout if Bitcoin continues to trade steadily. Technical Setup The chart structure remains constructive: •The MACD histogram shows fading bearish momentum, and a bullish crossover is forming — a classic setup for trend reversal. •The RSI has broken above 50, confirming an early shift toward buying pressure. •Price is moving toward upper liquidity zones, as visible on the heatmap, suggesting that traders anticipate short liquidations in higher ranges. Meanwhile, a liquidity pocket has formed below current levels, providing a potential demand zone in case of a short-term dip. This setup supports the view of an accumulation phase before continuation. ⸻ 4H Chart — Testing the 50 EMA On the 4-hour timeframe, ADA trades directly at the 50 EMA, which now acts as the first technical barrier for buyers. A decisive break and retest above this level would validate the bullish thesis and open the way toward the 200 EMA, aligning with the top of the W-pattern. If the breakout fails, the ascending triangle currently in play could break to the downside, leading to short-term selling pressure before new support forms. Liquidation data also show a neutral delta, signaling balance between longs and shorts — a common prelude to a volatility spike once one side gains control. ⸻ Outlook As long as ADA stays above local support, the technical structure remains bullish within a consolidative base. A breakout above $0.46–$0.48 (50 EMA zone) would likely trigger momentum toward $0.52 (200 EMA), while failure to hold this level could push price back toward $0.42–$0.40 support. ⸻ 💡 Bias: Bullish above 0.46, neutral below 0.44. Key Levels: •Resistance: 0.48, 0.52, 0.55 •Support: 0.44, 0.42, 0.40
Disclaimer
Any content and materials included in Sahmeto's website and official communication channels are a compilation of personal opinions and analyses and are not binding. They do not constitute any recommendation for buying, selling, entering or exiting the stock market and cryptocurrency market. Also, all news and analyses included in the website and channels are merely republished information from official and unofficial domestic and foreign sources, and it is obvious that users of the said content are responsible for following up and ensuring the authenticity and accuracy of the materials. Therefore, while disclaiming responsibility, it is declared that the responsibility for any decision-making, action, and potential profit and loss in the capital market and cryptocurrency market lies with the trader.