Technical analysis by John_Isige about Symbol ETH on 11/7/2025

اتریوم در آستانه سقوط: آیا حمایت حیاتی 3168 دلار دوام میآورد؟
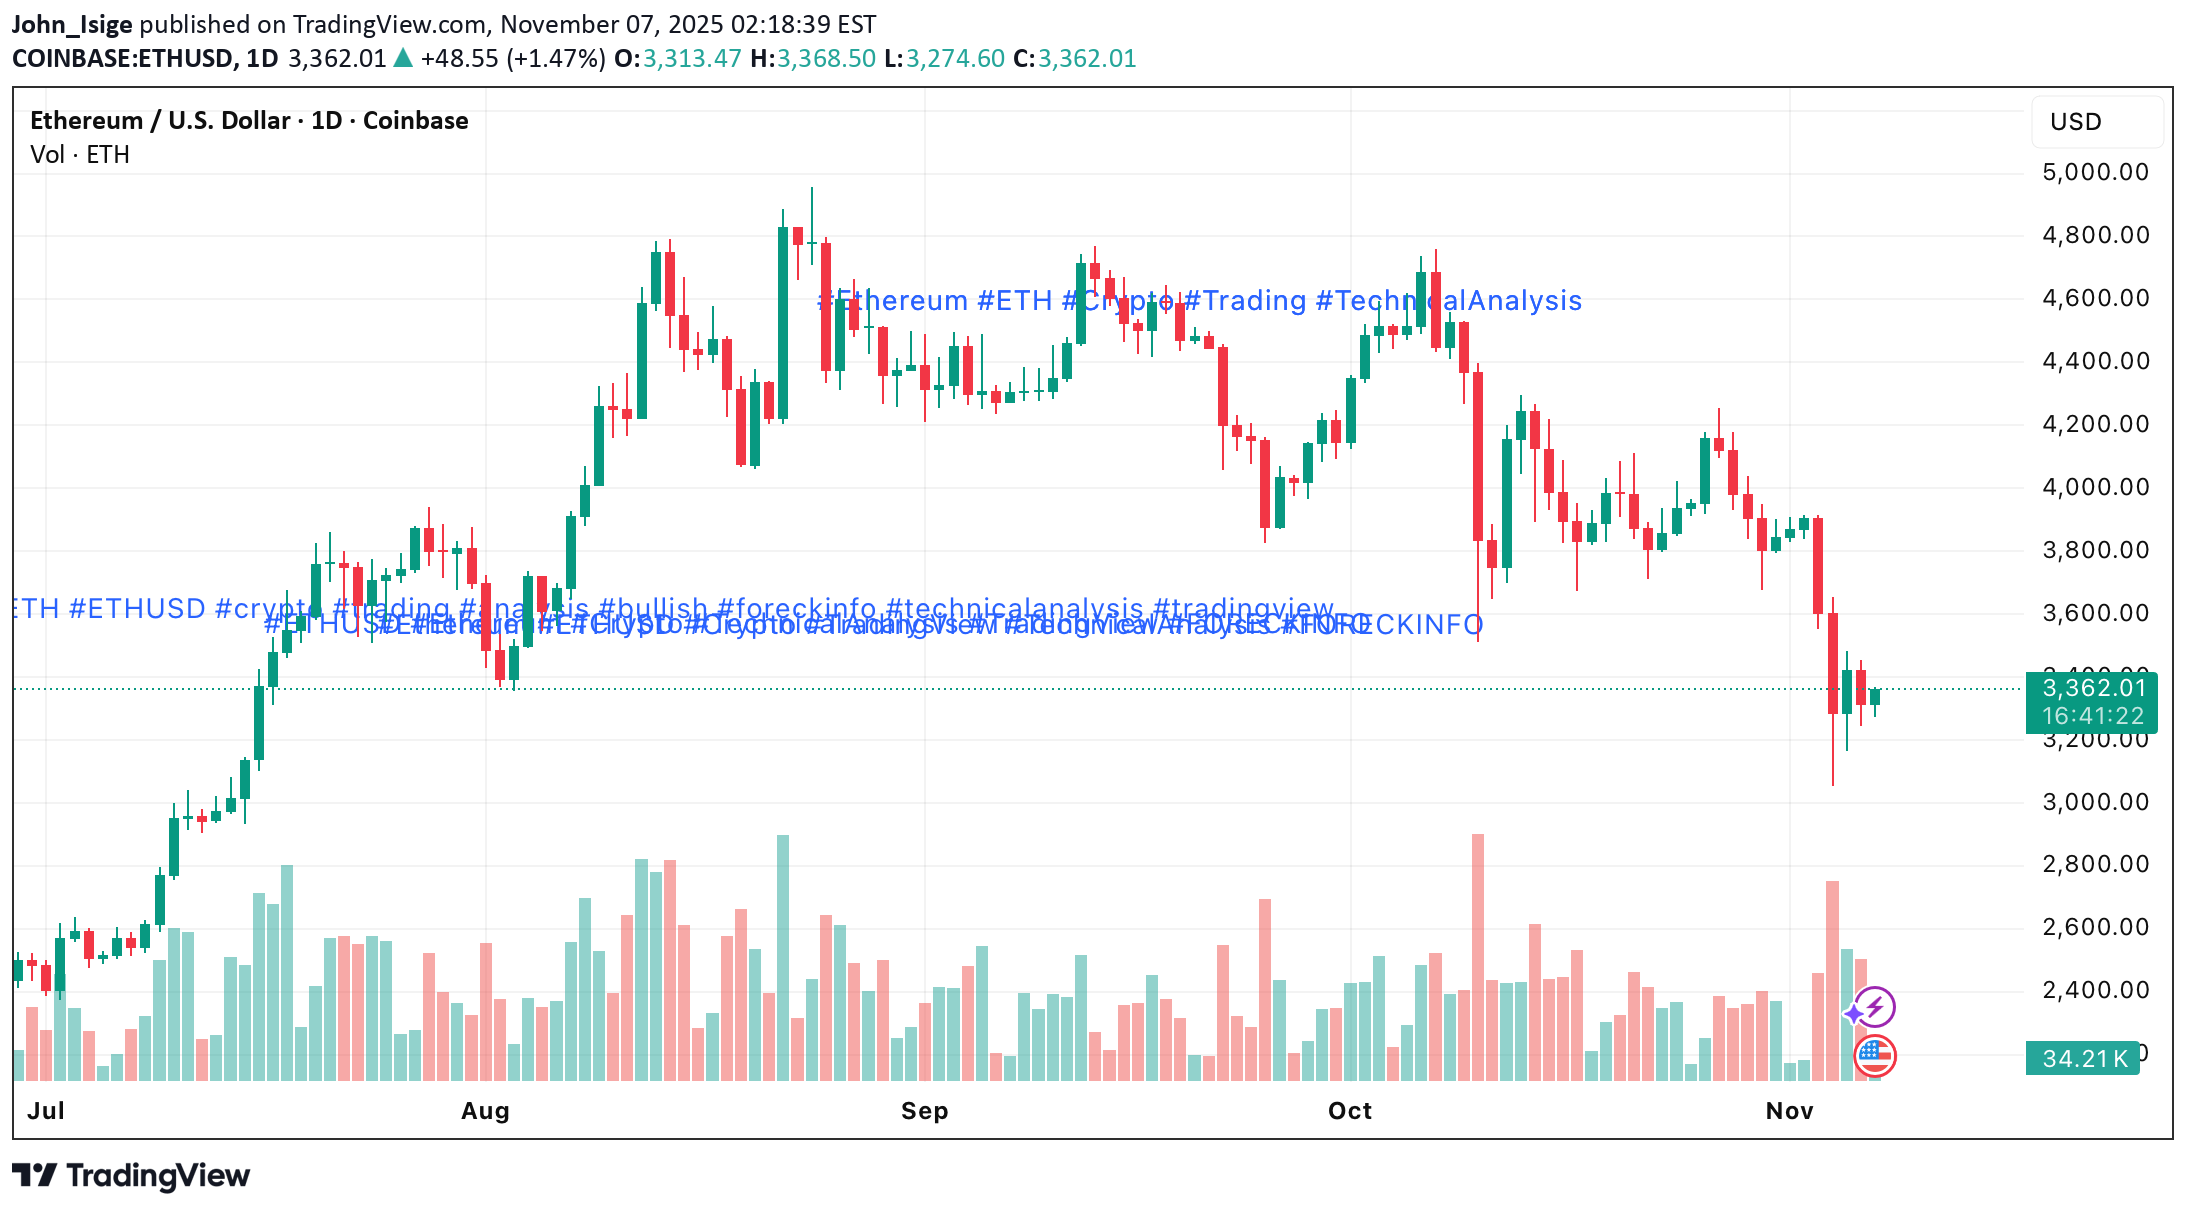
Ethereum (ETH/USD) continues to feel the ripple effects of Bitcoin’s recent sell-off, dropping to $3,061 — its lowest level since mid-July. Despite a brief rebound toward $3,382, the altcoin remains under pressure, trading below its 200-day EMA for the first time since early summer — a strongly bearish technical signal. Heavy outflows of over $835M from spot Ethereum ETFs underline a growing lack of confidence among institutional investors, even as the Ethereum Treasury Bitmine continues to accumulate holdings above 3.4 million ETH. The current chart structure remains fragile, and the much-anticipated “year-end rally” now appears increasingly at risk. For bulls to regain control, ETH must reclaim the $3,500–$3,603 zone — the confluence of the October low, the lower trend channel boundary, and the EMA200. Failure to close above this resistance would leave the pair vulnerable to renewed selling pressure toward the key support area near $3,168. ⸻ Bullish Scenario — Levels to Watch •$3,500–$3,603 → Critical resistance zone and EMA200 test. •$3,711 → 38% Fibonacci retracement and prior October support. •$3,910–$3,991 → Blue resistance zone with the 50% Fib retracement and 50-day EMA. •$4,098 → Supertrend level; breakout here would mark a mid-term reversal. •$4,248–$4,483 → Extended Golden Pocket and profit-taking zone. •$4,606–$4,750 → Ultimate bullish targets, requiring a daily close above moving averages. If ETH successfully defends $3,287 and breaks through $3,603, a move toward $3,711 would confirm renewed bullish momentum. A sustained rally above $3,910 could open the path toward $4,098 and $4,248, but bulls will likely face profit-taking near these upper resistance zones unless strong ETF inflows return to the market. ⸻ Bearish Scenario — Risk Zones •$3,399–$3,365 → Initial short-term support. •$3,168–$3,061 → Key defensive zone for bulls; a breakdown here signals deeper losses. •$2,905–$2,862 → Yellow zone, origin of July’s rally — potential short-term demand area. •$2,663 → Mid-level structural support. •$2,565–$2,458 → Dark green zone, 61% Fibonacci retracement — ultimate bearish target. The breakdown from the descending channel earlier this week confirms that bears remain in control. A clear move below $3,168 would likely extend the correction toward $2,905 and potentially $2,565, marking the Golden Pocket of the current retracement. ⸻ Technical Indicators •RSI (Daily): Deep in bearish territory — momentum remains weak. •RSI (Weekly): Near the neutral boundary; a further decline could trigger a new sell signal. •MACD: Still negative, showing no clear signs of bullish divergence. •Moving Averages: The 20-day EMA (red) and 200-day EMA (blue) are trending downward, confirming medium-term weakness. ⸻ 💬 Ethereum remains trapped in a bearish structure below its key moving averages. Unless bulls can reclaim the $3,500–$3,600 resistance area, further declines toward $3,061 or even the $2,800 zone remain likely. A daily close above $3,603 would be the first sign that buyers are regaining control.