Technical analysis by John_Isige about Symbol ETH: Buy recommendation (10/28/2025)

اتریوم در آستانه سقوط یا خیزش؟ کلید حمایت و مقاومتهای حیاتی ETH را ببینید
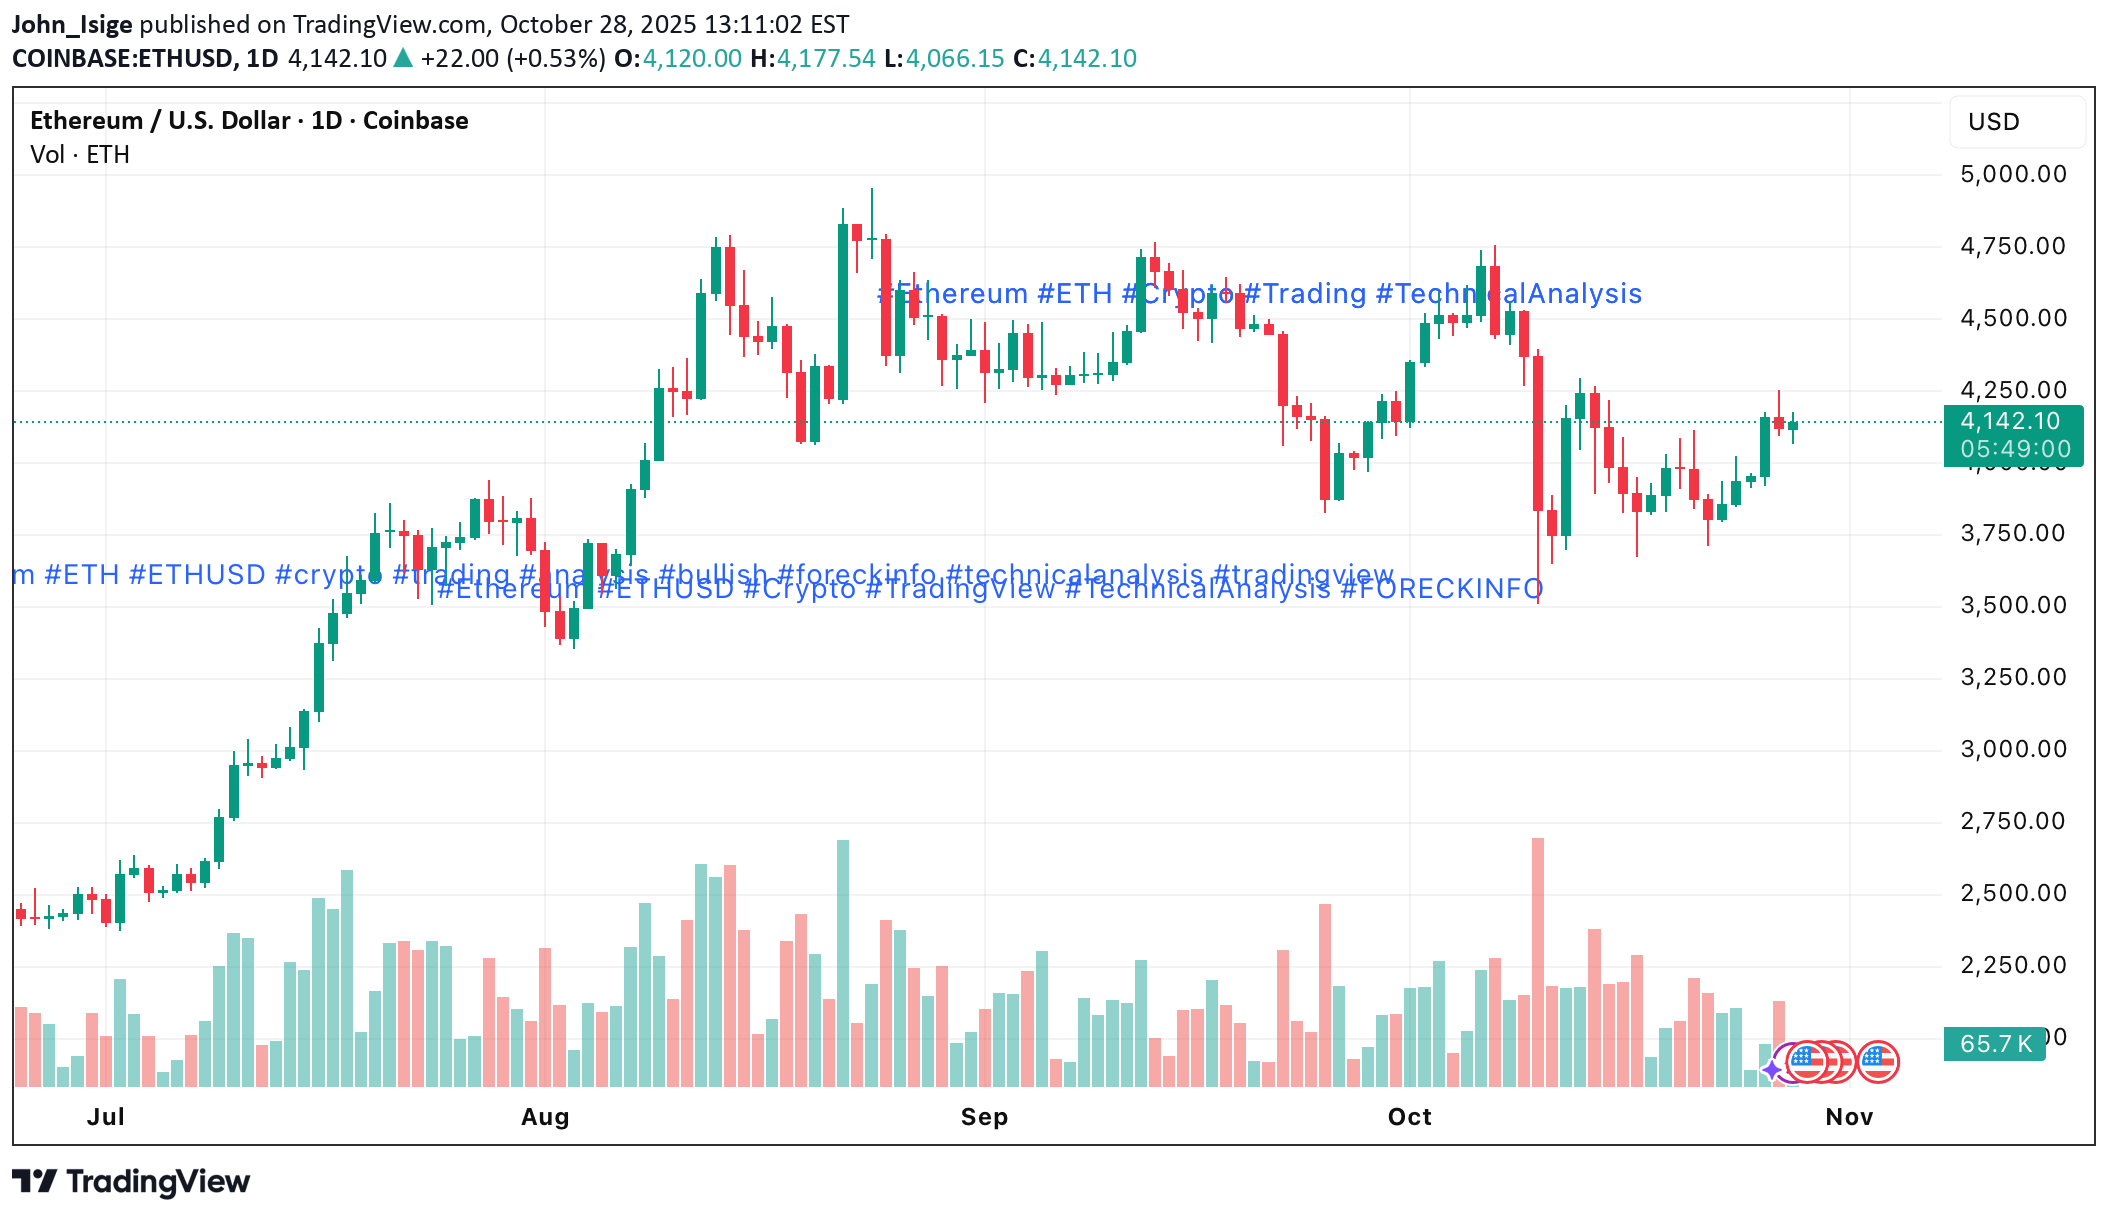
Ethereum (ETH/USD) remains within a medium-term downtrend, consolidating after testing the 3,750 zone (Murray level [4/8]) near the lower boundary of the descending channel last week. Despite multiple attempts, bears failed to push the price lower, leading to a rebound and short-term stabilization. Currently, ETH is trading above 3,962.50 (Murray level [5/8], 23.6% Fibonacci retracement), supported by the middle Bollinger Band. However, confirmation of a trend reversal would only come if the price secures a breakout above 4,375.00 (Murray level [6/8]) — a move that would also break the upper boundary of the descending channel and open the path toward 5,000.00 (Murray level [8/8]) and 5,625.00 (Murray level [+2/8]). On the downside, the key bearish level remains 3,750.00; a break below it could accelerate the decline toward 3,125.00 (Murray level [2/8], 50.0% Fibonacci retracement) and 2,500.00 (Murray level [0/8]). ⸻ Technical Setup •Bollinger Bands are turning downward, reflecting a continuation of bearish pressure. •MACD remains in negative territory, though its histogram is flattening — suggesting short-term consolidation. •Stochastic has entered the overbought zone and is starting to turn down, hinting at a potential pullback. Resistance levels: 4,375 — 5,000 — 5,625 Support levels: 3,750 — 3,125 — 2,500 ⸻ Trading Plan Primary Scenario (Sell Stop) •Entry: 3,749.95 •Take Profit: 3,125 / 2,500 •Stop Loss: 4,075 •Bias: Bearish below 3,750 •Timeframe: Weekly Alternative Scenario (Buy Stop) •Entry: 4,375.05 •Take Profit: 5,000 / 5,625 •Stop Loss: 3,960 •Bias: Bullish above 4,375 ⸻ 💬 ETH/USD continues to trade under medium-term pressure. A breakout above 4,375 would shift sentiment bullish, while a move below 3,750 opens the door to deeper correction targets near 3,125 and 2,500.