Technical analysis by John_Isige about Symbol ETH: Buy recommendation (11/4/2025)

تحلیل هفتگی اتریوم: آیا سقوط به زیر ۳۵۴۰ دلار قطعی است؟
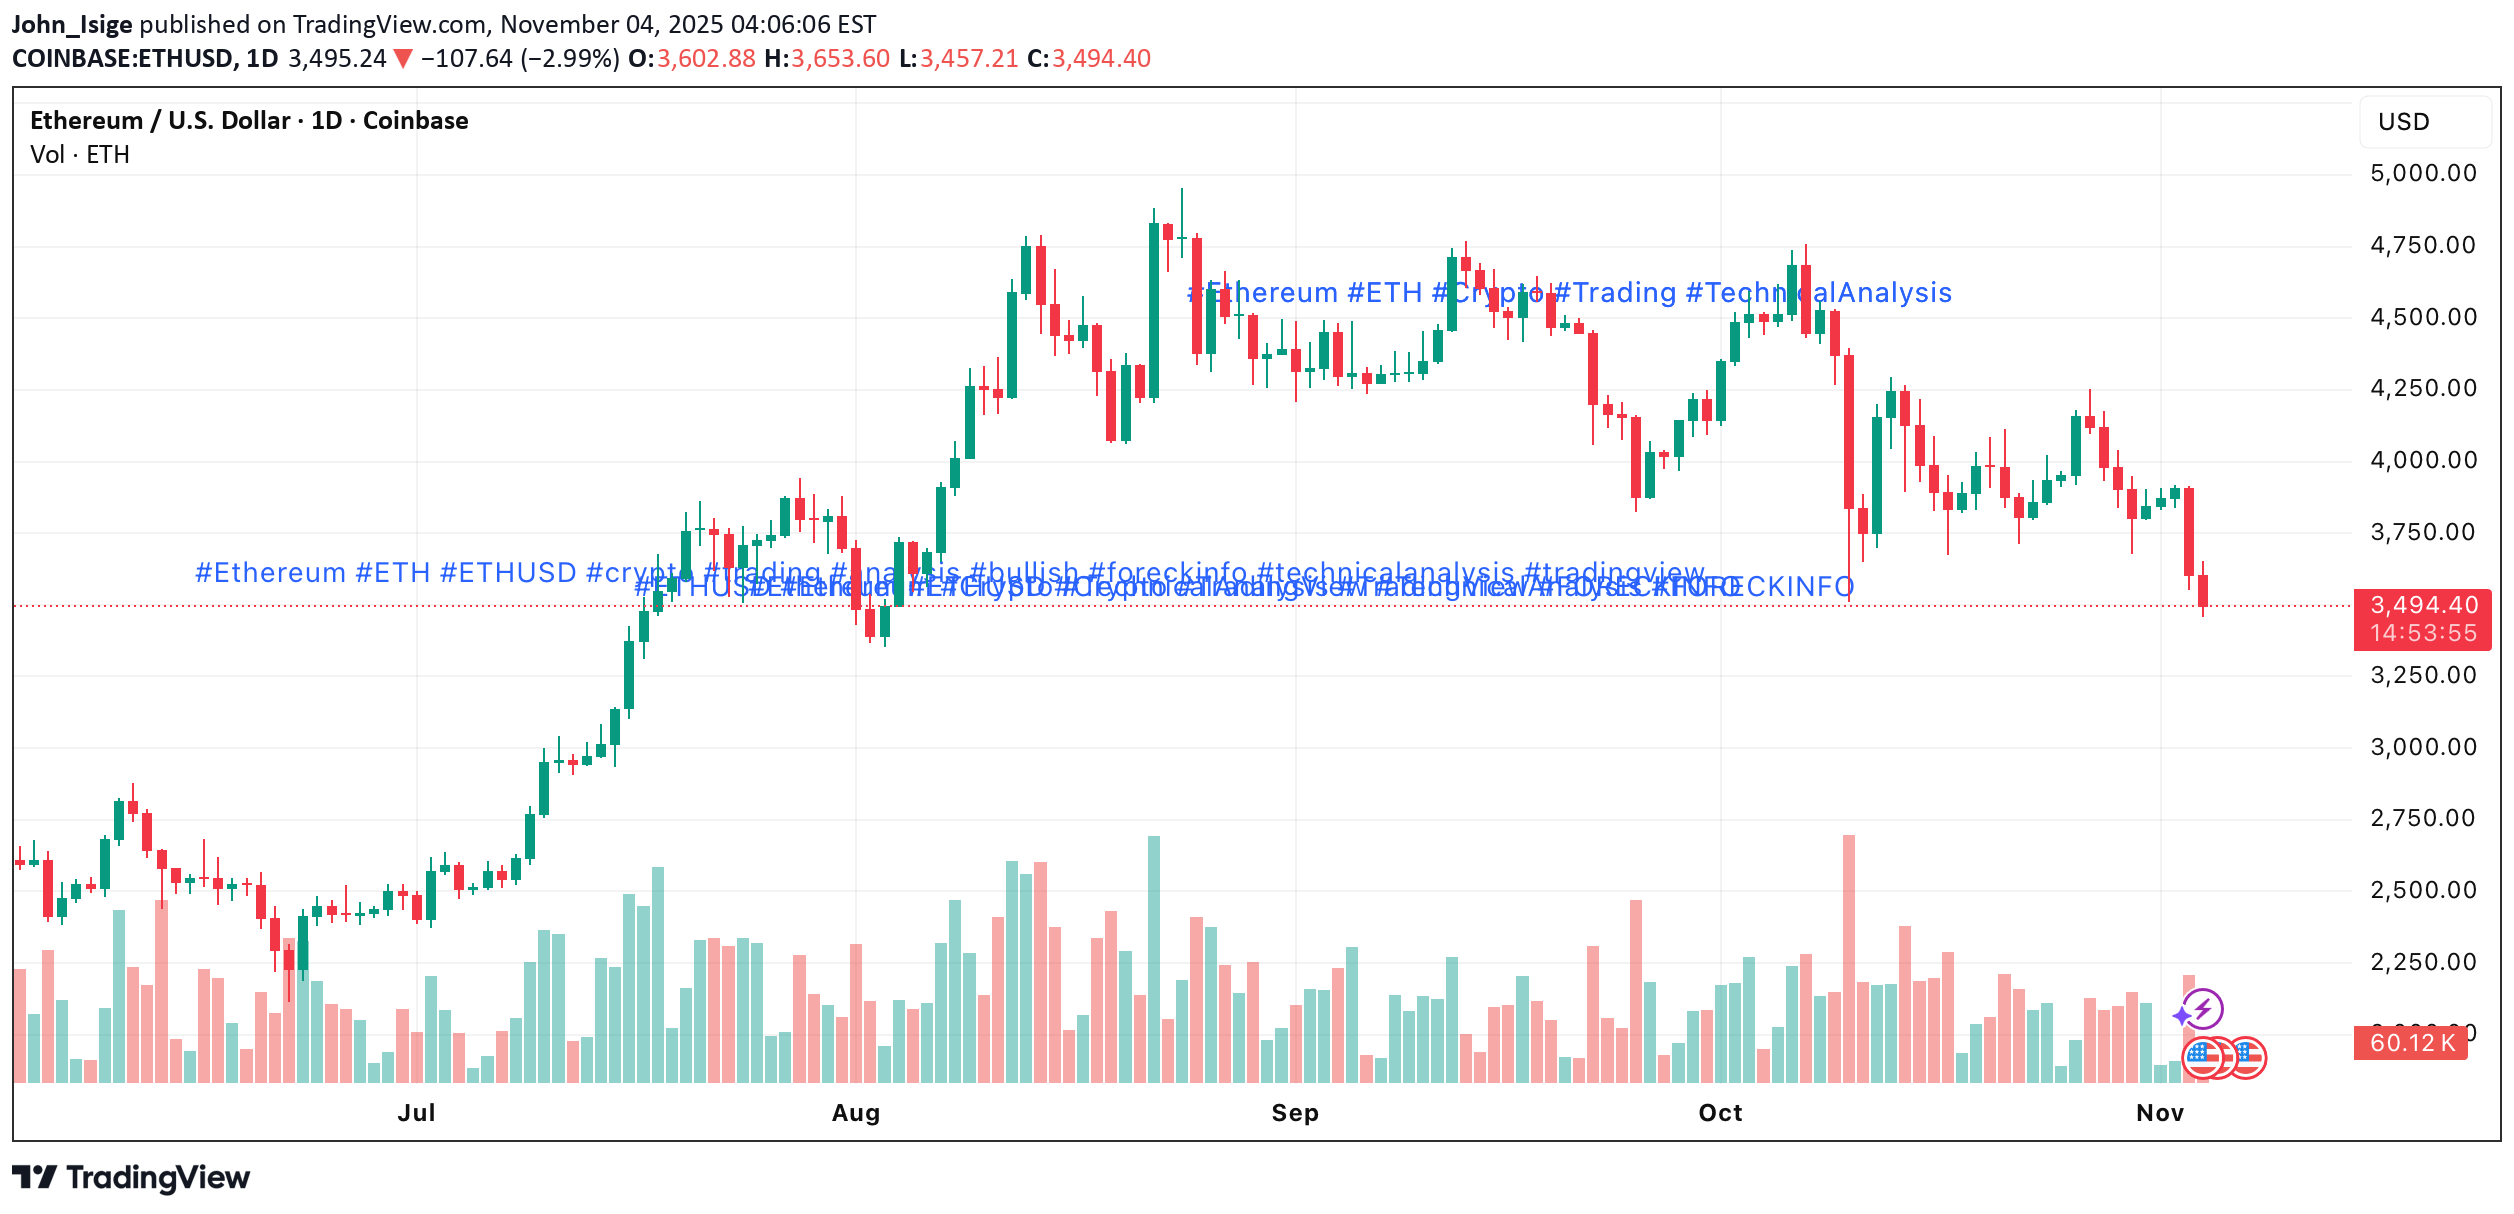
ETH/USD continues to trade within a medium-term downtrend, retracing against its broader long-term bullish structure. Last week, the pair tested the lower boundary of the descending channel near 3,540.00 (Fibonacci 38.2% correction). A confirmed break below this area could trigger an extension toward 3,125.00 (Murray level [2/8], Fibonacci 50.0%) and 2,500.00 (Murray level [0/8]). However, if bulls manage to lift the price above 4,062.50 (Murray level [5/8], Fibonacci 23.6%) and reclaim the middle Bollinger Band, ETH/USD could exit its bearish channel, opening the way to 4,687.50 (Murray [7/8]) and 5,000.00 (Murray [8/8]). ⸻ Technical Setup •Bollinger Bands are turning downward — confirming sustained bearish pressure. •MACD histogram expands in the negative zone — momentum remains on the downside. •Stochastic Oscillator is approaching oversold territory — a short-term correction cannot be ruled out. Resistance levels: 4,062.50 — 4,687.50 — 5,000.00 Support levels: 3,540.00 — 3,125.00 — 2,500.00 ⸻ Trading Plan Primary Scenario (Sell Stop) •Entry: 3,470.00 •Take Profit: 3,125.00 / 2,500.00 •Stop Loss: 3,740.00 •Bias: Bearish continuation below 3,750.00 •Timeframe: Weekly Alternative Scenario (Buy Stop) •Entry: 4,065.00 •Take Profit: 4,687.50 / 5,000.00 •Stop Loss: 3,660.00 •Bias: Bullish reversal above 4,062.50 ⸻ 💬 ETH remains under pressure within its descending channel. A drop below 3,540.00 could accelerate the decline toward 3,125.00, while a breakout above 4,062.50 would signal a potential bullish reversal toward 4,687.50 and 5,000.00.