Technical analysis by John_Isige about Symbol BTC: Buy recommendation (10/27/2025)

بیت کوین در آستانه تصمیم فدرال رزرو: آیا مقاومت کلیدی شکسته میشود؟
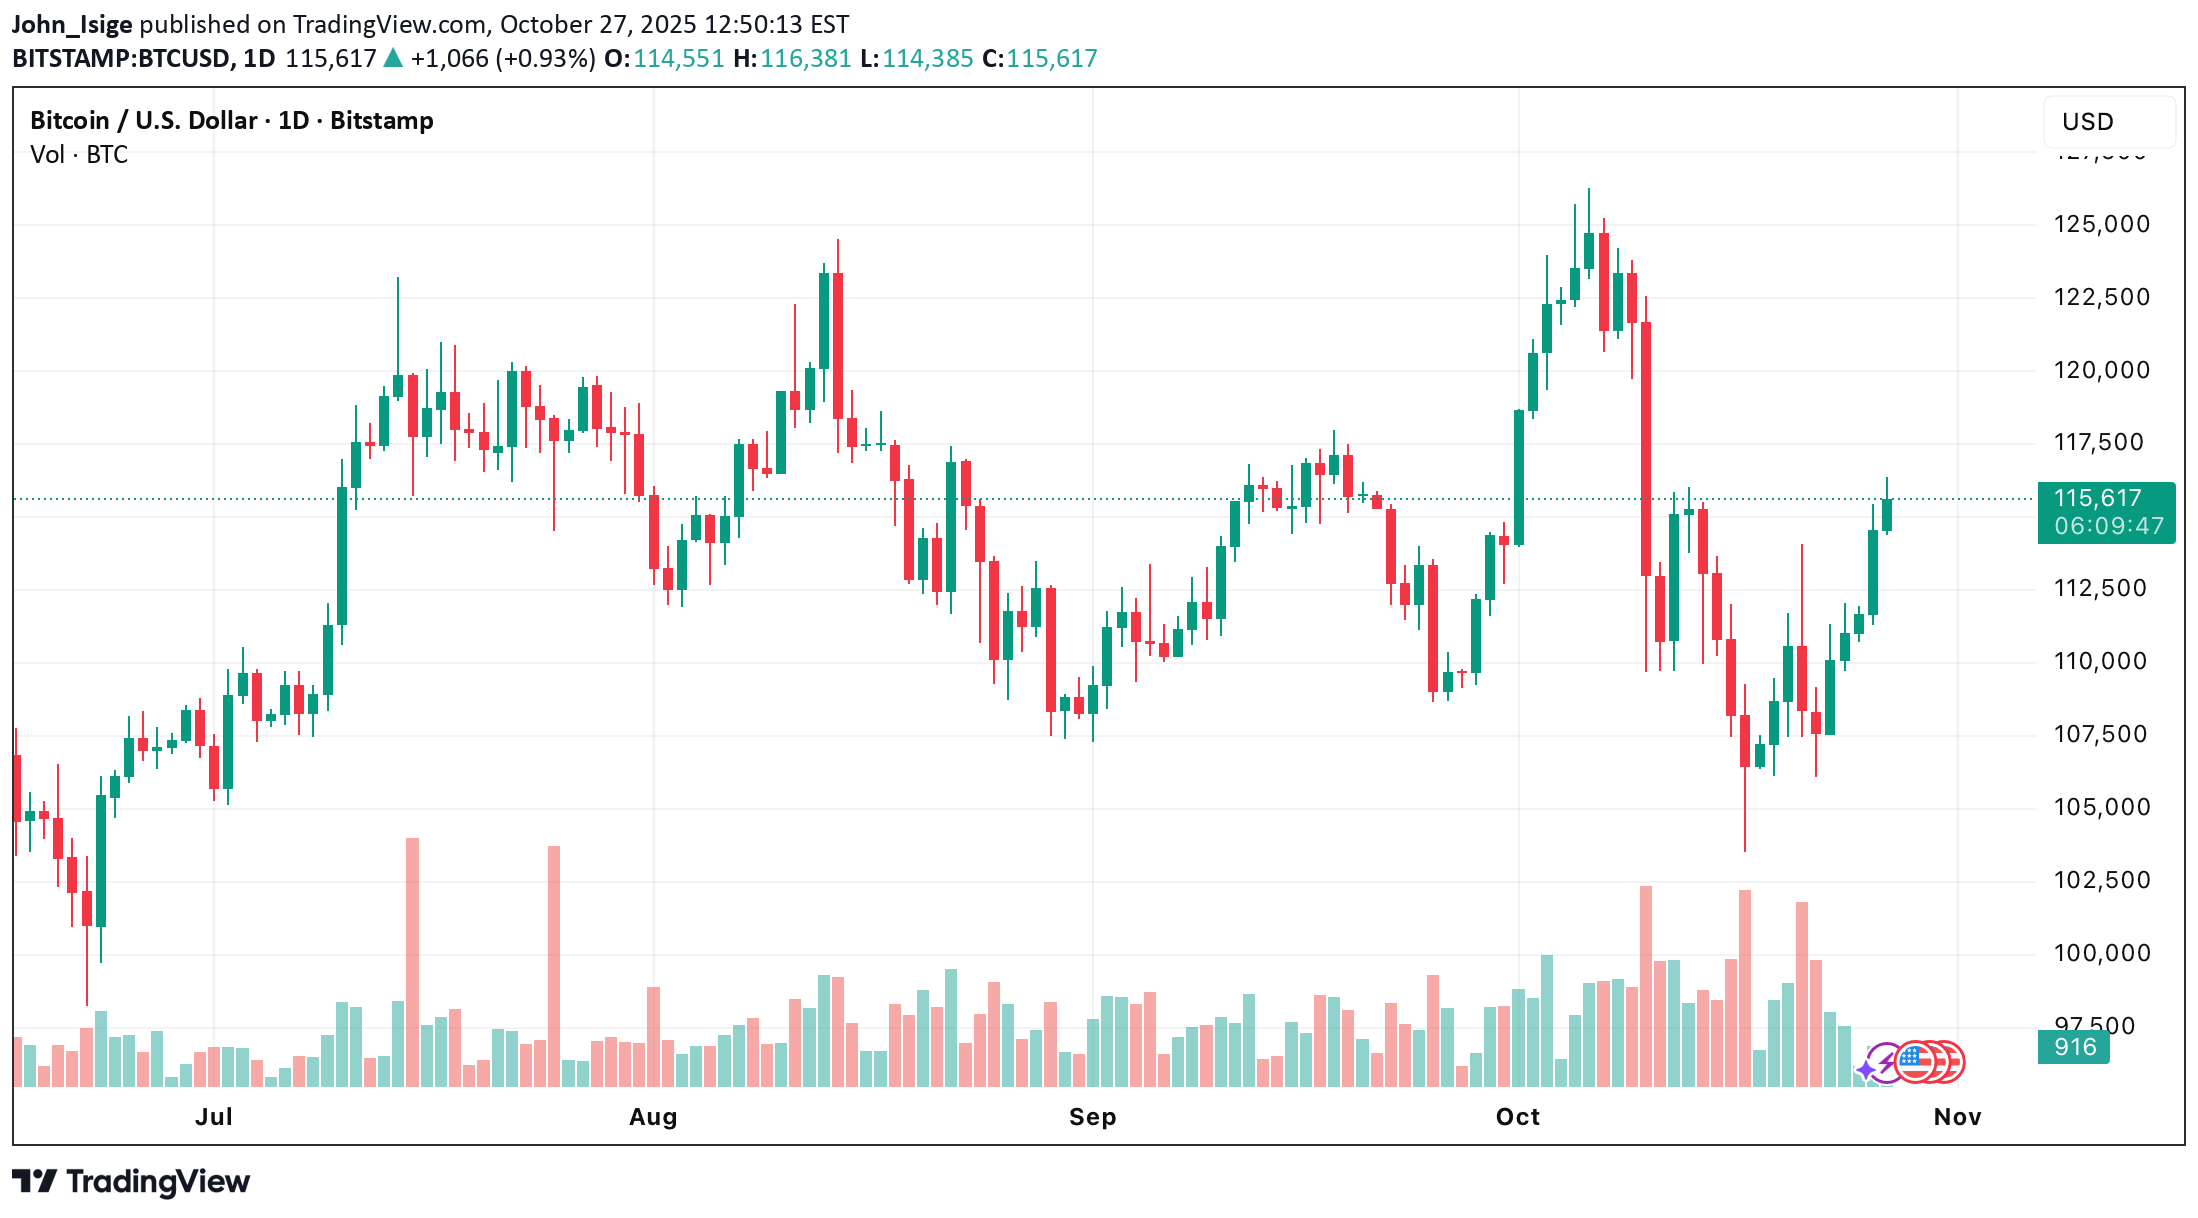
Bitcoin (BTC/USD) resumed its upward movement last week, testing the 115,625 area (Murray level [5/8]) as investors rotated back into risk assets. The renewed momentum followed growing expectations that the Federal Reserve will cut interest rates by 25 basis points at its Wednesday meeting and possibly ease further in December. Market sentiment was also boosted by signals of progress in U.S.–China trade relations ahead of the APEC summit in Seoul on October 31, where U.S. President Donald Trump and Chinese President Xi Jinping are expected to meet. Chinese official Li Chengang noted that a preliminary consensus had been reached on key issues such as export controls, fentanyl, and transport tariffs, while U.S. Treasury Secretary Scott Bessent told CBS that the proposed 100% tariffs on Chinese imports are “off the table.” Trump himself stated that both sides are “close to a trade deal.” These developments reduced fears of further escalation and lowered the risk of a global economic slowdown. As a result, the U.S. dollar weakened, while risk appetite improved across equities and crypto markets. The Crypto Fear & Greed Index climbed back into neutral territory for the first time in weeks, reaching 51. ⸻ Technical Setup BTC/USD broke above the middle Bollinger Band and is now testing the 115,625 resistance zone (Murray level [5/8]). •A confirmed breakout above this level would likely extend the rally toward 121,875 (Murray level [7/8]) and 125,000 (Murray level [8/8]). •For bears, the critical zone lies at 112,500 (Murray level [4/8]), reinforced by the midline of the Bollinger Bands. A breakdown below this area could trigger a pullback toward 106,250 (Murray level [2/8]) and 100,000 (Murray level [0/8]). Indicators: •Bollinger Bands: starting to flatten after a downward expansion. •MACD: approaching a bullish crossover, hinting at renewed momentum. •Stochastic: rising but nearing the overbought zone, suggesting potential short-term exhaustion. Resistance levels: 115,625 — 121,875 — 125,000 Support levels: 112,500 — 106,250 — 100,000 ⸻ Trading Plan Primary Scenario (Buy Stop) •Entry: 115,625.05 •Take Profit: 121,875 / 125,000 •Stop Loss: 113,200 •Bias: Bullish above 115,625 •Timeframe: Weekly Alternative Scenario (Sell Stop) •Entry: 112,499.95 •Take Profit: 106,250 / 100,000 •Stop Loss: 115,000 •Bias: Bearish below 112,500 💬 Bitcoin remains in focus ahead of the Fed’s rate decision and the U.S.–China summit. A break above 115,625 could signal a renewed leg higher, while failure to hold 112,500 risks deeper correction.