Technical analysis by John_Isige about Symbol BTC on 11/10/2025

تحلیل هفتگی بیت کوین: آیا ریزش ادامه دارد یا منتظر صعود هستیم؟
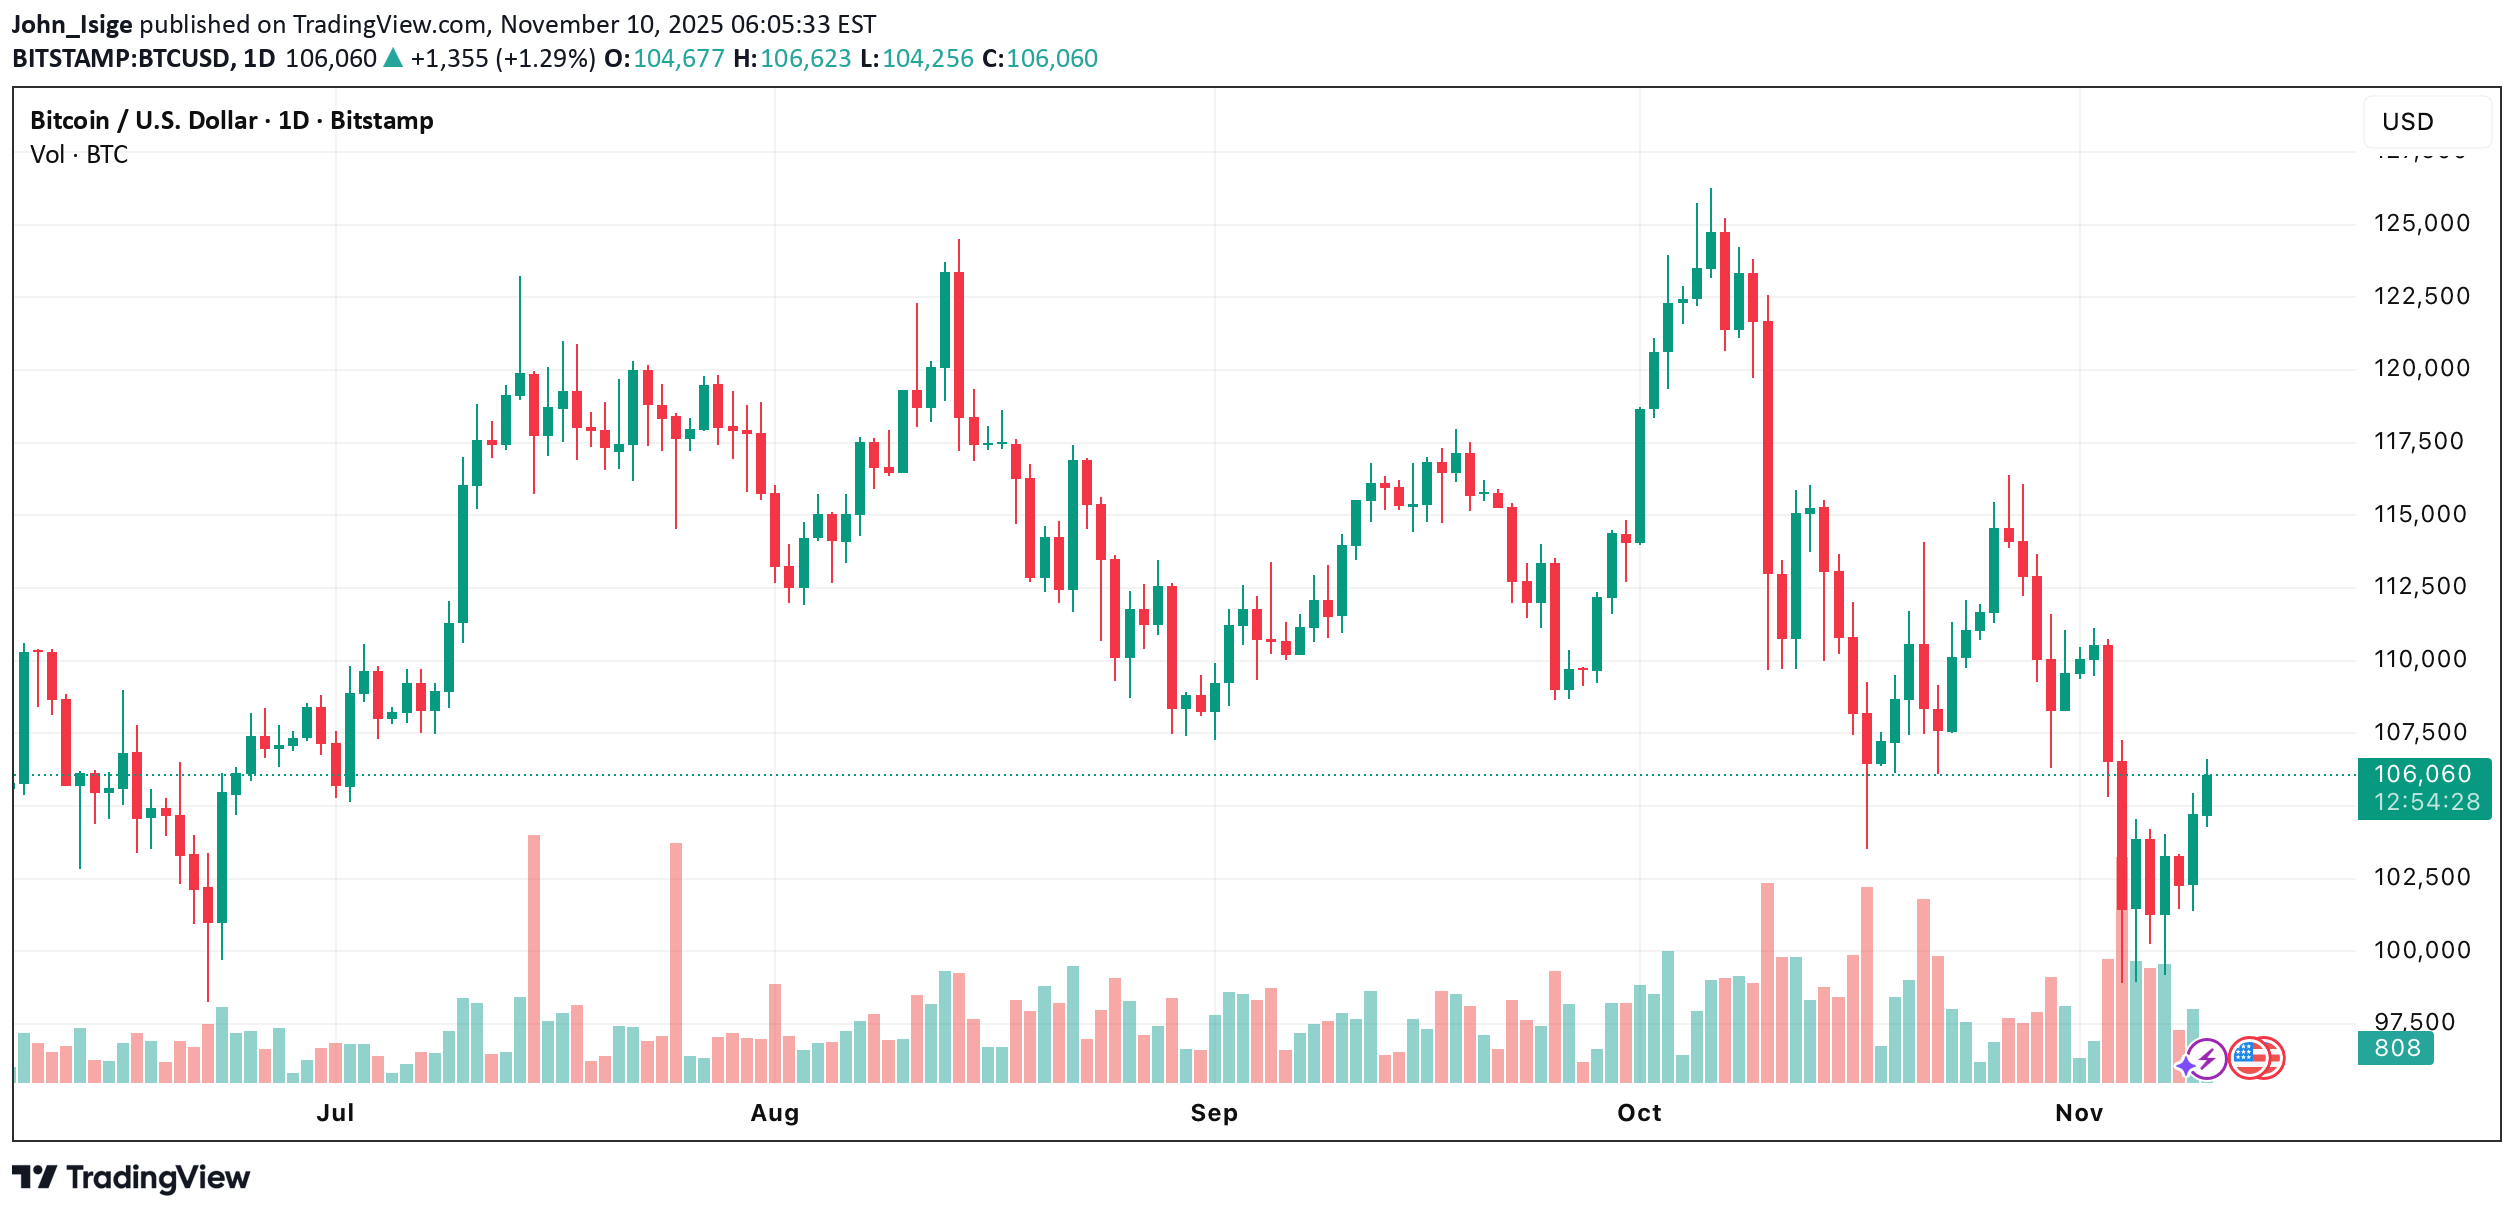
BTC/USD continues to move within a descending channel. •A breakout above 109,375.00 (Murray [5/8]), aligned with the midline of the Bollinger Bands, could trigger an upward move toward 115,625.00 (Murray [6/8]), 121,875.00 (Murray [7/8]), and 125,000.00 (Murray [8/8]). •Conversely, a sustained break below 100,000.00 (Murray [0/8]) would likely extend the decline toward 93,750.00 (Murray [–2/8], Fibonacci 61.8% correction). Resistance levels: 109,375.00 — 115,625.00 — 121,875.00 — 125,000.00 Support levels: 100,000.00 — 93,750.00 ⸻ Technical Outlook •Bollinger Bands: Sloping downward — consistent with continued bearish pressure. •MACD: Stable in the negative zone — momentum favors sellers. •Stochastic: Rising toward overbought territory, hinting at a possible near-term reversal. ⸻ Trading Scenarios Primary Scenario (Sell Stop) •Entry: 99,960.00 •Take Profit: 93,750.00 •Stop Loss: 104,400.00 •Bias: Bearish continuation below 100,000.00 •Timeframe: 5–7 days Alternative Scenario (Buy Stop) •Entry: 109,400.00 •Take Profit: 115,625.00 / 121,875.00 / 125,000.00 •Stop Loss: 105,300.00 •Bias: Bullish reversal above 109,375.00 ⸻ 💬 Bitcoin remains under selling pressure within its descending channel. A break below 100,000.00 could accelerate the move toward 93,750.00, while a close above 109,375.00 would mark the first sign of a potential bullish reversal.