
CryptoCoinsCoach
@t_CryptoCoinsCoach

What symbols does the trader recommend buying?
Purchase History
پیام های تریدر
Filter
CryptoCoinsCoach
گالا (GALA) از کانال نزولی خارج شد: آیا موج صعودی جدید آغاز میشود؟

GALA has been trading inside a well-defined descending channel following a strong sell-off. Recently, price pushed above the upper boundary of the channel, signaling an early breakout attempt after a prolonged bearish phase. At the moment, price is holding above the former channel resistance, which is now acting as a short-term support zone. If this level continues to hold with acceptance, upside continuation toward the next resistance around zero point zero zero seven nine and later toward the higher resistance near zero point zero one two seven becomes possible. On the downside, a failure to hold above the reclaimed channel would indicate a false breakout. In that case, price could rotate back toward the lower support region around zero point zero zero five nine, keeping the broader bearish structure active. This setup is based on descending channel dynamics, support resistance flip behavior, and early breakout confirmation. Acceptance above the channel is required before stronger continuation.
CryptoCoinsCoach
BTC Attempting Breakout From Descending Structure

Bitcoin has been trading inside a well-defined descending structure following the rejection from cycle highs. Recently, price formed a higher low near the lower boundary of the structure and is now attempting a breakout above descending resistance. This move suggests a possible shift from corrective behavior to recovery. If price manages to break and hold above the descending trendline with acceptance, upside continuation toward the previous resistance zones in the one hundred thousand region becomes likely. However, this is still a confirmation phase. A rejection at resistance would keep the broader corrective structure active and could lead to another rotation toward the lower support region around the mid eighty-thousand area. This setup is based on descending structure dynamics, higher low formation, and breakout retest behavior. Confirmation above resistance is required before treating this as a trend continuation.
CryptoCoinsCoach
BTC Corrective Structure Still Active Below Resistance

Bitcoin remains in a broader corrective phase after failing to sustain above the recent highs. Price is currently trading below a descending resistance structure, with repeated rejections confirming that sellers are still in control on the short to mid timeframe. The recent bounce appears corrective rather than impulsive, forming lower highs beneath resistance. As long as Bitcoin stays below the highlighted supply zone around the low ninety-thousand area, downside risk remains active. On the downside, Fibonacci retracement levels align with potential reaction zones around the seventy-seven thousand and seventy-three thousand regions. A deeper corrective extension could also test the lower demand near the high sixty-thousand zone if selling pressure accelerates. A bullish shift would only be considered if price reclaims the descending structure and holds above resistance with acceptance. Until then, this remains a corrective market phase within a larger cycle.
CryptoCoinsCoach
TURBO Impulse Followed by Healthy Retracement

TURBO printed a strong impulsive move to the upside after a base formation, clearly shifting short-term momentum bullish. Following this expansion, price entered a corrective phase and is now retracing into a well-defined demand zone aligned with Fibonacci retracement levels. This pullback is so far constructive rather than bearish. As long as price holds above the highlighted demand region, the structure supports continuation toward the previous high and potentially into the upper resistance zone near zero point zero zero two two. If the demand zone fails to hold, the retracement could extend deeper toward the lower support area around zero point zero zero one six, delaying continuation and resetting structure. This setup is based on impulse and retracement behavior, demand reaction, and Fibonacci confluence. Confirmation from the demand zone will determine the next directional leg.
CryptoCoinsCoach
BOME Reclaim Attempt After Descending Channel Break

BOME spent an extended period trading inside a well-defined descending channel following a sharp sell-off. Price has now broken above the lower channel boundary and is attempting to reclaim structure, signaling a potential shift from pure continuation to a recovery phase. Currently, price is holding above the recent local support zone around zero point zero zero zero six three. As long as this level is defended, upside continuation toward the mid and upper channel resistance becomes possible, with the next major resistance sitting near zero point zero zero zero eight one. If price fails to hold this reclaimed area and slips back below the recent support, the move would be classified as a failed reclaim, and continuation toward lower demand zones remains likely. This setup is driven by descending channel dynamics, support reclaim behavior, and post-break stabilization. Confirmation above reclaimed structure is required before stronger continuation.
CryptoCoinsCoach
TLM Impulsive Move Followed by Demand Retest

TLM printed a strong impulsive breakout after a long consolidation phase, creating a clear displacement to the upside. Following this move, price entered a corrective phase and is now pulling back toward a well-defined demand zone formed between the Fibonacci retracement levels. This zone represents a healthy retracement area rather than immediate weakness. As long as price holds above this demand region and shows stabilization, continuation toward higher resistance levels remains possible, including a retest of the recent highs and extension toward the upper resistance around zero point zero zero four. If price fails to hold this demand zone, the correction could deepen toward the lower support levels below zero point zero two one, invalidating the bullish continuation scenario. This setup is based on impulse–retracement structure, demand reaction behavior, and Fibonacci confluence. Confirmation from this zone will define the next directional move.
CryptoCoinsCoach
VET Retesting Falling Wedge Breakout Zone

VeChain previously traded inside a falling wedge after a prolonged bearish move. That structure has now broken to the upside, and price is currently retesting the former wedge resistance, which is acting as a key decision zone. This retest is critical for short-term structure. If VET manages to hold above this reclaimed level and shows acceptance, continuation toward the next resistance zone around zero point zero one two two becomes likely, followed by a broader recovery toward the upper resistance region near zero point zero one eight. On the bearish side, failure to hold this retest area would signal a failed breakout. In that case, price could rotate back toward the lower demand zone below zero point zero nine four, keeping the broader bearish structure active. This setup is driven by falling wedge breakout mechanics, support resistance flip behavior, and post-breakout retest dynamics. Confirmation at this level will define the next directional move.
CryptoCoinsCoach
BTC Post-Rally Correction from Falling Wedge Breakdown Zone

Bitcoin completed a strong bullish expansion and then entered a corrective phase that developed into a falling wedge near the cycle highs. That wedge has already resolved, and price is now reacting from the breakdown area rather than consolidating inside the structure. At this stage, two primary scenarios remain in play. If Bitcoin holds above the current structure and reclaims the broken wedge zone with acceptance, continuation toward new highs becomes possible, aligning with the broader bullish trend. If price fails to reclaim this zone, the correction can extend deeper. In that case, the market may rotate toward the major higher-timeframe demand zone around the mid-forty thousand region, which previously acted as a strong accumulation area. This setup is driven by post-wedge resolution behavior, trend exhaustion at highs, and higher-timeframe demand alignment. Directional conviction should be taken only after confirmation of reclaim or rejection.
CryptoCoinsCoach
JOE Breakout Above Descending Trendline, Retest in Progress
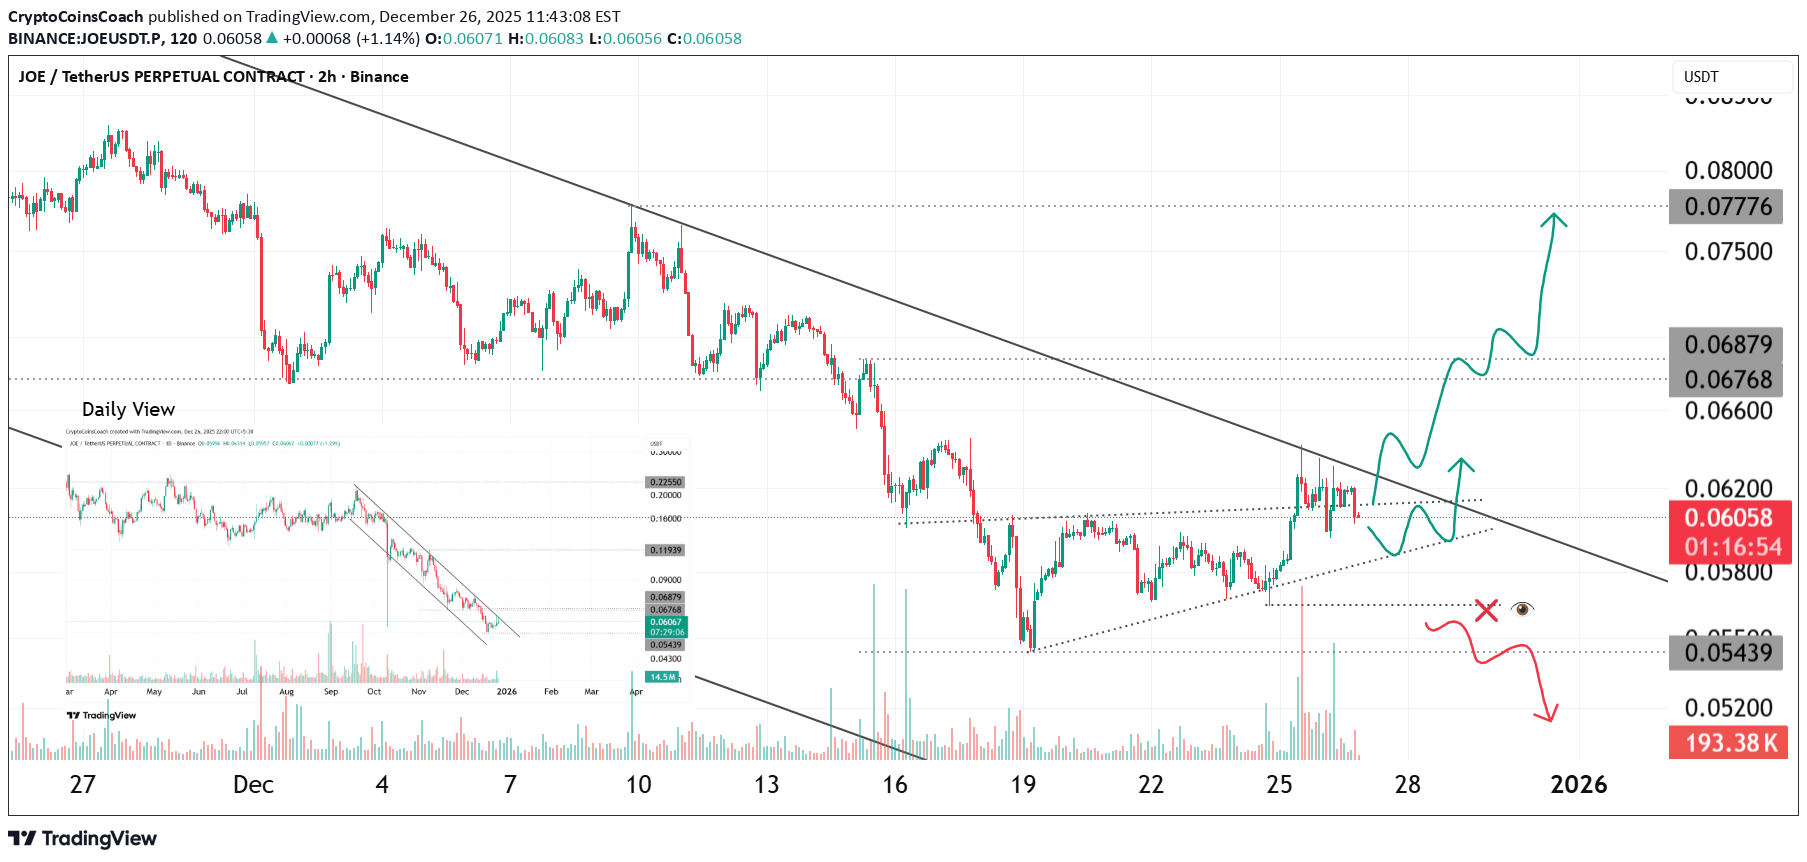
JOE was trending under a strong descending trendline that capped price for an extended period. Price has now broken above this descending resistance, marking a potential shift in short-term structure. After the breakout, JOE is currently retesting the broken trendline, which is acting as a key decision zone. This behavior is typical after a structure break, where the market checks whether former resistance can flip into support. If price manages to hold above the retest zone and shows acceptance, continuation toward the higher resistance areas around zero point zero six eight and zero point zero seven seven becomes likely. This would confirm the breakout and strengthen the bullish continuation scenario. On the downside, failure to hold above the broken trendline would signal a failed breakout. In that case, price could rotate back toward the lower demand zone around zero point zero five four, keeping the broader corrective structure active. This setup is driven by descending trendline breakout mechanics, support resistance flip behavior, and post-breakout retest dynamics. Confirmation at this retest level is essential before expecting follow-through.JOE 8%+🚀💯
CryptoCoinsCoach
شکست C98 از الگوی گُوِه نزولی: آیا زمان صعود فرا رسیده است؟

C98 has been trading inside a falling wedge after a prolonged bearish phase. Both trendlines are sloping downward and converging, indicating compression and gradual loss of bearish momentum rather than strong continuation. Price is currently holding near the lower boundary of the wedge while printing tighter ranges. This area acts as a critical decision zone. If buyers manage to defend this base and push price above the upper wedge resistance, a relief move toward the mid resistance region around zero point zero two five becomes likely, followed by a larger recovery toward the higher resistance zone near zero point zero four five. On the bearish side, failure to hold the wedge base would invalidate the reversal structure. In that case, price may extend lower toward deeper demand zones before any meaningful recovery attempt. This setup is driven by falling wedge compression, momentum exhaustion, and structure tightening near long-term lows. Confirmation through breakout and acceptance is required before expecting sustained upside continuation.C98 4% +🎉 C98 has officially broken above the falling wedge resistance. This confirms the bullish resolution we discussed earlier. Keep eye on C98👀
Disclaimer
Any content and materials included in Sahmeto's website and official communication channels are a compilation of personal opinions and analyses and are not binding. They do not constitute any recommendation for buying, selling, entering or exiting the stock market and cryptocurrency market. Also, all news and analyses included in the website and channels are merely republished information from official and unofficial domestic and foreign sources, and it is obvious that users of the said content are responsible for following up and ensuring the authenticity and accuracy of the materials. Therefore, while disclaiming responsibility, it is declared that the responsibility for any decision-making, action, and potential profit and loss in the capital market and cryptocurrency market lies with the trader.