
GHST
Aavegotchi
| تریدر | نوع سیگنال | حد سود/ضرر | زمان انتشار | مشاهده پیام |
|---|---|---|---|---|
No results found. | ||||
Price Chart of Aavegotchi
سود 3 Months :
سیگنالهای Aavegotchi
Filter
Sort messages by
Trader Type
Time Frame

Crypto-by-PRIME
سقوط GHST/USDT ادامه دارد؟ ناحیه بحرانی حمایت کجاست؟
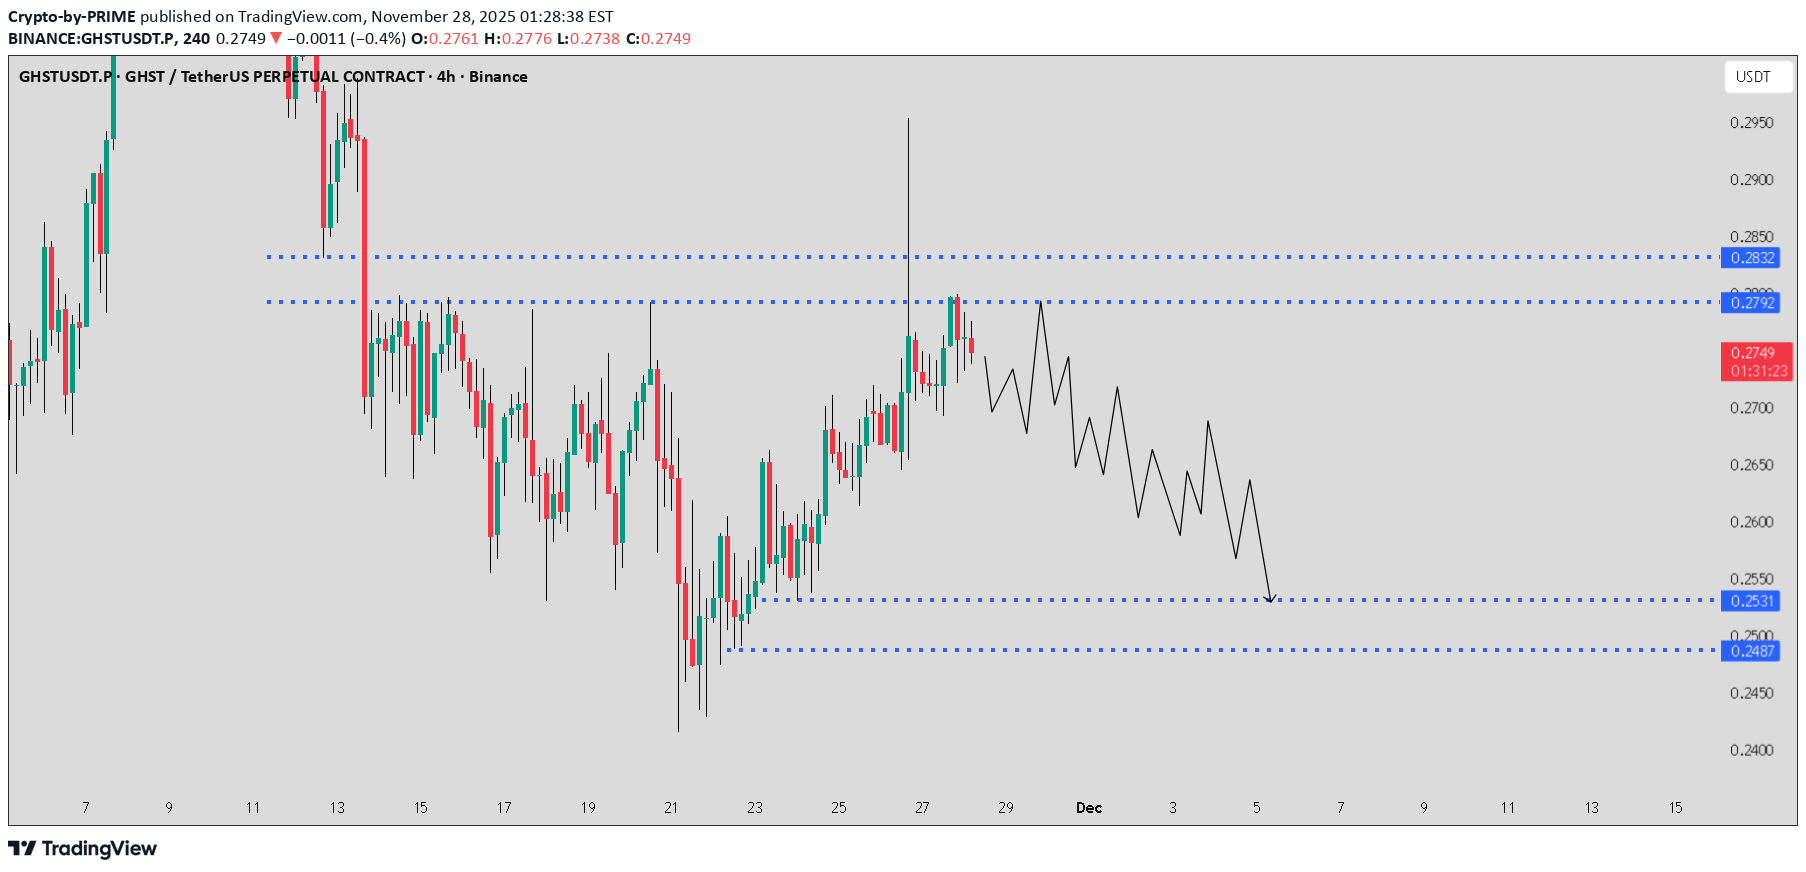
GHST / USDT is showing weakness after rejecting from the FVG resistance. Price is likely to move towards the $0.2530 – $0.2487 zone before any potential reaction. This area remains the safer zone for taking profit on shorts. More downside is still possible, so manage risk and keep stops above the upper marked level.GHST / USDT rejected cleanly from the FVG resistance as expected and is now moving toward the marked zone. Profit is playing out well on this trade. Stay tuned for the next updates.

without_worries
600% print for Aavegotchi (GHST) NFT Gaming protocol?
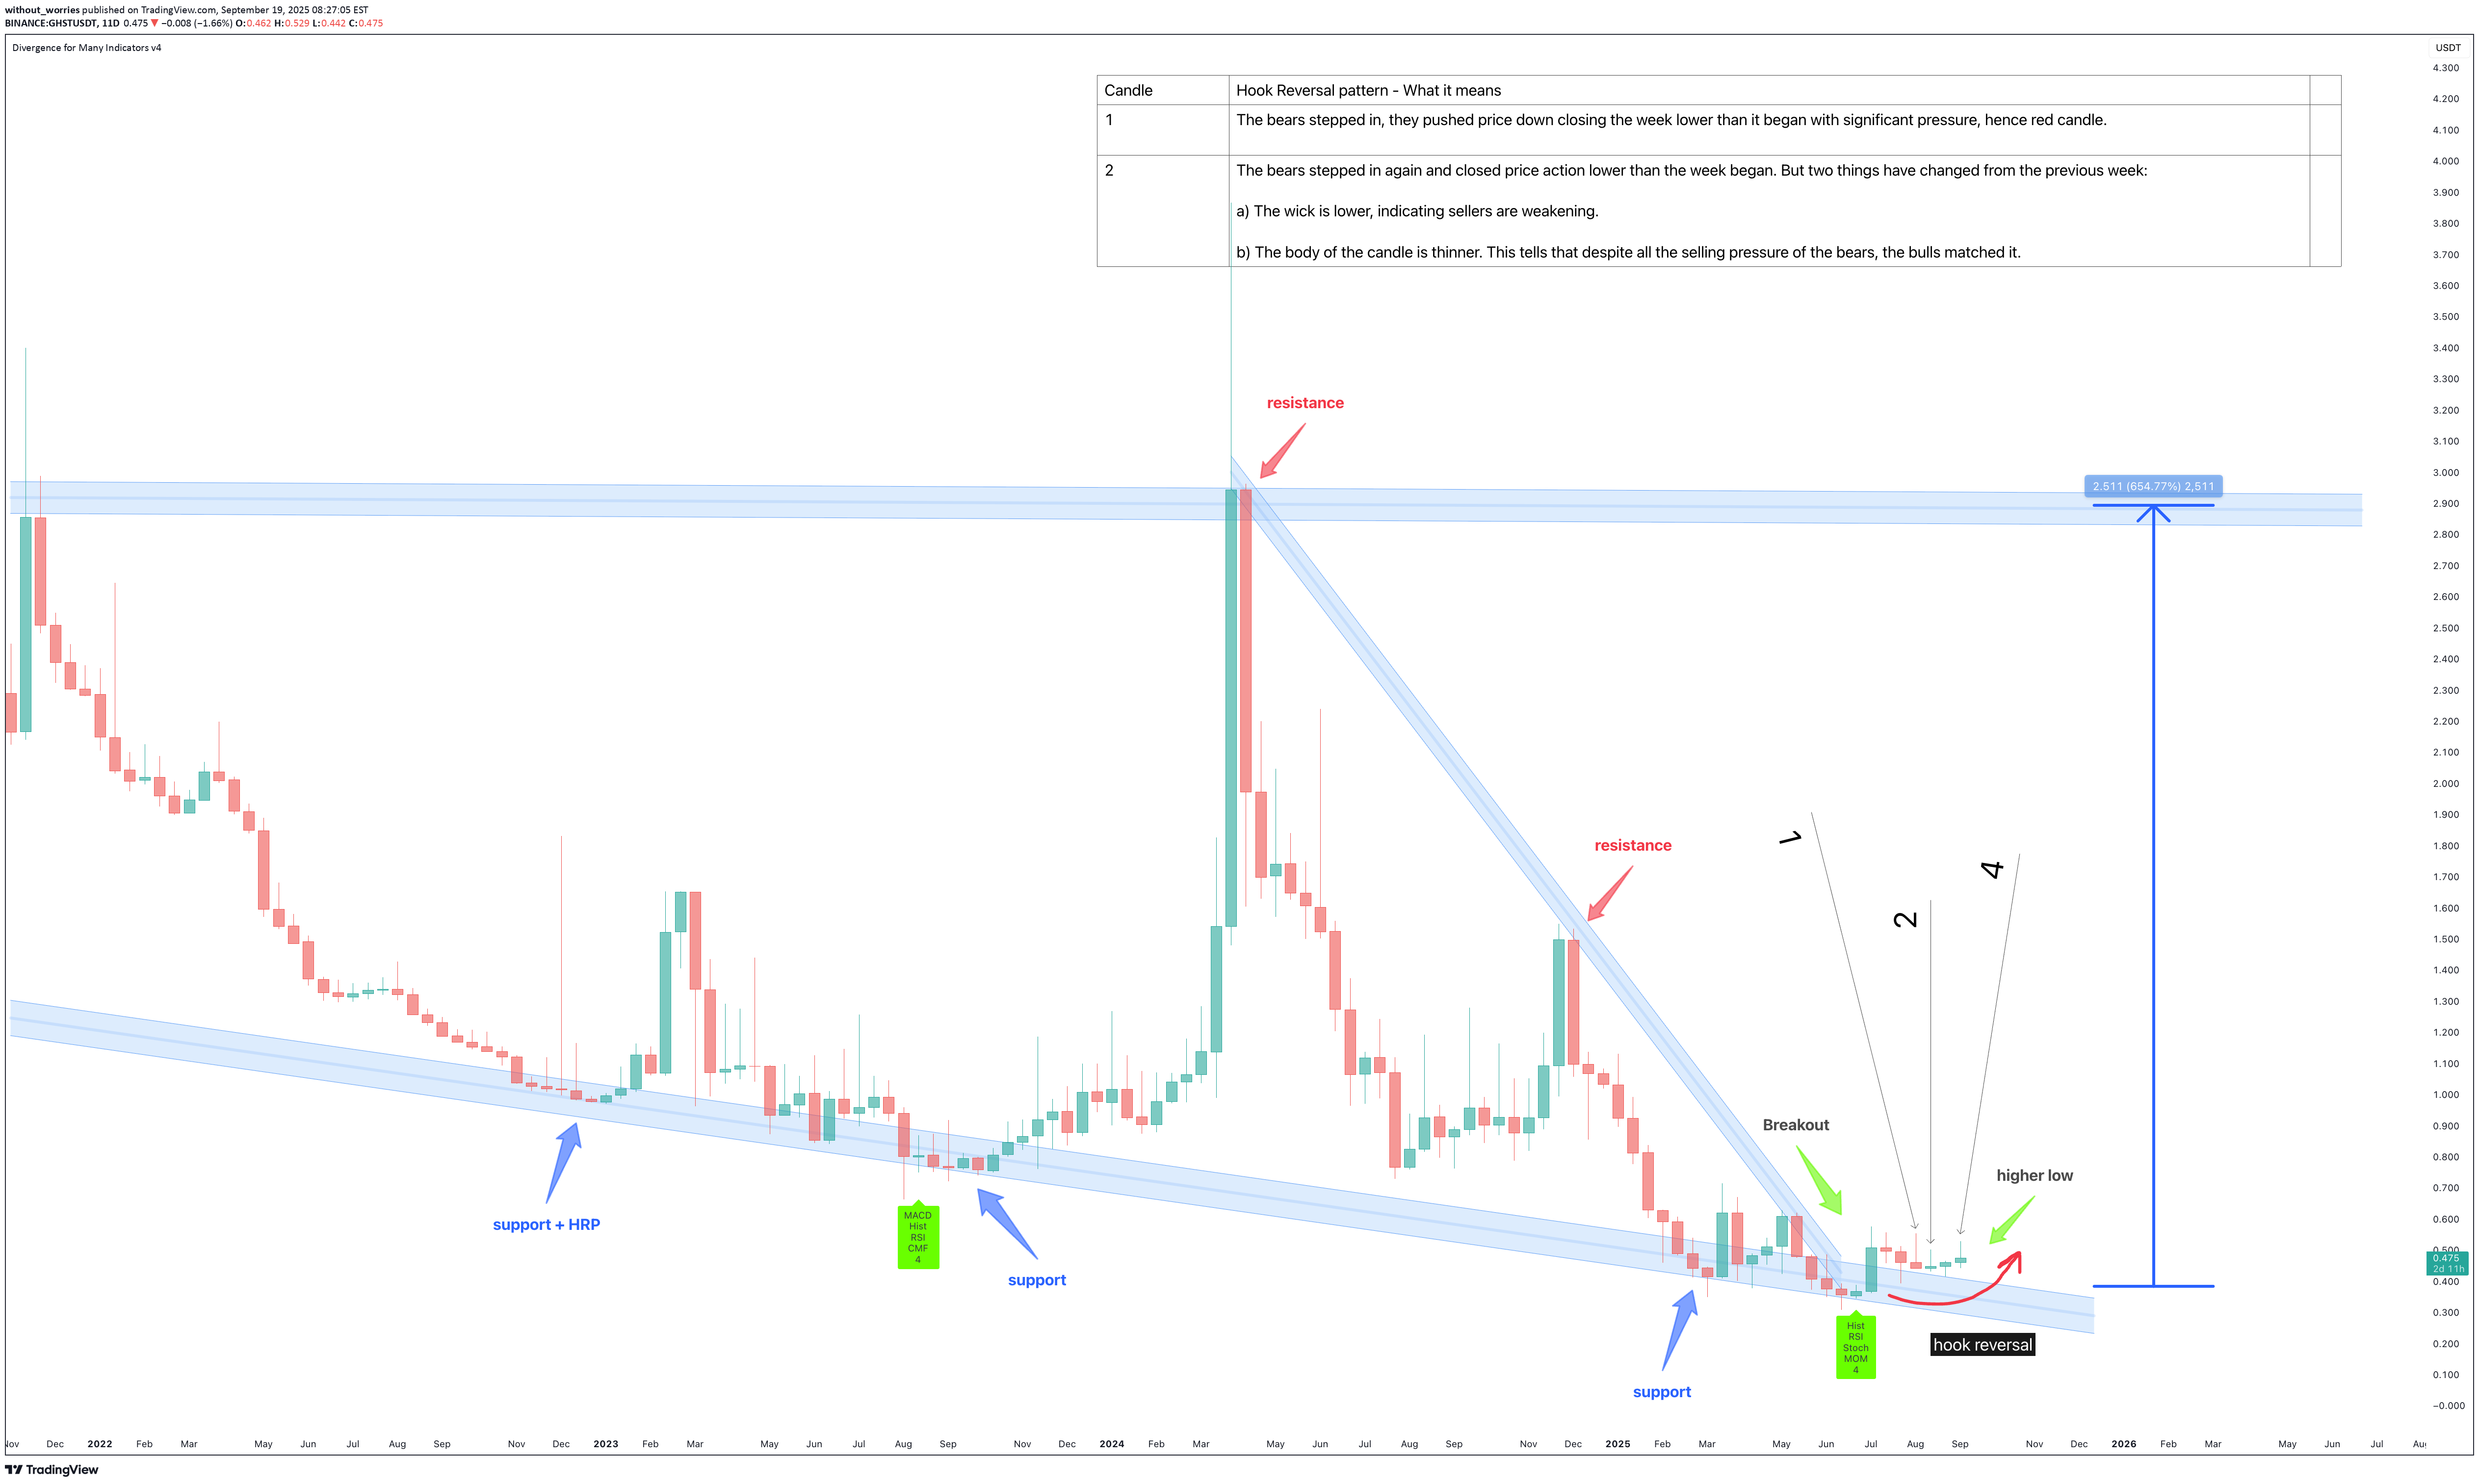
The above 11 day chart (don’t ask) tells us someone somewhere bought this token at $3.85 in March of 2024 before watching a 92% collapse in price action. The marketplace is now gripped by fear. Are sellers today correct, get out now before the remaining -8% to zero strikes? It certainly appears that way. Support and resistance Price action has confirmed support on past resistances. Both legacy and the recent corrective resistance. This is also true of RSI. The trend For the first time in 21 months price action has printed a higher low. Divergence Price action prints positive divergence (USD and Bitcoin pairs) equivalent to that of August 2023 before an strong move printed. Hook reversal pattern A textbook hook reversal pattern has printed. You’ll find those patterns at market bottoms. The psychology of why they print is an interesting subject in its own right: Candle by candle starting from ‘1st candle’ 1) The bears stepped in, pushing price down closing the week lower than it began with significant pressure, hence red candle. 2) The bears stepped in again and closed price action lower than the week began, but two things have changed from the previous week: a) The wick is lower, indicating sellers are weakening. b) The body of the candle is thinner. This tells that despite all the selling pressure of the bears, the bulls matched it. At this point you start to see something significant. A very thin body with a long wick above. This candle is called a ‘morning star’ and is confirmed with a ‘green candle’ in the following trading session, which we have. The psychology here is the bulls entered deep into the bears territory with not as much resistance as the previous session. 4) The first green candle. A ‘indecision candle’. The bears are confirmed ‘exhausted’, bulls closed price action higher than the previous trading session. The height of the wick is important here. Higher is stronger for future impulsive moves. Finally we have arrive at the stage that attracts the most interest, the selling pressure is soaked up by the bulls, with future sell orders not only offered by those who bought at the pivot. This is why you often only see an “up only” move in price action afterwards. Conclusions So, what have we learned? Basically, everyone panicked, sold their tokens like they were on fire and now we’re all sitting here pretending to be experts because a candle looks a bit different. *Ooooh, hook reversal pattern!* Yeah, alright mate, it’s a green line going up after a red one went down. Calm down. The truth is: the bears are knackered, the bulls are sniffing around again, and if history repeats, we might actually see this thing shoot up. Or it won’t. That’s the game, innit? People want certainty but it’s crypto, it’s like betting on which one of your drunk uncles will fall down first at Christmas dinner. Odds are high, outcomes are unpredictable. So yeah, maybe it’s a bottom. Maybe it’s the start of a big run. Or maybe we’ll all be here in two weeks going, “Remember when we thought that was bullish? Ha!” , either way, don’t bet your nan’s house on it. WwActive on publication.

Bithereum_io
GHSTUSDT 1D
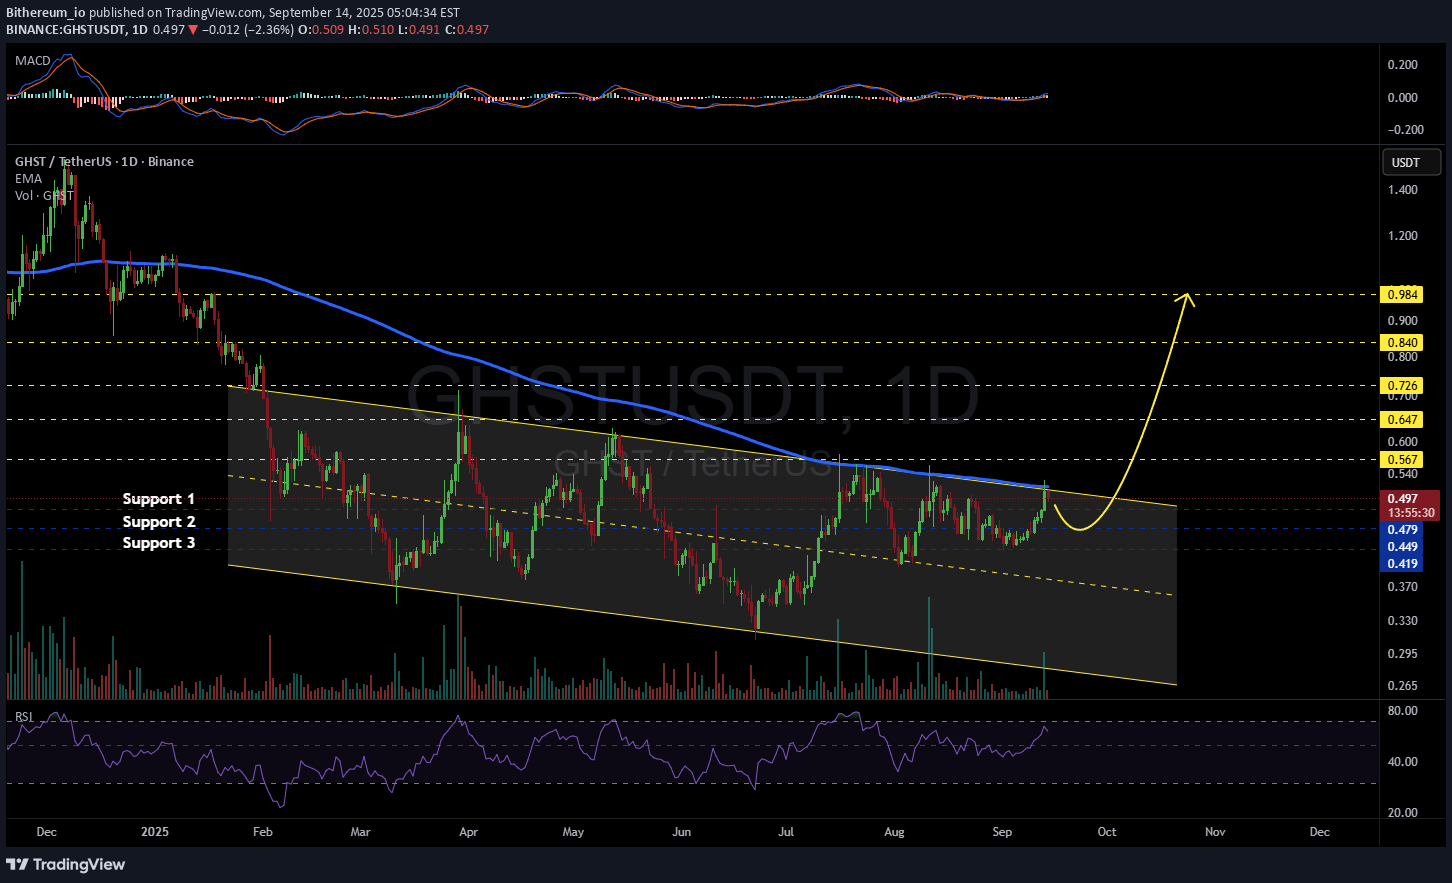
#GHST is moving within a descending channel on the daily chart. It was recently rejected from the channel resistance and the daily EMA200. Consider buying #GHST near the support levels highlighted on the chart. If it breaks out above the channel resistance and the EMA200, the potential targets are: 🎯 $0.567 🎯 $0.647 🎯 $0.726 🎯 $0.840 🎯 $0.984 ⚠️ Always remember to use a tight stop-loss and follow proper risk management.
Crypto-by-PRIME
GHST / USDT : Near to breakout
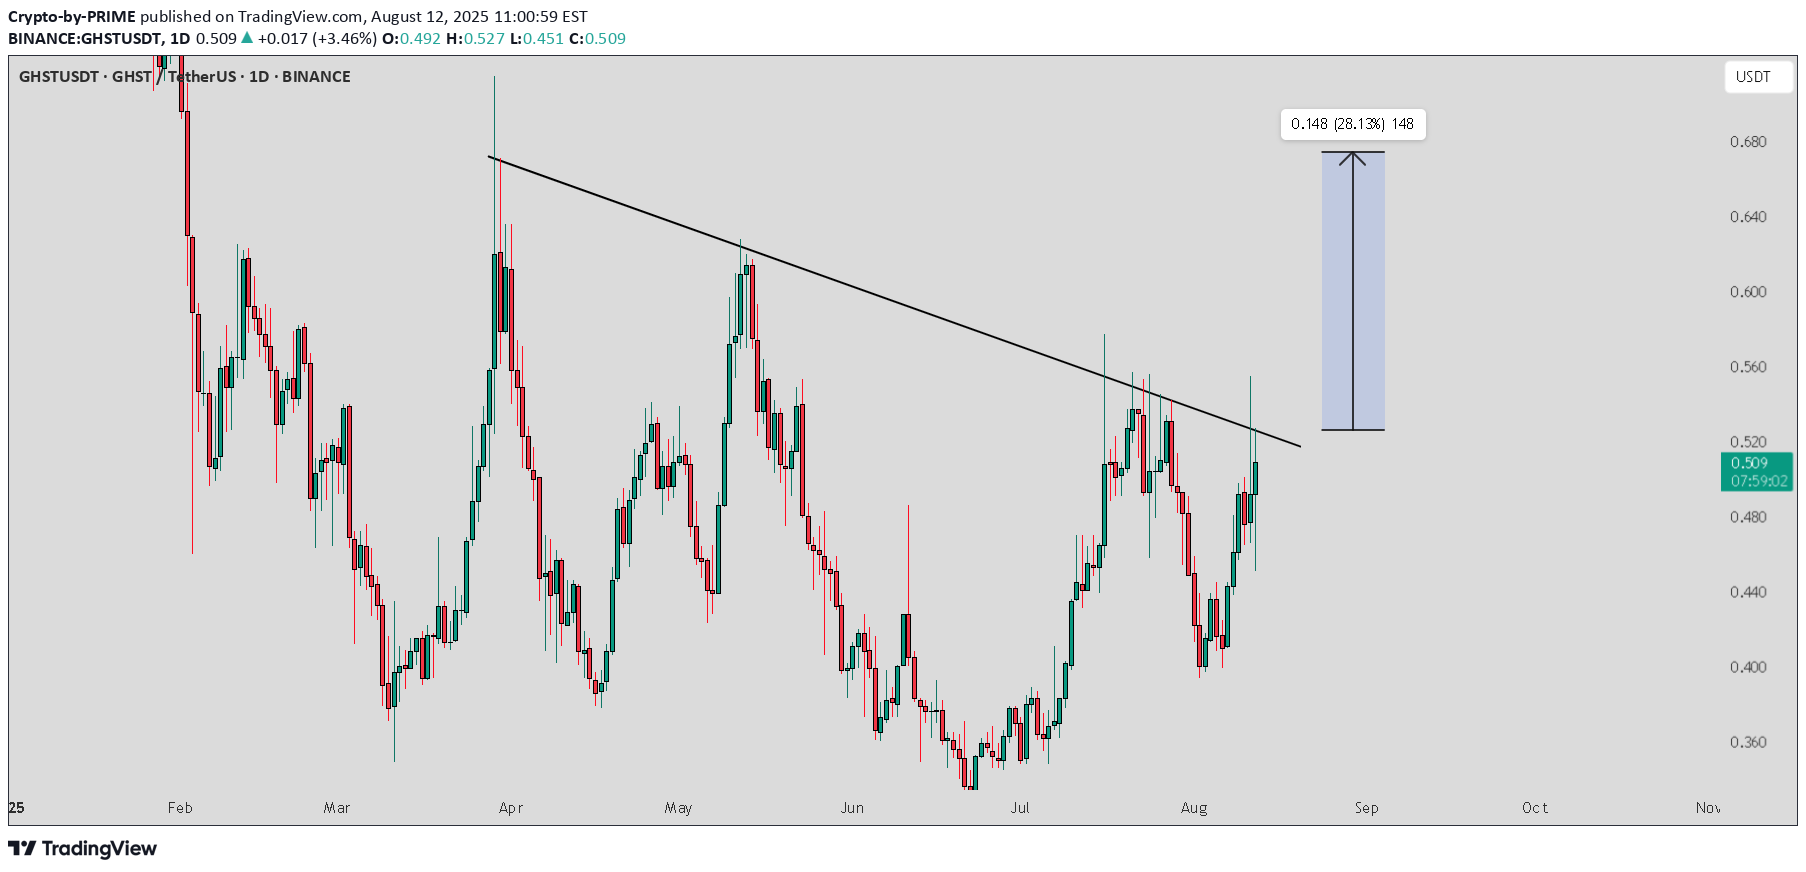
GHST/USDT Chart Analysis: Bullish Breakout Potential Looking at the daily chart, we can see a clear upward momentum after a period of consolidation. The price has recently broken above a long-standing downward trendline, signaling a potential bullish breakout. Trendline Break: The price has successfully moved above the descending resistance line, which has been holding the price down for several months. This break indicates that the market sentiment is shifting toward the bullish side. Target Price: Based on the current price at 0.507 USDT, we’re looking at a potential upside of 28.1% with a target of 0.655 USDT, as indicated by the measured move from the trendline break. Volume Confirmation: The recent volume increase supports the bullish breakout, suggesting strong buying pressure. Key Levels to Watch: Support: 0.480 USDT (recent low) Resistance: 0.530 USDT (immediate resistance) Target: 0.655 USDT (28.1% potential upside) This setup presents an opportunity to enter at current levels or on any pullback towards support. Keep an eye on the 0.530 resistance, as a clean break above this could signal further upside.

Crypto_robotics
GHST/USDT Analysis — High Probability of Correction
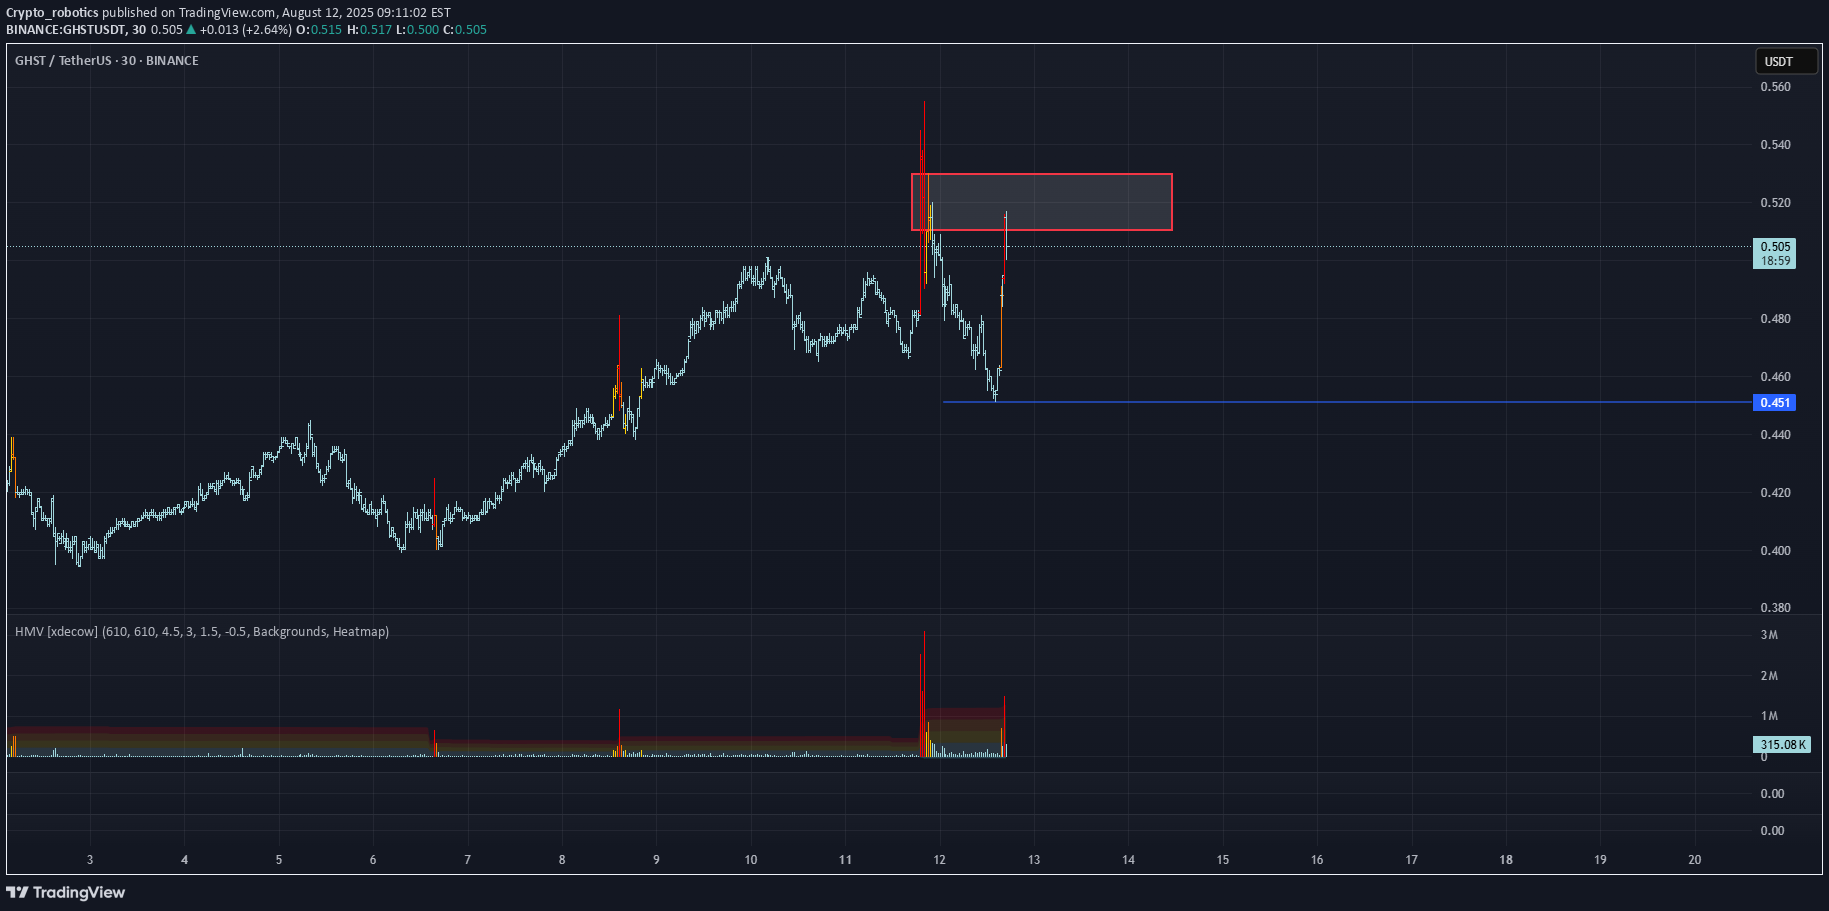
On the hourly chart, we can see a clear break in trend to the downside. At the moment, the price has reached a key volume zone at $0.51–$0.53, showing volume divergence. We are considering a short position with potential to retest and break the local low at $0.45. This publication is not financial advice.

Jawad_Crypto
GHSTUSDT
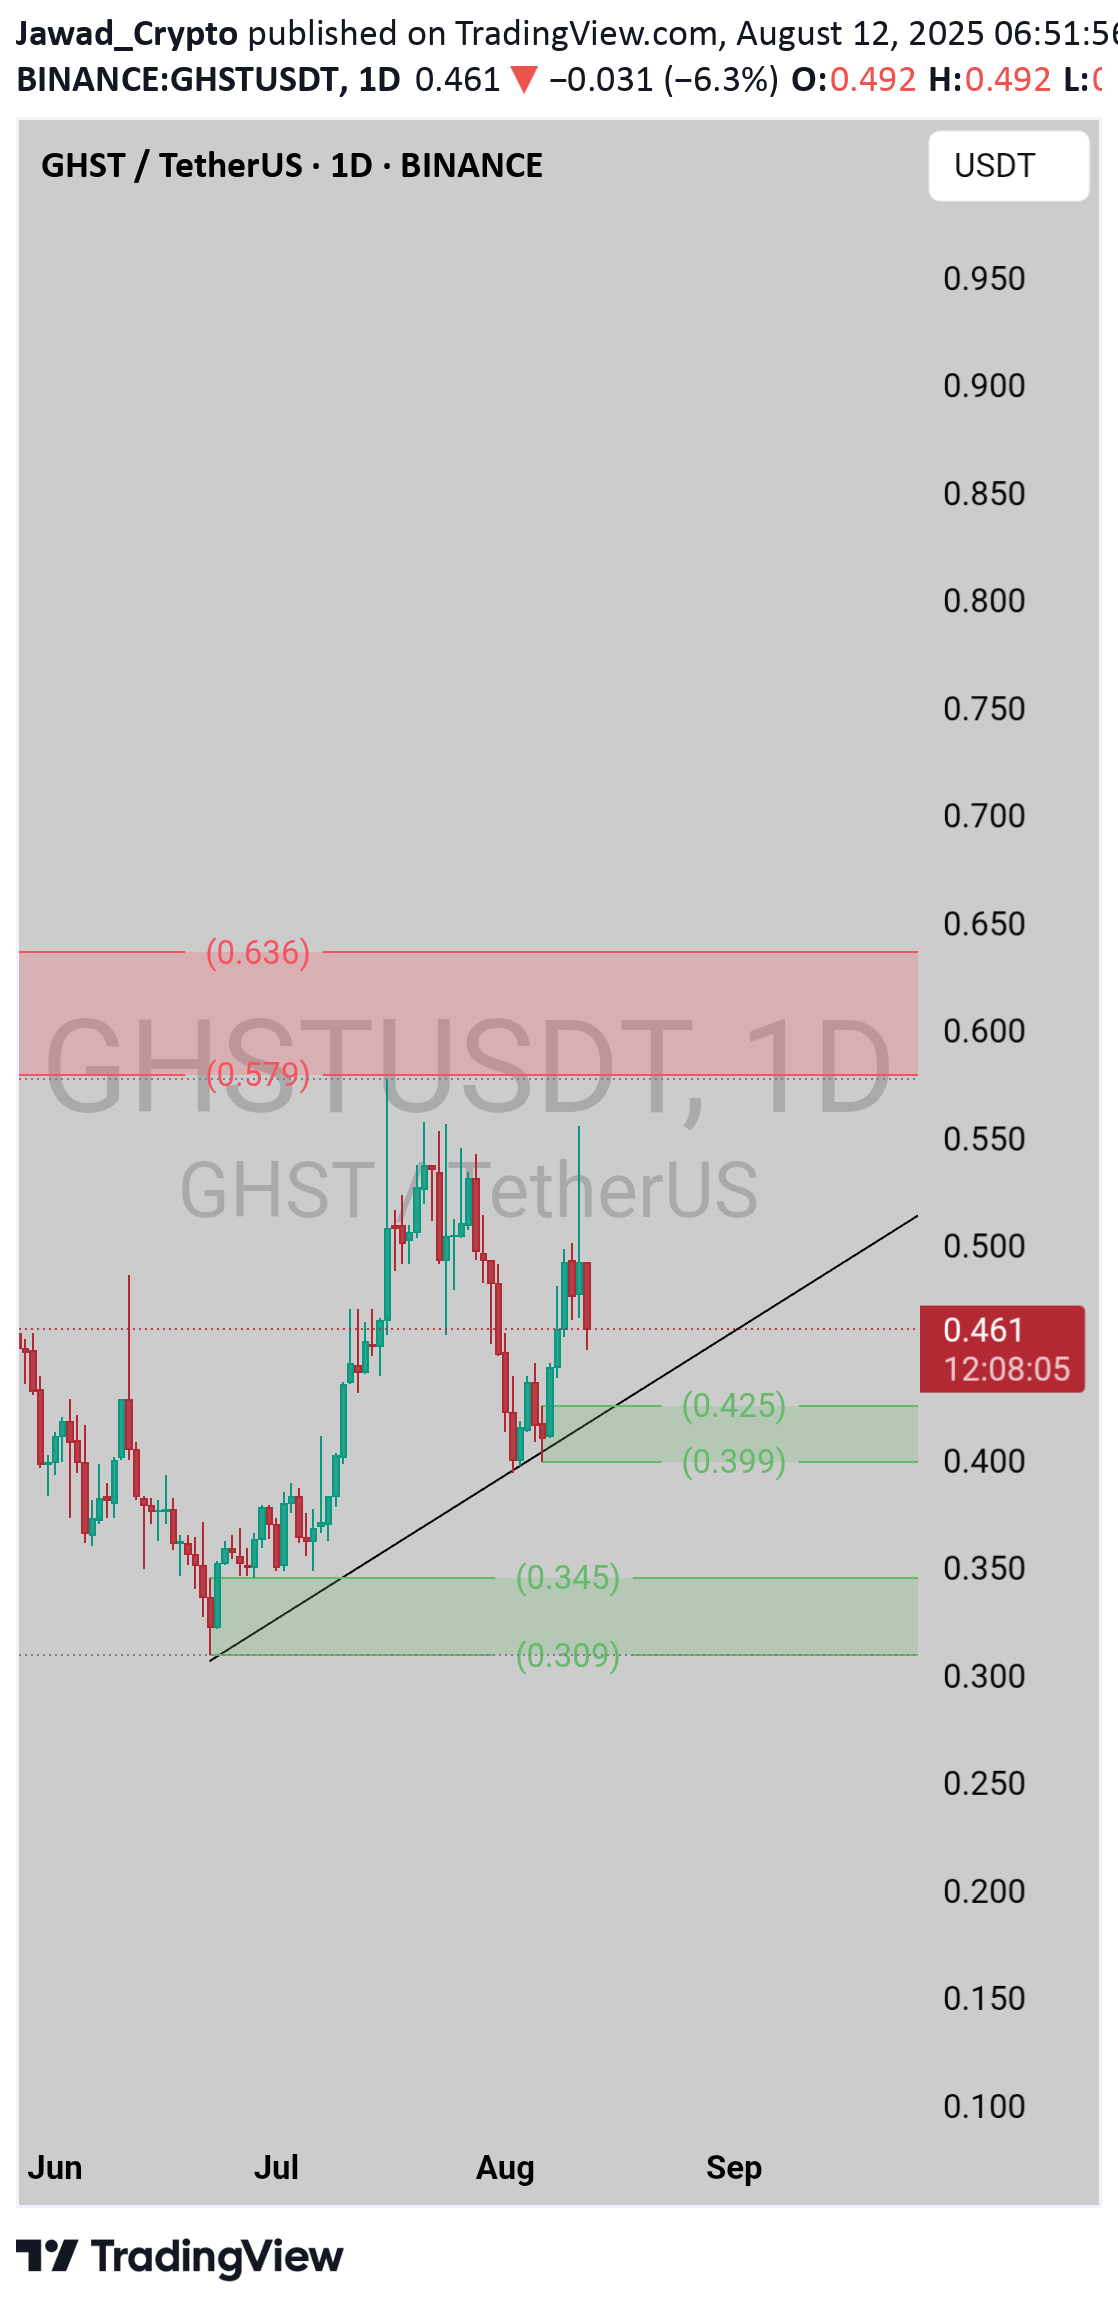
If its breakdown the uppertrend not good We have 2 supply zones below this trend. Maybe bounce happen from this 2 zones.

AltcoinPiooners
GHST Bullish Divergence

GHSTUSDT Trade Setup: Target 1: 0.455 (0.786 Fibonnaci Golden Zone). Target 2: 0.481 (0.618 Fibonnaci Golden Zone). Target 3: 0.500 (0.786 Fibonnaci Golden Zone). Target 4: 0.578 (0 Fibonnaci). Stop Loss: 0.379 (1.272 Fibonnaci). RSI Analysis: The RSI is showing a bullish divergence, suggesting potential bullish momentum. The current RSI is around 21.88, approaching oversold territory, so caution is advised.+5.77% PROFITTP 1 & 2 & 3 FILLED +31.91% PROFIT

Dexter_The_Trader
GHST Trade Setup
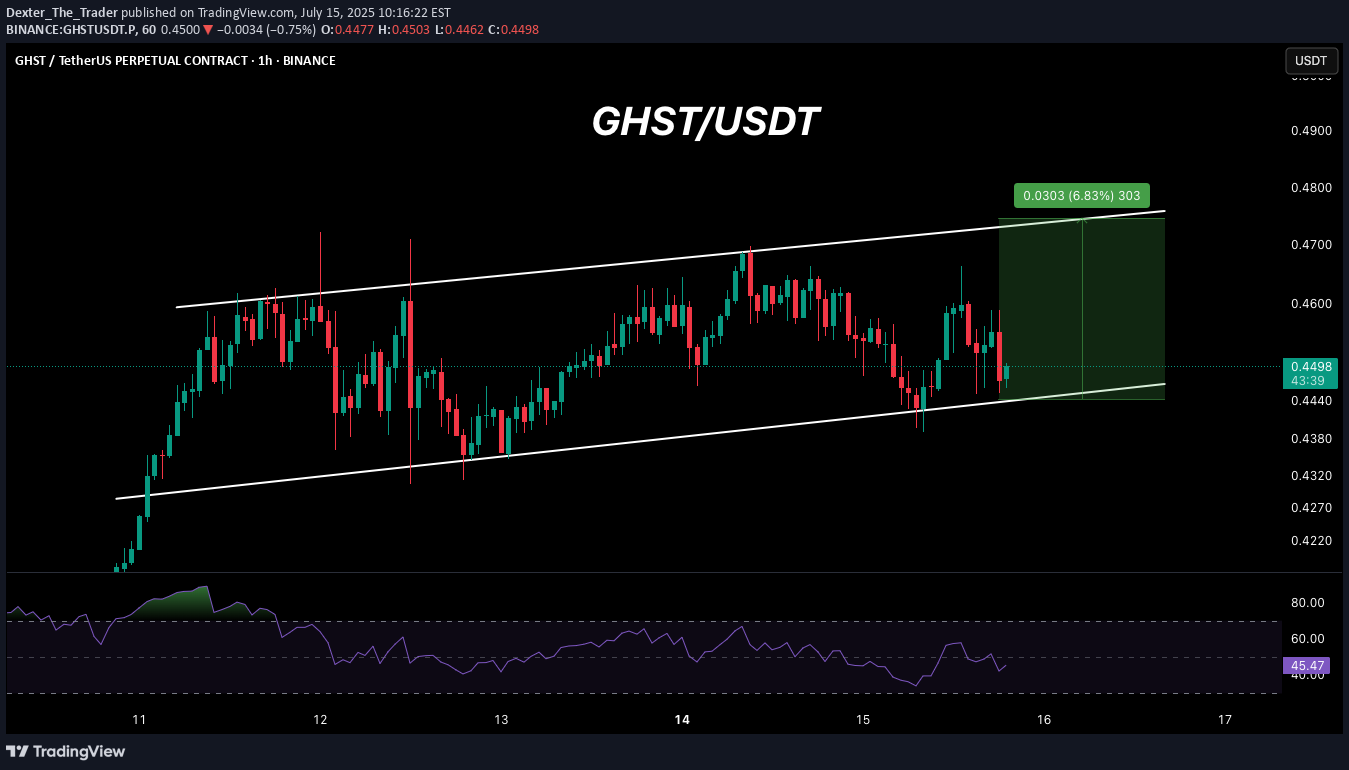
Long GHST/USDT ~Entry: $0.45-$0.4446 ~Leverage: Cross (10X) ~Targets: 1) $0.4610 2) $0.4660 3) $0.4773 4) $0.4864 5) $0.4980+ ~Stoploss: $0.4311

Captain-MAO
GHST/USDT +100%
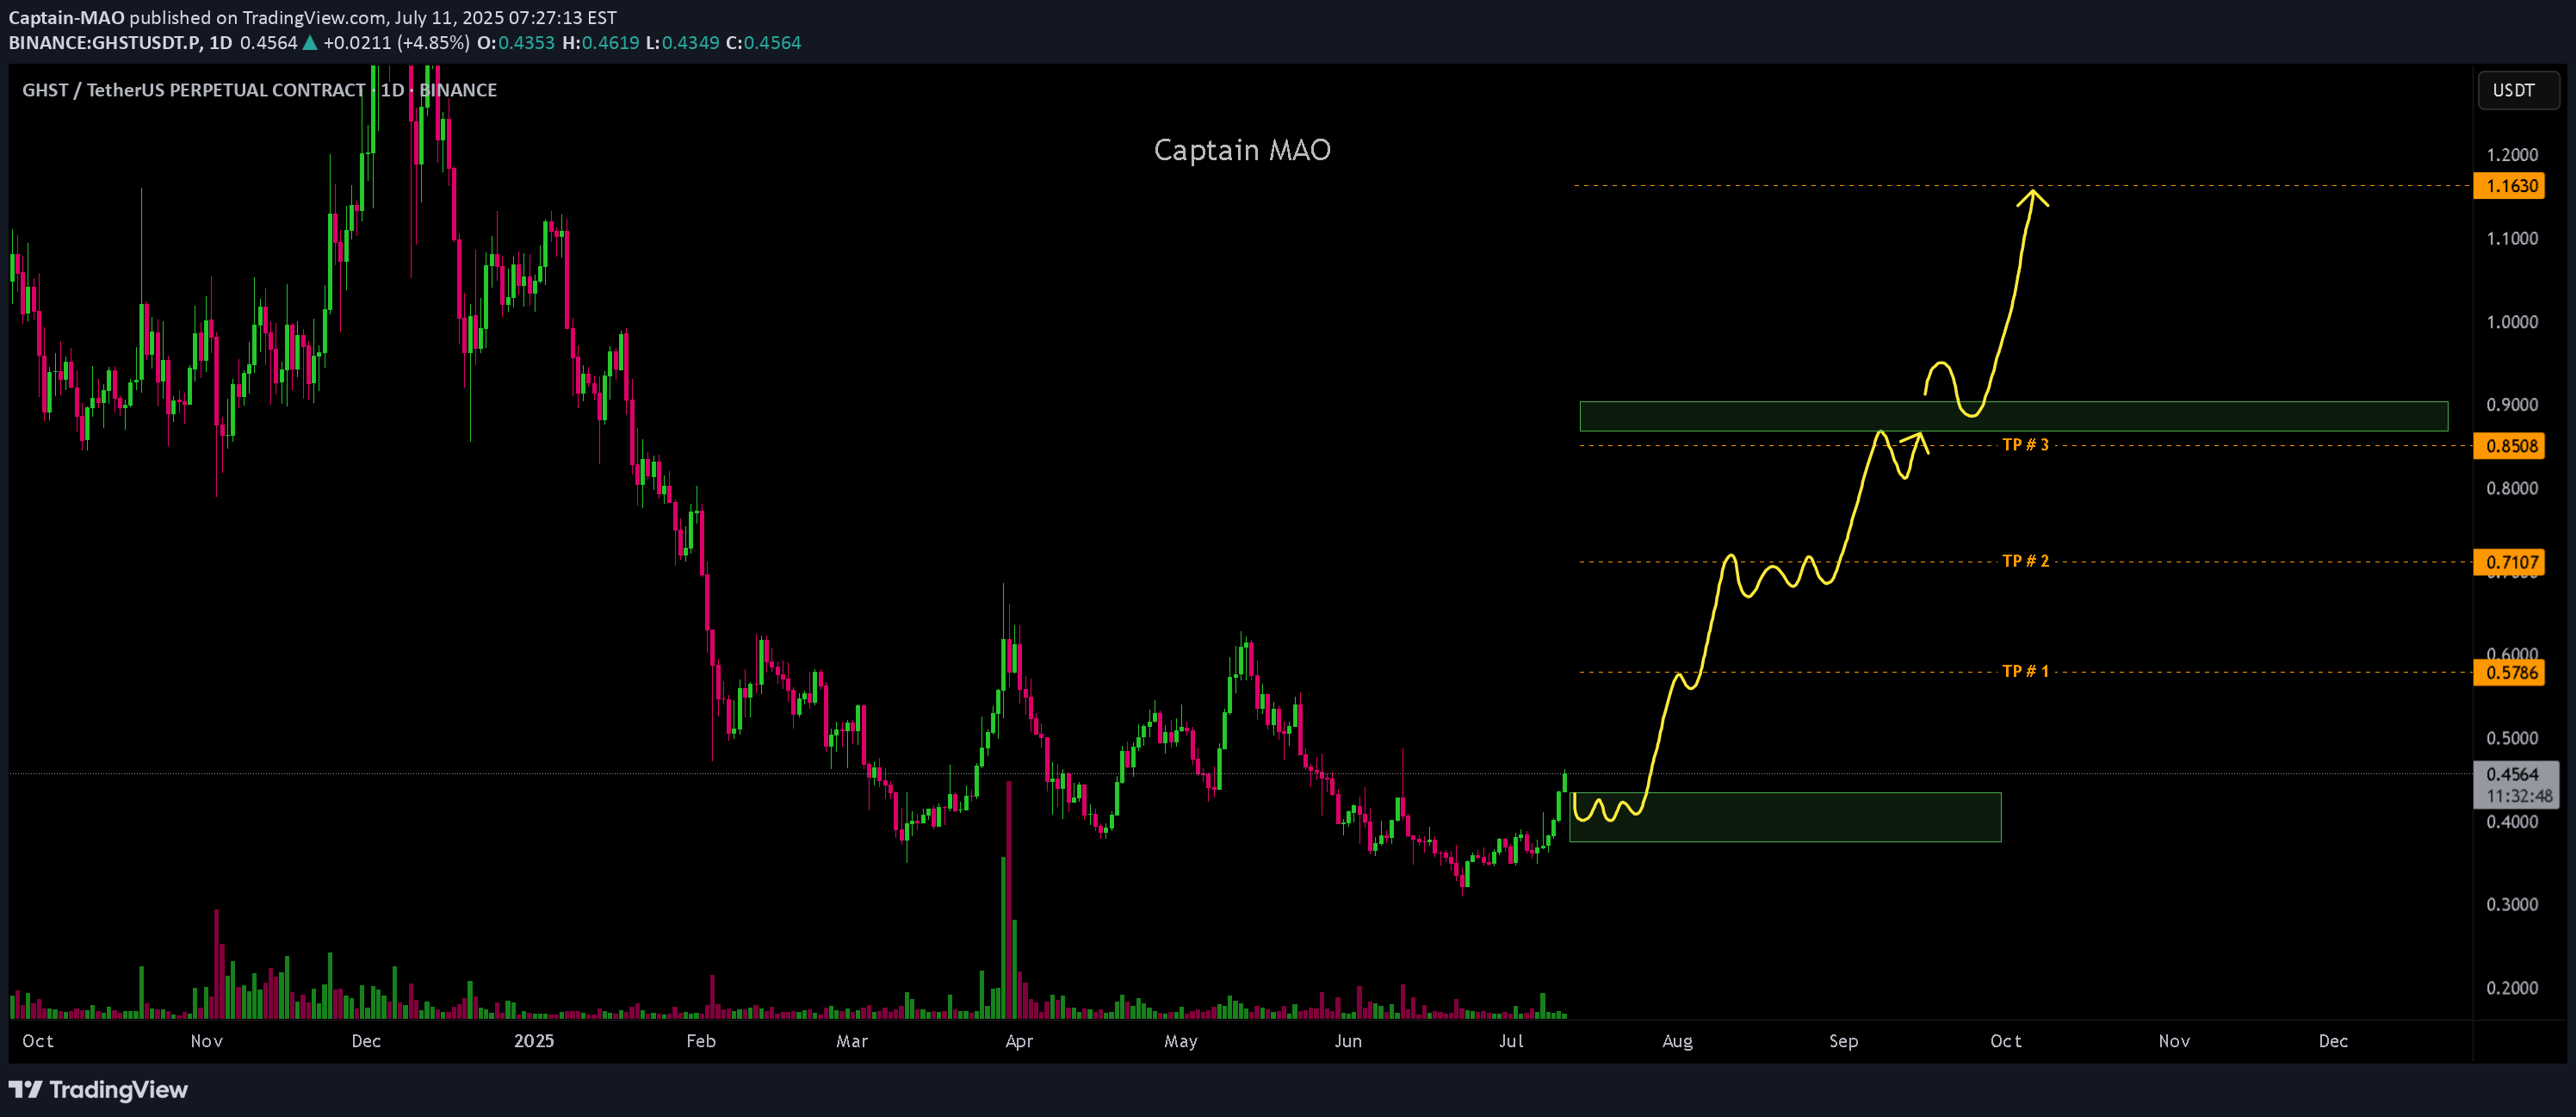
GHST/USDT is looking strong on the daily time frame after successfully reclaiming the key $0.39 zone a major structural level. This reclaim signals a clear shift in momentum, with strong buyer interest stepping in to support the move. The price structure is showing early signs of a bullish reversal with clean higher lows and increasing volume. If the market provides a pullback into the green demand box (between $0.42–$0.38), it would be a prime opportunity to start a DCA .

fibonacci6180
GHST Stock Chart Fibonacci Analysis 051825

Trading Idea1) Find a FIBO slingshot2) Check FIBO 61.80% level3) Entry Point > 0.5/61.80%Chart time frame: CA) 15 min(1W-3M) B) 1 hr(3M-6M)C) 4 hr(6M-1year) D) 1 day(1-3years)Stock progress: AA) Keep rising over 61.80% resistanceB) 61.80% resistanceC) 61.80% supportD) Hit the bottomE) Hit the topStocks rise as they rise from support and fall from resistance. Our goal is to find a low support point and enter. It can be referred to as buying at the pullback point. The pullback point can be found with a Fibonacci extension of 61.80%. This is a step to find entry level. 1) Find a triangle (Fibonacci Speed Fan Line) that connects the high (resistance) and low (support) points of the stock in progress, where it is continuously expressed as a Slingshot, 2) and create a Fibonacci extension level for the first rising wave from the start point of slingshot pattern. When the current price goes over 61.80% level , that can be a good entry point, especially if the SMA 100 and 200 curves are gathered together at 61.80%, it is a very good entry point.As a great help, tradingview provides these Fibonacci speed fan lines and extension levels with ease. So if you use the Fibonacci fan line, the extension level, and the SMA 100/200 curve well, you can find an entry point for the stock market. At least you have to enter at this low point to avoid trading failure, and if you are skilled at entering this low point, with fibonacci6180 technique, your reading skill to chart will be greatly improved.If you want to do day trading, please set the time frame to 5 minutes or 15 minutes, and you will see many of the low point of rising stocks.If want to prefer long term range trading, you can set the time frame to 1 hr or 1 day.
Disclaimer
Any content and materials included in Sahmeto's website and official communication channels are a compilation of personal opinions and analyses and are not binding. They do not constitute any recommendation for buying, selling, entering or exiting the stock market and cryptocurrency market. Also, all news and analyses included in the website and channels are merely republished information from official and unofficial domestic and foreign sources, and it is obvious that users of the said content are responsible for following up and ensuring the authenticity and accuracy of the materials. Therefore, while disclaiming responsibility, it is declared that the responsibility for any decision-making, action, and potential profit and loss in the capital market and cryptocurrency market lies with the trader.