
Dexter_The_Trader
@t_Dexter_The_Trader

What symbols does the trader recommend buying?
Purchase History
پیام های تریدر
Filter
Dexter_The_Trader
GHST Trade Setup
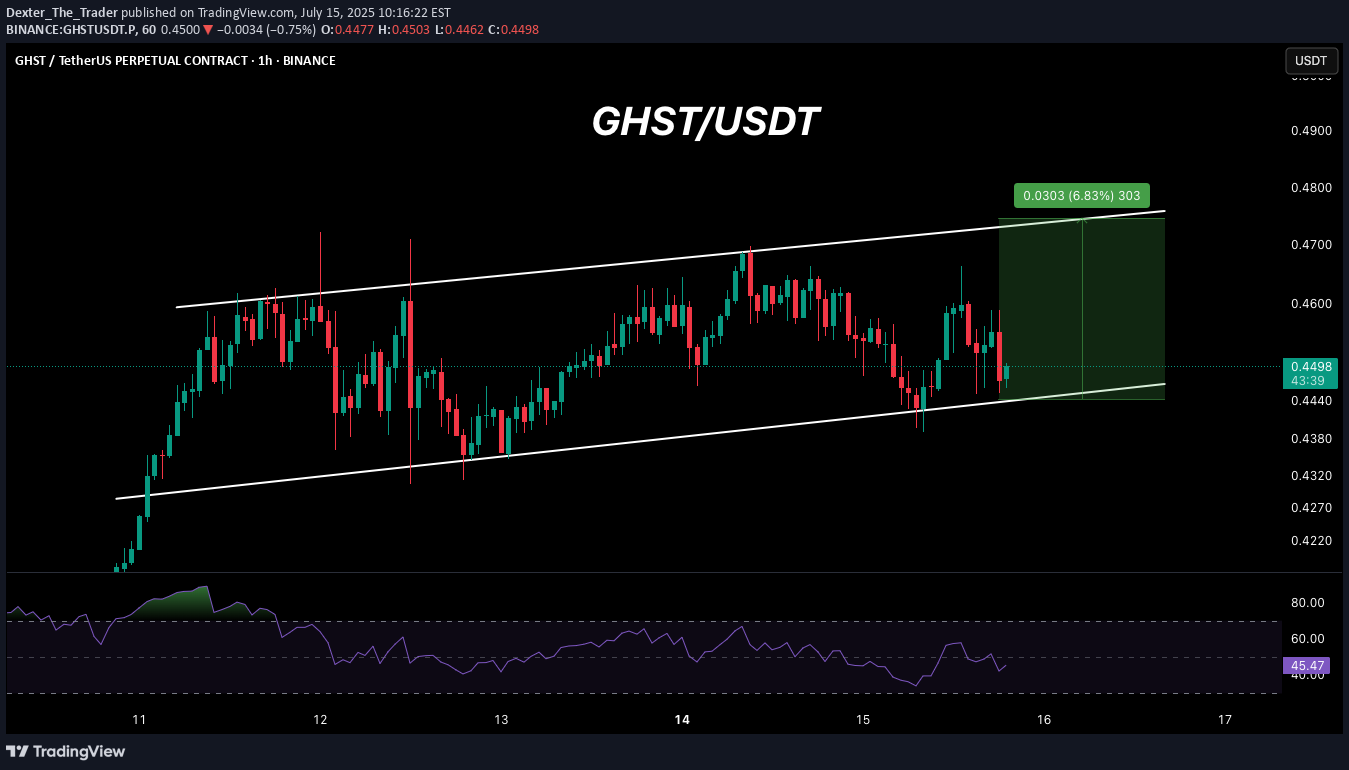
Long GHST/USDT ~Entry: $0.45-$0.4446 ~Leverage: Cross (10X) ~Targets: 1) $0.4610 2) $0.4660 3) $0.4773 4) $0.4864 5) $0.4980+ ~Stoploss: $0.4311
Dexter_The_Trader
BITCOIN: Correction Incoming!
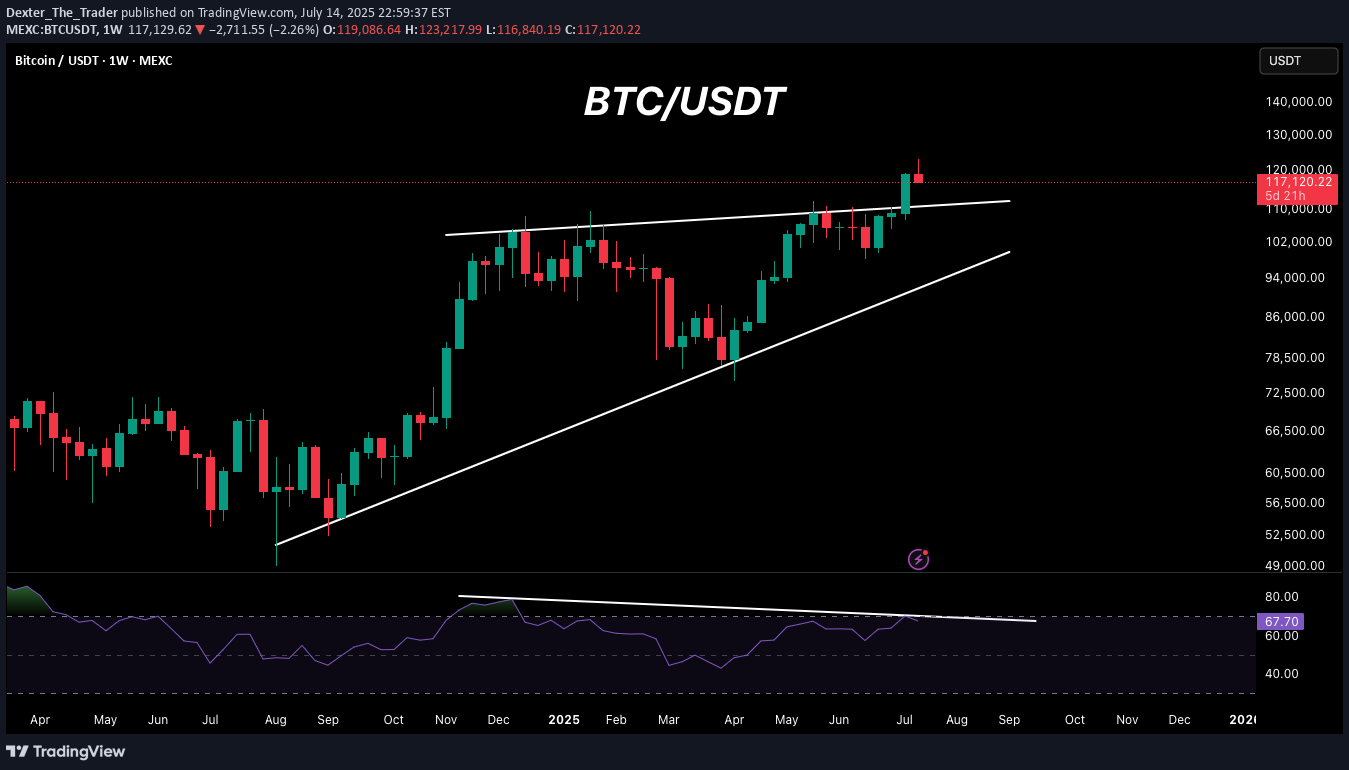
Hello Traders, Important Update on BTC I’ll keep it simple — BTC has reached a new all-time high of $123K and is now showing signs of a possible correction. The RSI is forming a bearish divergence on the weekly timeframe. The first support level to watch is $110K. If BTC breaks below that, we could potentially see a drop toward $94K. In the long run, my target remains $140K, but for now, a correction seems likely. Note: Trade safely, and always do your own research and analysis.
Dexter_The_Trader
MBOX Broke above the Resistance!
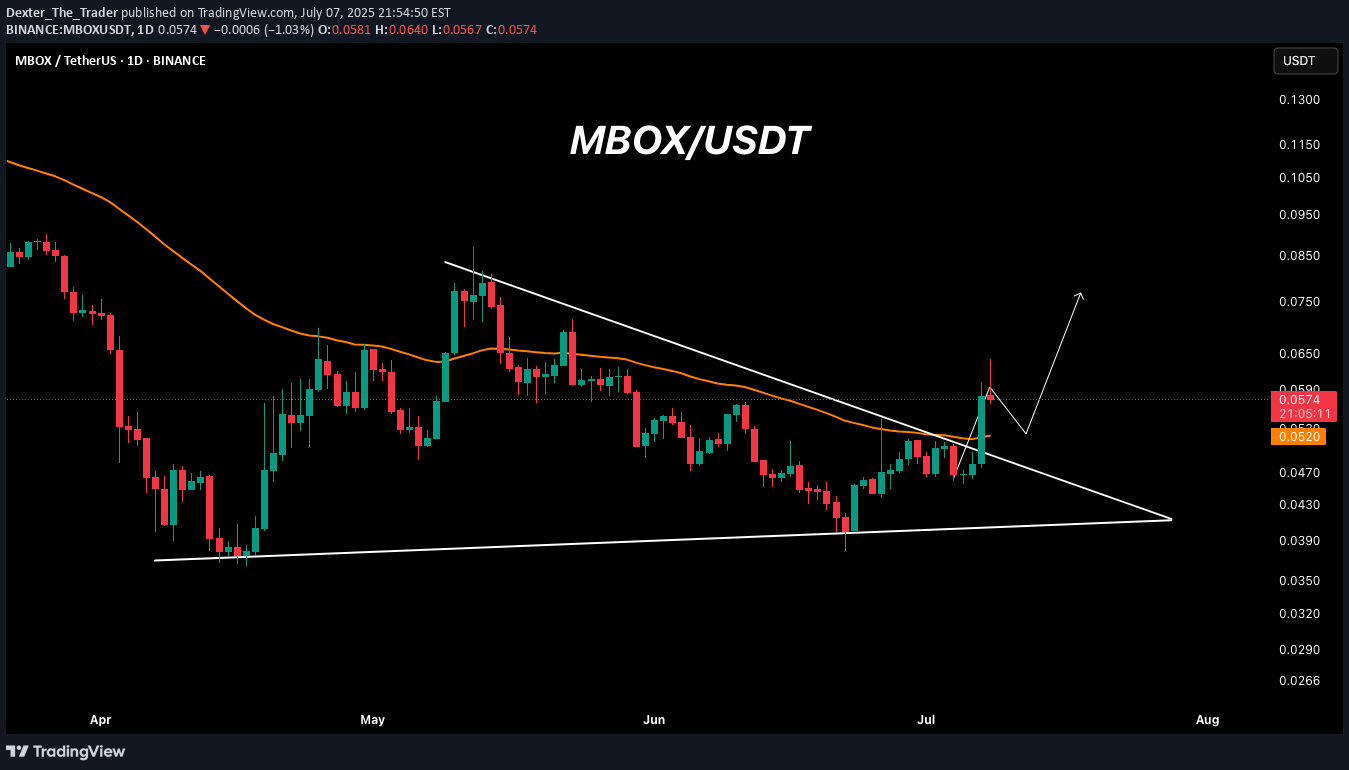
MBOX Price Analysis – Daily TimeframeHello Traders,Today, let's analyze MBOX on the daily timeframe.MBOX has broken above both the resistance trendline and the 50 EMA. This breakout looks promising, and based on the current price action, we may see a retest toward the 50 EMA, followed by a potential rebound.Strategy:~ A good entry would be between $0.05 and $0.055~ Target: $0.075 – $0.082~ Trade Type: Spot / 3x LeveragePlease Note: Always conduct your own research and analysis before investing.Regards,Team Dexter
Dexter_The_Trader
TON Analysis on a Weekly Chart.
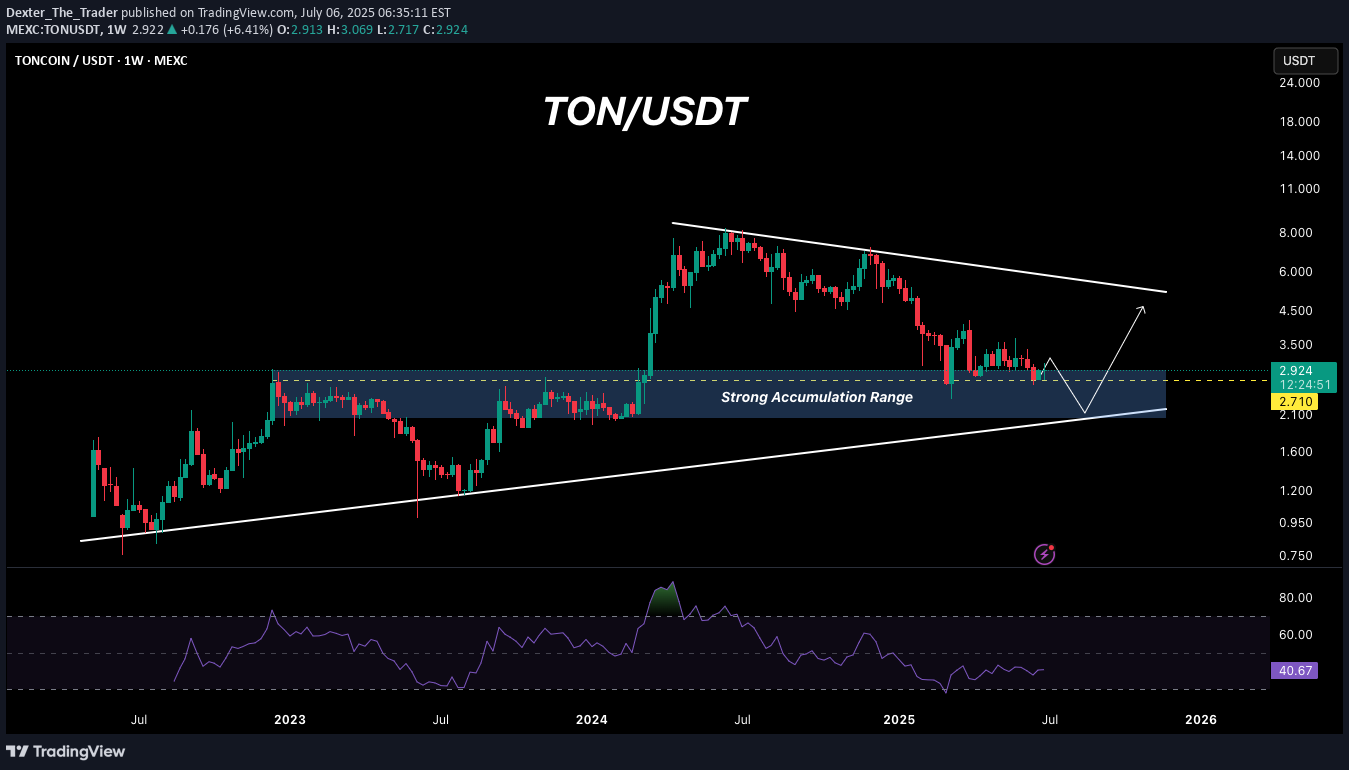
TON Price UpdateHello Traders,TON is currently in a downtrend and is approaching its support zone. The range between $2 and $3 presents a good accumulation opportunity, as both the horizontal support and the support trendline align within this area. The RSI is showing positive signs and may soon form a bullish divergence, indicating a potential shift in momentum.Strategy:~ Accumulate/DCA: $2 – $3~ Target: $6 – $8~ Invalidation: Weekly close below $2~ Trade Type: SpotNote: It is advisable to conduct your own research and analysis before investing.
Dexter_The_Trader
Will SUI show further correction?
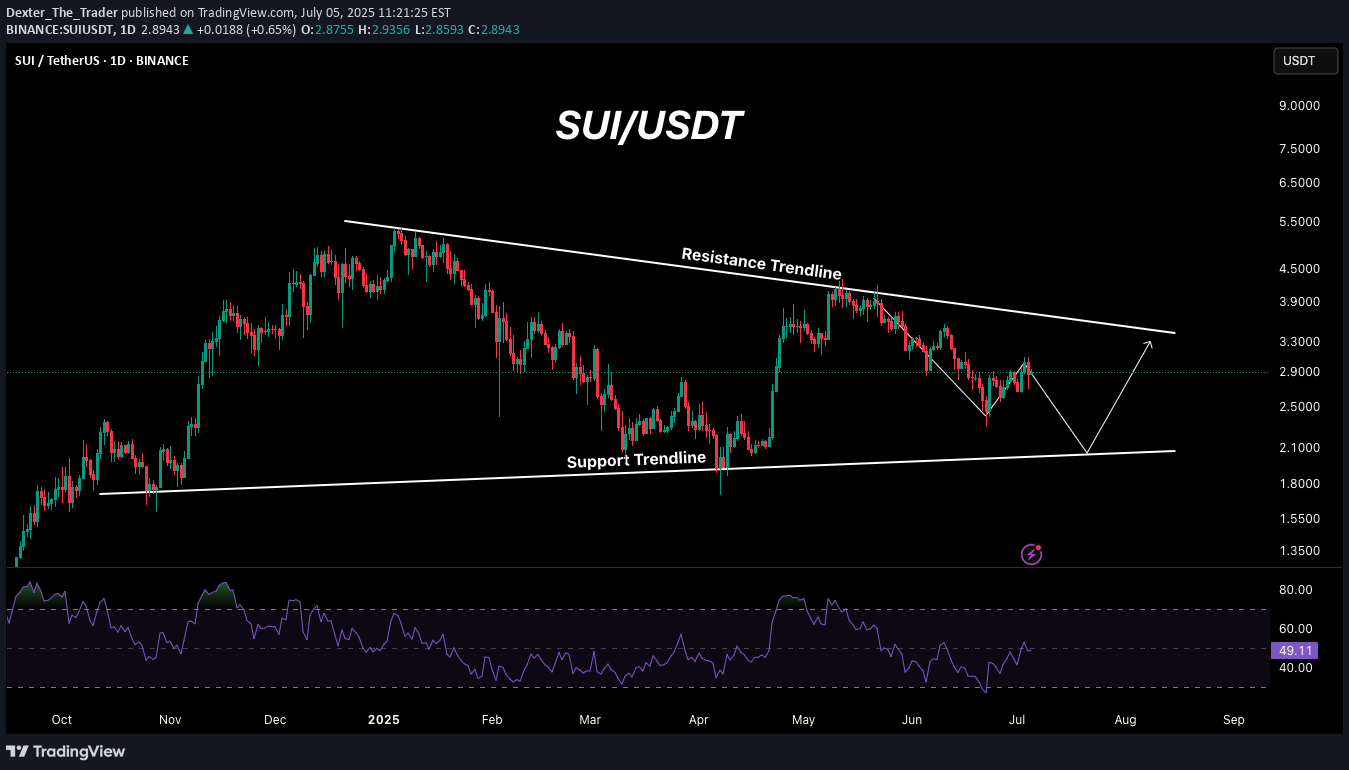
SUI Price UpdateSUI has been in a downtrend since May 2025 and appears to have more room for correction. It is likely to drop to around $2, so exercise caution with any long trades. If it does reach that level, it could present a good opportunity for accumulation.Strategy:~ Accumulation Range: $2 to $2.2~ Target: $4 – $5~ Trade Type: SpotNote: Always do your own research and analysis before investing.
Dexter_The_Trader
DOGE Update

DOGE Price UpdateDOGE is currently forming a symmetrical triangle pattern, holding above the support line. An upward rally is likely, but for a bullish confirmation, DOGE must break above the resistance trendline on the daily timeframe.Strategy:~ Entry / Accumulation: $0.144 to CMP~ Invalidation: Daily candle close below the support line ($0.144)~ Target: $0.30 – $0.50Note: Don’t rush into the entry. Always conduct your own thorough research and analysis before investing.Regards,Dexter
Dexter_The_Trader
BANANA: Likely to rally soon!

BANANA has recently rebounded from its support level and may continue its rally if the momentum holds. Strategy: ~ Entry / Accumulation: $13.7 to $15.5 ~ Target: $25 ~ Trade Type: Spot ~ Invalidation: A daily candle close below $13 DYORBANANA Profit Update: BANANA has hit our target. Congratulations to all.
Dexter_The_Trader
LINK: Anxiously waiting for a breakout!

Chainlink (LINK) UpdateChainlink is currently forming a symmetrical triangle pattern and is shouting for a potential breakout from its resistance. The momentum on LINK has been solid, indicating good potential for continued bullish movement in the days ahead.However, if LINK breaks down below the support line, the bullish outlook will be invalidated.As of now, I’m targeting $17 to $20 if a breakout occurs.Trade safely, and always do your own research and analysis before investing.
Dexter_The_Trader
JASMY: Holds Potential for a 500% Rally!

JASMY UpdateJASMY is currently holding at the support level and is gradually moving upward, indicating a potential bullish trend. With the RSI steadily gaining momentum, there's a possibility of JASMY reaching gains of 400%–500% by Q4.Strategy:~ Accumulation Range: $0.009 to Current Market Price (CMP)~ Trade Type: Spot~ Holding Period: Q4 2025Note: Always conduct your own analysis before investing.Regards,Dexter
Dexter_The_Trader
ETH Update: A Possible Rebound!
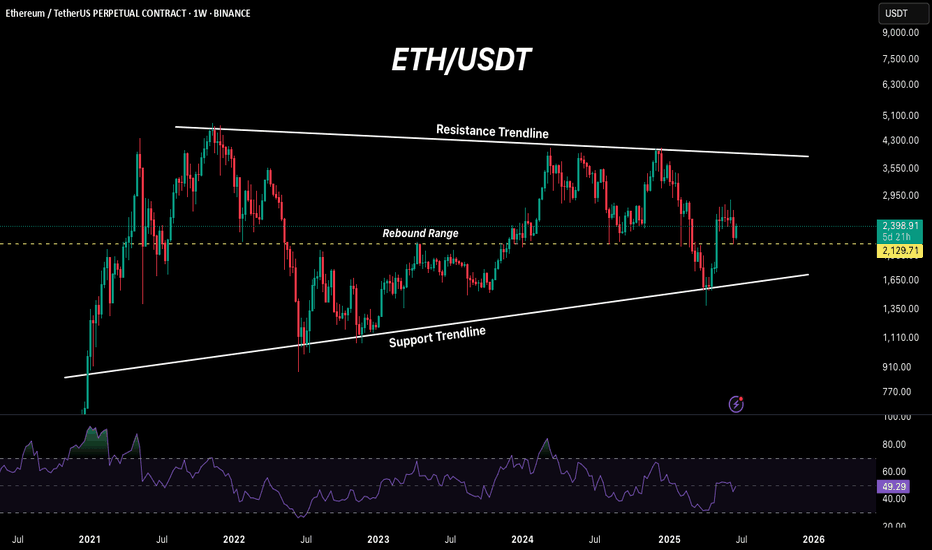
ETH Weekly UpdateETH has formed a support trendline in the $1500–$1600 range and previously rebounded from it with a 90% gain. After a retest, it’s once again showing signs of a potential rebound from the $2100 level.If this rebound holds, it could bring relief to price momentum, and we may see ETH retesting the $3500 zone. The RSI still has plenty of room to expand, suggesting further bullish potential.Strategy:~ Entry: $2100 to Current Market Price (CMP)~ Accumulation Range: $1500–$1600~ Trade Type: Spot~ Holding Period: Q4 2025~ Target: $3500Note: Always do your own research and analysis before making any decisions. This is not financial advice.Regards,Dexter
Disclaimer
Any content and materials included in Sahmeto's website and official communication channels are a compilation of personal opinions and analyses and are not binding. They do not constitute any recommendation for buying, selling, entering or exiting the stock market and cryptocurrency market. Also, all news and analyses included in the website and channels are merely republished information from official and unofficial domestic and foreign sources, and it is obvious that users of the said content are responsible for following up and ensuring the authenticity and accuracy of the materials. Therefore, while disclaiming responsibility, it is declared that the responsibility for any decision-making, action, and potential profit and loss in the capital market and cryptocurrency market lies with the trader.