
Crypto_robotics
@t_Crypto_robotics

What symbols does the trader recommend buying?
Purchase History
پیام های تریدر
Filter
Crypto_robotics
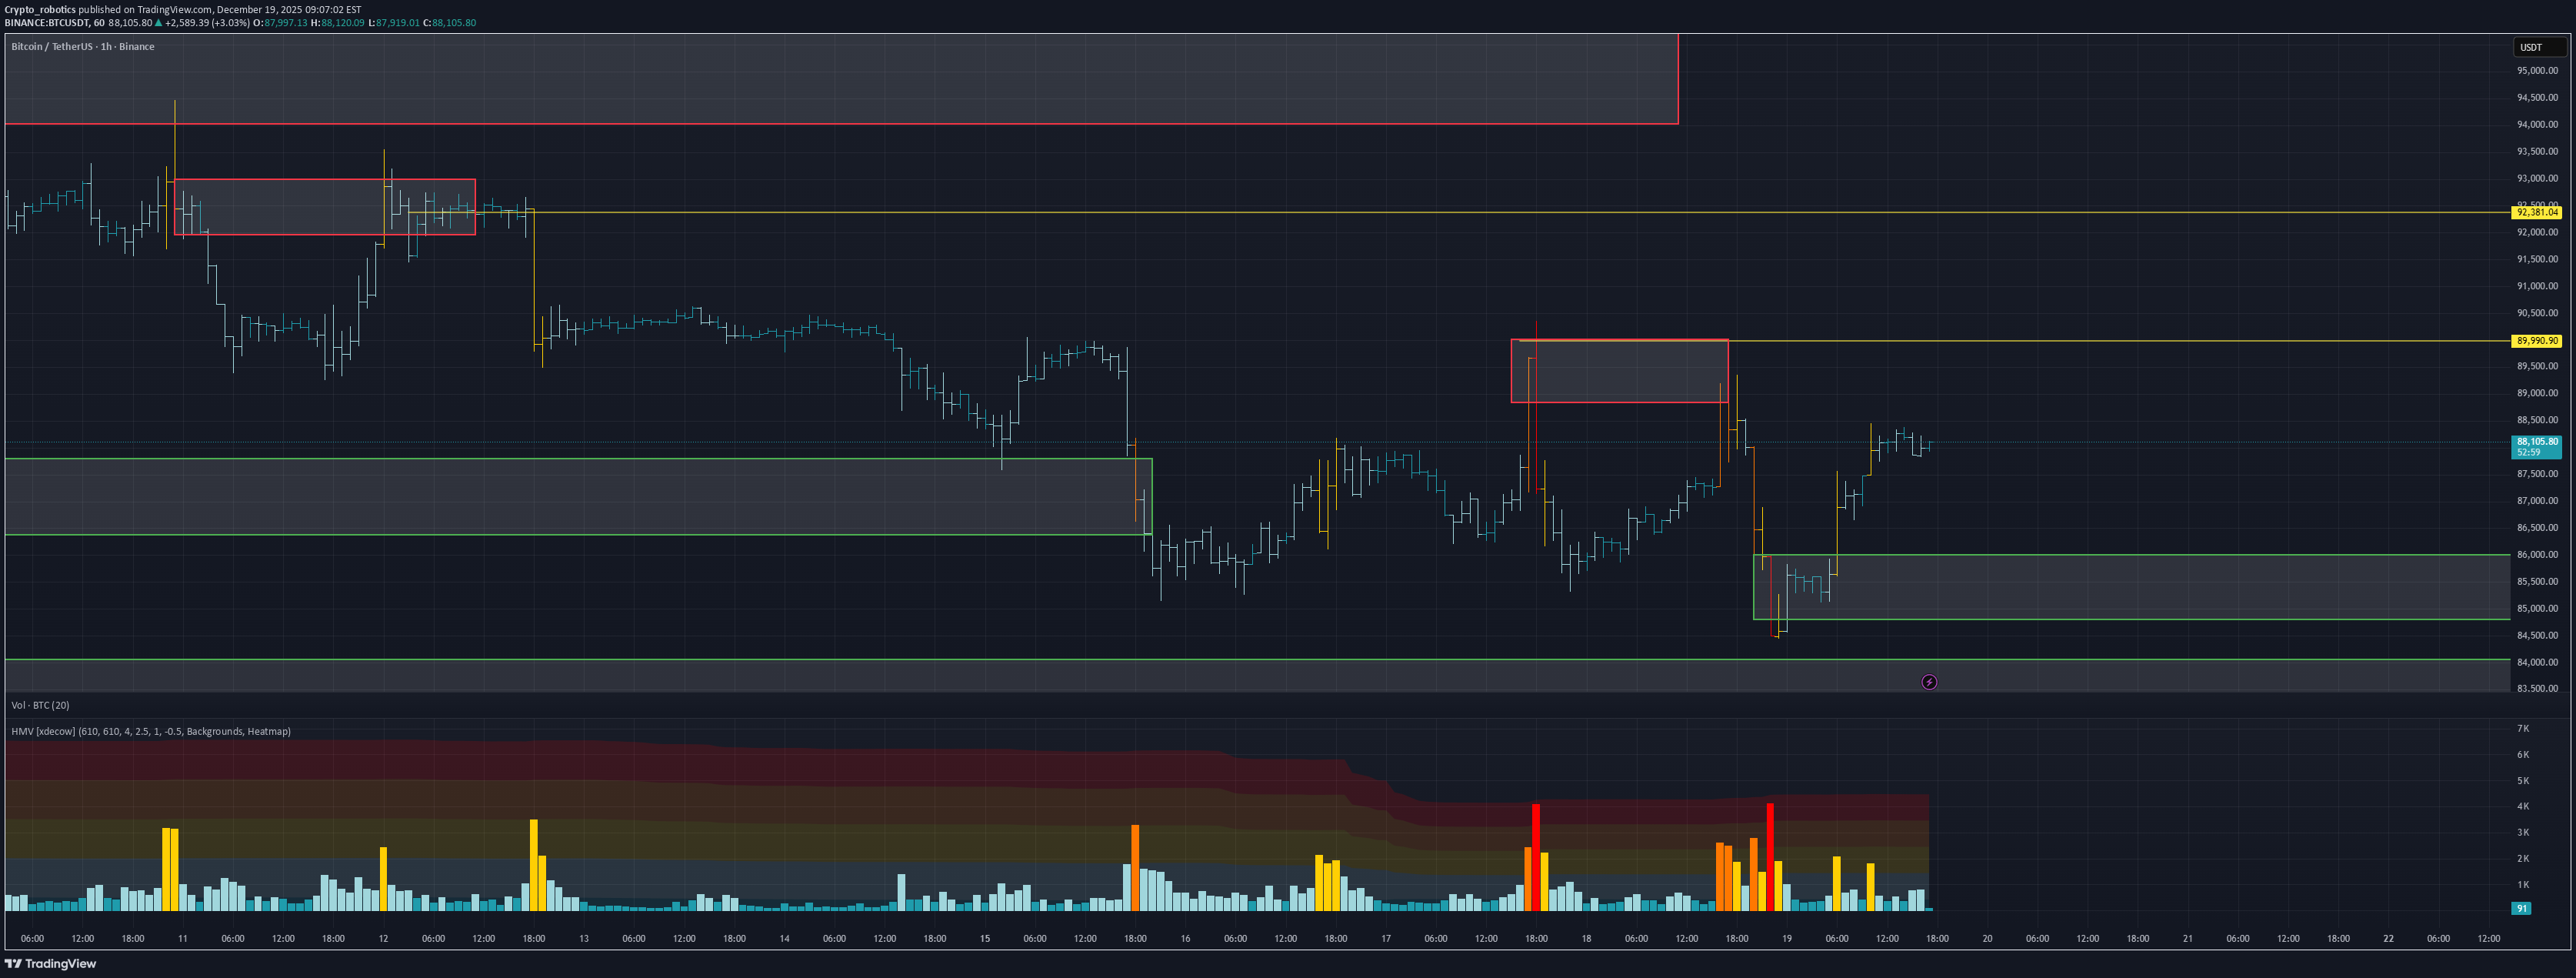
BTC/USDT Analysis. Return to a Range-Bound Structure

Hello everyone! This is CryptoRobotics trader-analyst, and here is the daily analysis. Yesterday, we closely monitored the reaction around the mirror buy zone $89,400–$88,800, but the expected support failed to appear. This invalidated the short-term scenario of a move toward the upper boundary of the range. After breaking below that support, price returned into the sideways structure and reacted from a stronger zone at $87,200–$86,800 (anomalous activity). At the moment, we observe absorption of selling pressure on the delta, indicating local demand. The current potential is directed toward the upper boundary of the range. Resistance is now defined by a broader zone $89,500–$90,300, rather than the single $90,000 level as before. The primary scenario for the coming week remains rotation between major volume zones. The breakout potential is still considered to the upside. Even if the range expands downward, we maintain a bullish bias and will look for long opportunities from lower volume areas. Buy zones $86,000–$84,800 (anomalous activity) $84,000–$82,000 (strong volume anomalies) Sell zones $89,500–$90,300 (anomalous activity) ~$92,400 (local zone) $94,000–$97,500 (volume zone) $101,000–$104,000 (accumulated volume) This publication is not financial advice.
Crypto_robotics
تحلیل بیت کوین: مسیر صعودی یا ریزش؟ پیشبینی دقیق سطوح قیمتی ۹۰,۰۰۰ دلار

WHAT HAPPENED? Bitcoin has spent the past week in a sideways trend. There was no expansion in any direction, no more global zones were reached, but new ones were formed. When trying to update the local minimum, we got a fairly strong deviation on the cluster graph. This triggered a rebound and an impulsive movement to the upper limit of the range. Now we have tested the local $90,000 zone again, where protection is being formed not for the first time — another deviation in the cluster schedule is observed. WHAT WILL HAPPEN: OR NOT? As part of the current correction, special attention should be paid to the $89,400-$88,800 zone. This area previously acted as a resistance formed on December 26, and was impulsively broken through. When we return to it, we can get a reaction and try to break through the $90,000 level for the fourth time. If successful, the accumulated liquidity should be enough to develop a movement towards a more global sideways boundary around $94,600. In the absence of a reaction, the local sideways trend may persist, and the range expansion will be implemented in a downward direction. Moreover, there are a sufficient number of zones below that can temporarily hold the price. Buy zones $89,400–$88,800 (mirror volume zone) $87,200–$86,800 (anomalous activity) $86,000–$84,800 (anomalous activity) $84,000–$82,000 (strong volume anomalies) Sell zones $90,000 (local zone) ~$92,400 (local zone) $94,000–$97,500 (volume zone) $101,000–$104,000 (accumulated volume) IMPORTANT DATES The holidays are continuing, so there are still not many macroeconomic events: • Tuesday, December 30, 19:00 (UTC) — publication of the US FOMC minutes; • Wednesday, December 31, 1:30 (UTC) — publication of the index of business activity in the Chinese manufacturing sector for December; • Wednesday, December 31, 13:30 (UTC) — publication of the number of initial applications for US unemployment benefits; • Friday, January 2, 14:45 (UTC) — publication of the index of business activity in the US manufacturing sector for December. *This post is not financial recommendation. Make decisions based on your own experience. #analytics
Crypto_robotics
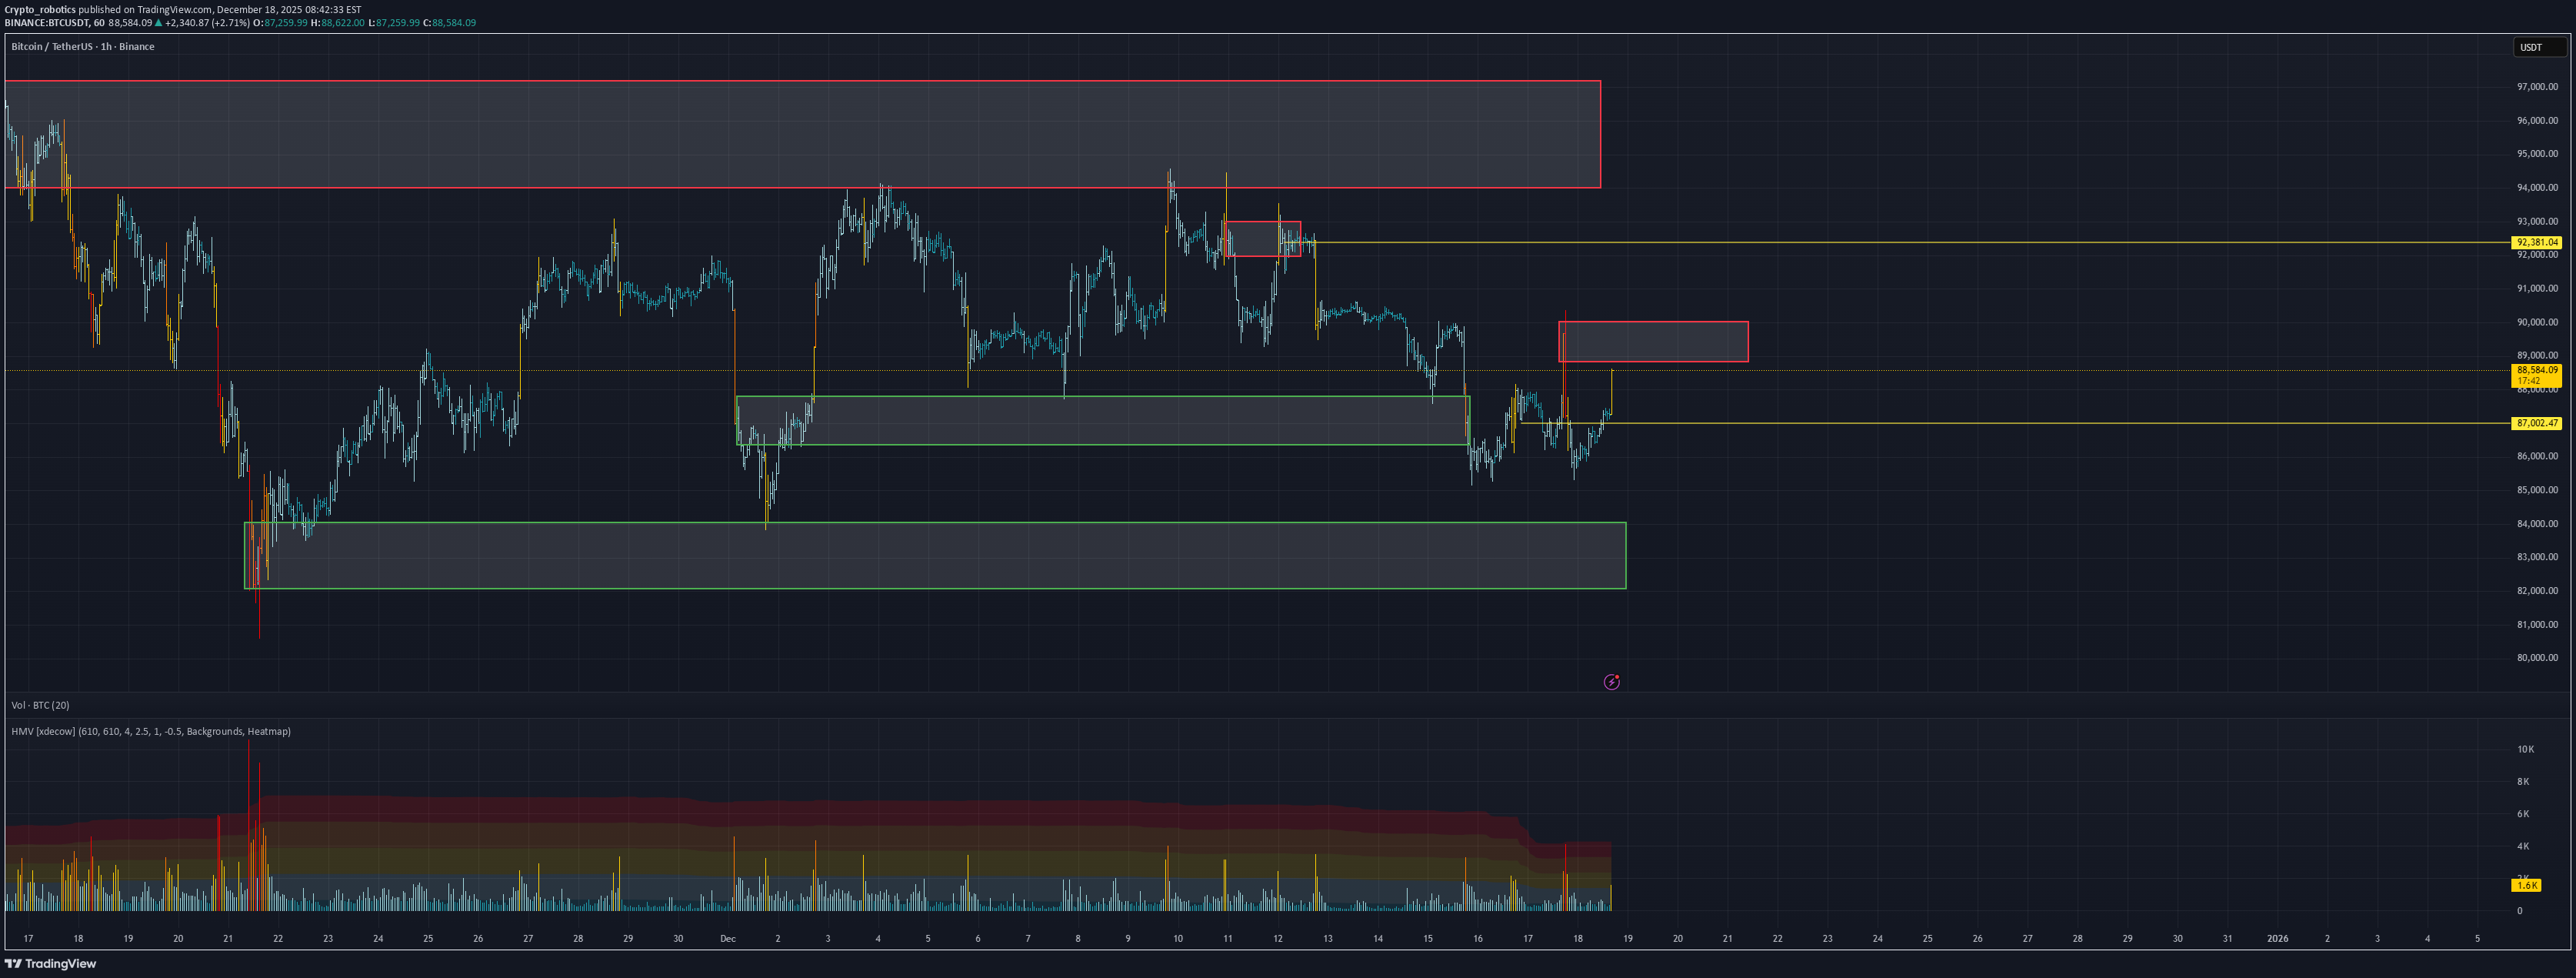
BTC/USDT Analysis. Signs of Activity

Hello everyone! This is the CryptoRobotics trader-analyst with a daily market update. Yesterday, Bitcoin tested the technical level at $88,400, where another wave of selling emerged. However, the decline did not develop further — selling pressure was absorbed by relatively strong buying activity. At the moment, price is attempting to consolidate above this level. From a chart perspective, buyer momentum looks solid, but cluster analysis shows that the majority of volume is concentrated higher, within the $88,800–$89,300 range. The key focus now is how this volume zone will be realized. If the price fails to break through and sellers show active defense, a continuation of the decline toward the nearest strong support becomes likely. If sellers remain inactive and the $88,800–$89,300 zone is broken, we expect a test of $90,000. In that case, pullbacks toward the now-mirrored support at $89,300–$88,800 can be considered for long positions. Buy zones $86,000–$84,800 — anomalous activity $84,000–$82,000 — volume anomalies Sell zones $90,000 — local resistance ~$92,400 — local sell zone $94,000–$97,500 — volume zone $101,000–$104,000 — accumulated volume This publication is not financial advice.
Crypto_robotics
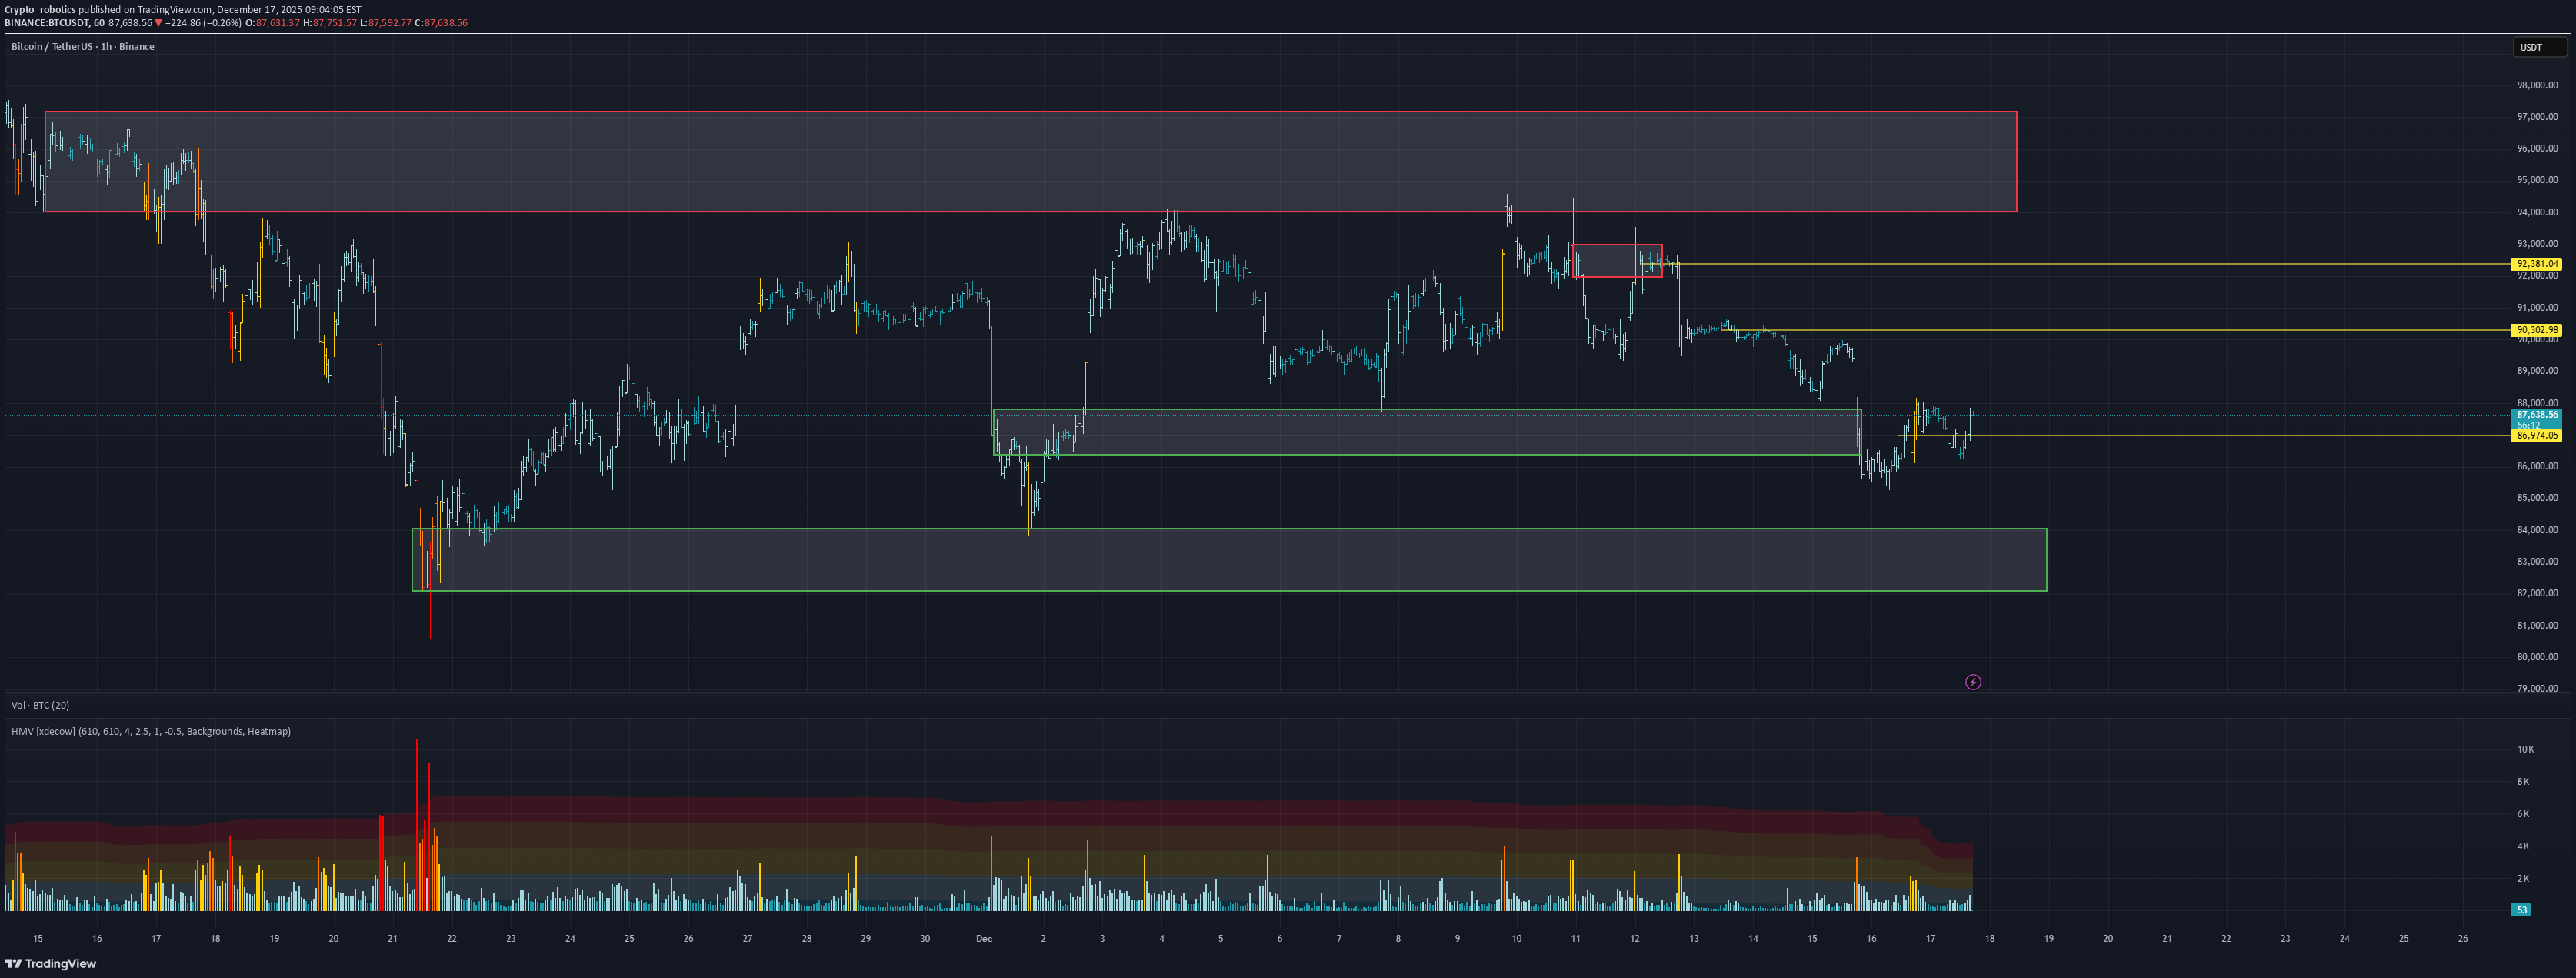
BTC/USDT Analysis. No Santa Rally This Time?

Hello everyone! This is the CryptoRobotics trader-analyst with a daily market update. Yesterday, Bitcoin once again set a local low and then returned to its previous range. However, no significant cluster anomalies or signs of strong defense were detected. Price action remains largely inertial, with no clear dominance from either buyers or sellers. In the short term, we allow for an upward range expansion and a potential test of the $88,400 technical level. That said, opening long positions from current levels looks questionable due to the lack of a confirmed bullish impulse. Our core scenario remains unchanged: we will consider long positions either after a test of more significant support levels below, or upon the formation of a clear and validated setup. Buy zones $86,000–$84,800 — anomalous activity $84,000–$82,000 — volume anomalies Sell zones $90,000 — local resistance ~$92,400 — local sell zone $94,000–$97,500 — volume zone $101,000–$104,000 — accumulated volume This publication is not financial advice.
Crypto_robotics
BTC/USDT Analysis. Bitcoin Ahead of the Holiday Period

Hello everyone! CryptoRobotics trader-analyst here with your daily market analysis. Since yesterday, there have been no significant changes in Bitcoin’s price action. A move below the $88,000 area failed to trigger further selling pressure, and sell orders were absorbed instead. Volatility and trading volumes remain low, which is typical ahead of the New Year holiday period when market participation declines. At the moment, we are observing price rotation between the $86,000–$84,800 buy zone (anomalous activity) and the local sell zone around $90,000. The overall priority remains on the bullish side. We plan to consider long positions upon a retest of the support area, provided that buyer activity confirms the setup. Buy Zones $86,000–$84,800 — anomalous activity $84,000–$82,000 — volume anomalies Sell Zones $90,000 — untested volume, local resistance ~$92,400 — local sell zone $94,000–$97,500 — volume zone $101,000–$104,000 — accumulated volume This publication is not financial advice.
Crypto_robotics
BTC/USDT Analysis. Searching for a Key Support for a Long Positi

Hello everyone! CryptoRobotics trader-analyst here with your daily market analysis. Yesterday, Bitcoin reached the local resistance level at $90,000. The price faced strong selling pressure once again and failed to consolidate above this level, which resulted in a pullback. We continue to treat $90,000 as a key resistance, as the highest cluster volume is concentrated at this price. At the moment, BTC has tested the $88,000 support level (selling absorption). Clear buyer defense is not yet visible, but we allow the formation of a potential reversal structure around these levels. A possible long scenario would be a rebound toward $89,000, followed by a failed attempt from sellers to push the price back below $88,000. Only in this case will we consider long positions. For now, the priority scenario remains a continuation of the decline toward the next support levels, as buyer activity still appears weak. Buy Zones $88,000 — selling absorption $86,000–$84,800 — anomalous activity $84,000–$82,000 — volume anomalies Sell Zones $90,000 — untested volume, local resistance ~$92,400 — local sell zone $94,000–$97,500 — volume zone $101,000–$104,000 — accumulated volume This publication is not financial advice.
Crypto_robotics
Analytics: market outlook and forecasts

WHAT HAPPENED? Last week, the seller sought to "push" the price of bitcoin to a significant zone of $84,000-$82,000. However, each time the local minimum was updated, it was protected by the buyer. As a result, the whole week passed within the range, without a specific direction of movement. WHAT WILL HAPPEN: OR NOT? The first signs of buyer activity are now visible in the delta. Volumes support the price, which indicates a potential shift to the upper boundary of a more global sideways trend around $94,500. We’re considering buys from the local support of $88,000, where an absorption of sales was noticed, or — in the absence of a reaction — from lower levels. Only two local selling zones are located above the current levels, from which no significant resistance is expected. Buy Zones $88,000 (absorption of selling) $86,000–$84,800 (abnormal activity) $84,000–$82,000 (volume anomalies) Sell Zones $90,000 (untested volume, local zone) ~$92,400 (local sell zone) $94,000–$97,500 (high-volume zone) $101,000–$104,000 (accumulated volumes) IMPORTANT DATES This week, Christmas holidays are starting in many countries, so there aren’t many macroeconomic events ahead: • Monday, December 22, 15:00 (UTC) — publication of the basic price index of US personal consumption expenditures for October; • Tuesday, December 23, 13:30 (UTC) — publication of US GDP for the third quarter of 2025; • December 23, Tuesday, 15:00 (UTC) — publication of the CB Consumer confidence index for December; • December 23, Tuesday, 20:00 (UTC) — publication of data on new home sales in the United States for September, October and November; • Wednesday, December 24, 13:30 (UTC) — publication of the number of initial applications for unemployment benefits in the United States. *This post is not a financial recommendation. Make decisions based on your own experience. #analytics
Crypto_robotics
BTC/USDT Analysis. Another Manipulative Move
Hello everyone! This is the CryptoRobotics trader-analyst with a daily market update. Yesterday, Bitcoin tested the sell zone at $88,800–$90,000 (area of abnormal selling activity), where price once again met resistance and went on to print a new local low. The $87,000 level — previously marked by the largest seller volume — failed to produce a reaction on the retest and did not act as a buyer absorption zone, highlighting short-term demand weakness. Price did not reach the key support at $84,000–$82,000 (volume anomalies). However, before testing that area, significant buyer activity emerged: attempts to push below the local low were defended, and selling pressure failed to extend the move. At the moment, Bitcoin is moving back toward $90,000, where untested abnormal volume remains. In the near term, we are considering a scenario involving the formation of a full reversal structure with a potential move toward the technical level at $94,500. On a retest of the abnormal activity zone $86,000–$84,800, and upon a clear buyer reaction, we will look for long opportunities. Buy Zones $86,000–$84,800 (abnormal activity) $84,000–$82,000 (volume anomalies) Sell Zones ~$90,000 (abnormal volume) ~$92,400 (local sell zone) $94,000–$97,500 (major volume zone) $101,000–$104,000 (accumulated volumes) This publication is not financial advice.
Crypto_robotics
BTC/USDT Analysis. Yesterday’s Pattern Played Out
Hello everyone! This is the CryptoRobotics trader-analyst with a daily market update. Yesterday, we identified volume accumulation positioned on the buy side. Shortly after the analysis was published, Bitcoin made a sharp move toward $90,000, fully realizing the local upside potential discussed earlier. At the moment, the market picture remains mixed. On one hand, a local bearish structure break has formed on the 1H timeframe, and recent buying pressure lacks volume support. On the other hand, sellers are failing to take control: during the local rally and the test of the $87,000 level — where the largest seller volume of the week was formed — selling pressure was quickly absorbed by buyers. This area is now acting as local support. Above the current price lies a zone of abnormal seller activity, formed during yesterday’s short squeeze. The $88,800–$90,000 area is considered key resistance. The base scenario is range trading between support and resistance. A confident breakout and consolidation above $88,800–$90,000 would confirm a full break of the local downtrend that has been in place since last week. Buy Zones $87,000 (sell-side absorption) $84,000–$82,000 (volume anomalies) Sell Zones $88,800–$90,000 (abnormal selling activity) ~$90,300 (local resistance) ~$92,400 (local resistance) $92,000–$93,000 (local volume zone) $94,000–$97,500 (major volume zone) $101,000–$104,000 (accumulated volumes) This publication is not financial advice.
Crypto_robotics
BTC/USDT Analysis. Micro-Context Assessment
Hello everyone! CryptoRobotics trader-analyst here, and this is the daily market analysis. Yesterday, Bitcoin tested a high-volume bar where significant selling pressure had previously formed. As expected, a reaction followed: volumes increased on the approach, but sellers failed to seize control, and the primary bearish continuation scenario was not realized. At the moment, the micro-context, volume distribution, and price action are leaning in favor of buyers. Around the $87,000 level, notable volume is being accumulated on the buy side. On a retest of this area, a short-term long setup can be considered with a target near $90,000. If no reaction follows and the $86,000 level is broken, the scenario shifts toward continued downside, with price moving toward the next major support zone. Buy Zones • $87,000 (major volume cluster) • $84,000–$82,000 (volume anomalies) Sell Zones • ~$90,300 (local sell zone) • ~$92,400 (local sell zone) • $92,000–$93,000 (local volume zone) • $94,000–$97,500 (volume zone) • $101,000–$104,000 (accumulated volumes) This publication is not financial advice.
Disclaimer
Any content and materials included in Sahmeto's website and official communication channels are a compilation of personal opinions and analyses and are not binding. They do not constitute any recommendation for buying, selling, entering or exiting the stock market and cryptocurrency market. Also, all news and analyses included in the website and channels are merely republished information from official and unofficial domestic and foreign sources, and it is obvious that users of the said content are responsible for following up and ensuring the authenticity and accuracy of the materials. Therefore, while disclaiming responsibility, it is declared that the responsibility for any decision-making, action, and potential profit and loss in the capital market and cryptocurrency market lies with the trader.