
AltcoinPiooners
@t_AltcoinPiooners

What symbols does the trader recommend buying?
Purchase History
پیام های تریدر
Filter
AltcoinPiooners
آیا اتریوم به منطقه خرید تاریخی رسیده است؟ فرصت بزرگ پیش رو!
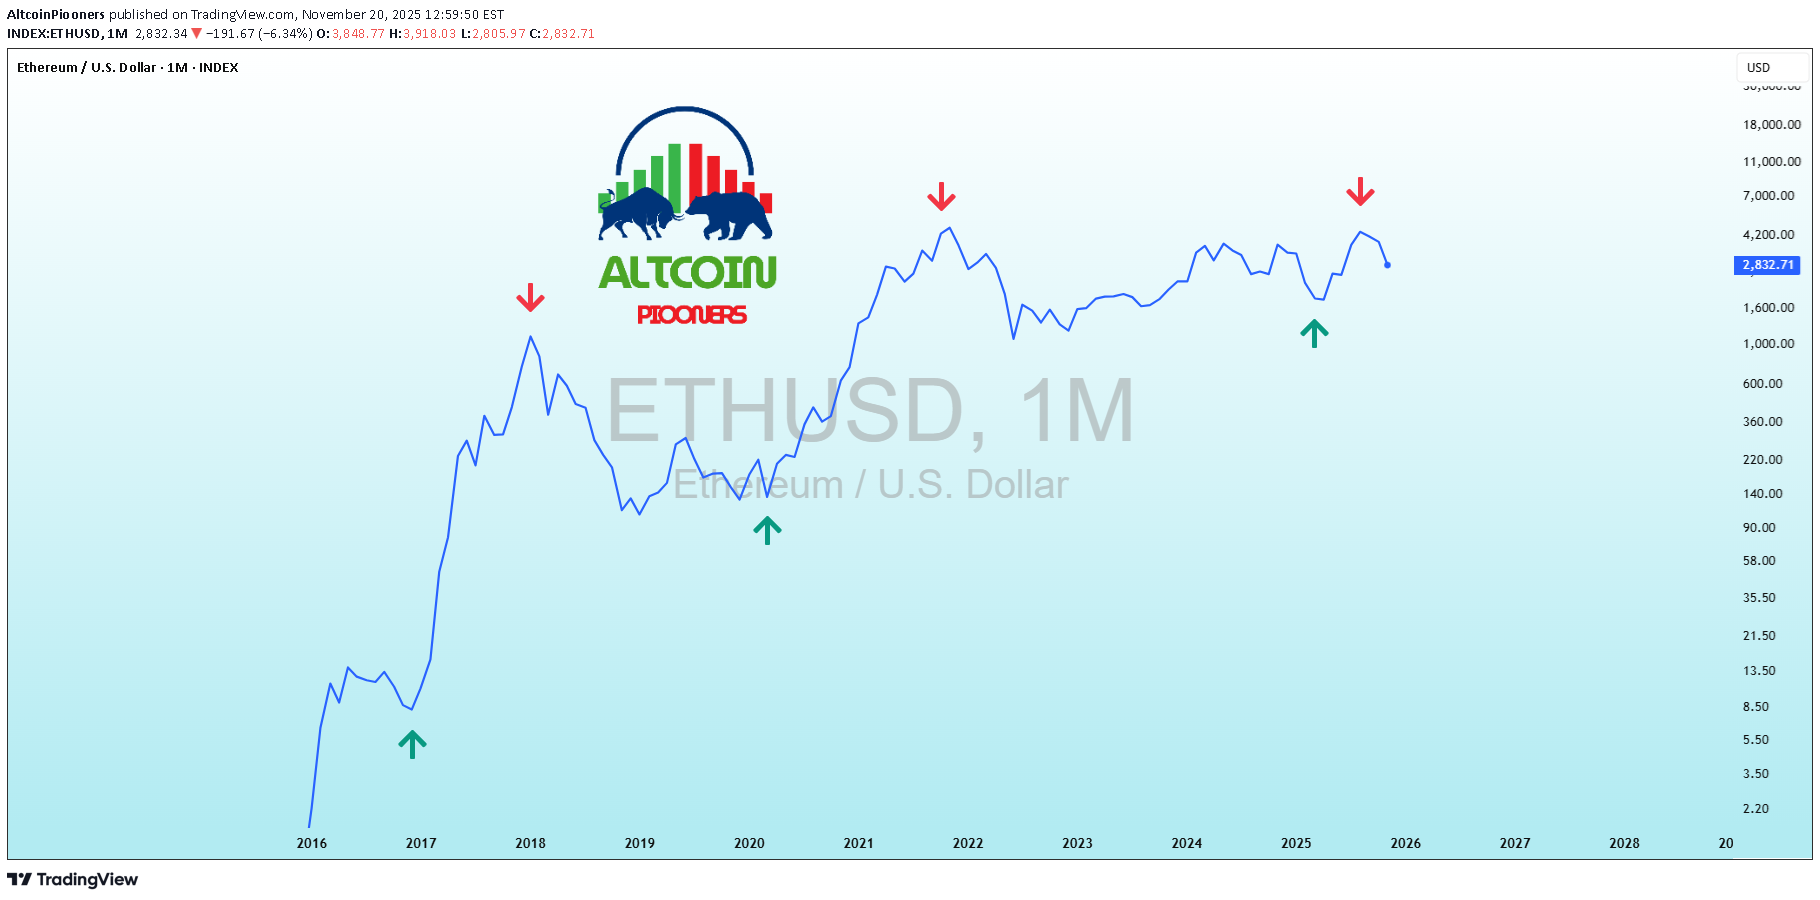
ETHUSD ETH History Says We’re at the Buy Zone! 🐂💙 Altcoin Pioneers! 🔥 Ethereum monthly chart just hit the legendary 0.618 Fibonacci retracement of the entire 2018–2025 bull cycle (~$2,820) and is printing a perfect higher low with a bullish divergence on RSI. Every single time ETH has touched this golden Fib level in history: → 2018 bear market bottom ✓ → March 2020 Covid crash bottom ✓ → 2022 bear market bottom ✓ → 2025 … loading? ⏳ Current price ~$2,826 with strong weekly bounce. If we hold above $2,700–2,800, next realistic targets: - $3,600 (quick retest) - $4,200–4,800 (all-time high reclaim) Only real bear case is monthly close below $2,400 — but momentum & structure say bulls are waking up. ETH is coiling for the biggest move of the cycle. Patience pays here! ⏰🚀 #Ethereum #ETH #CryptoCycle (Perfect TradingView title: “ETH Monthly – Golden 0.618 Fib Touch | 4th Time in History = Massive Bounce Incoming”)
AltcoinPiooners
اصلاحیه سوم بیت کوین: دقیقاً طبق نقشه! آیا وقت خریدن ترس است؟
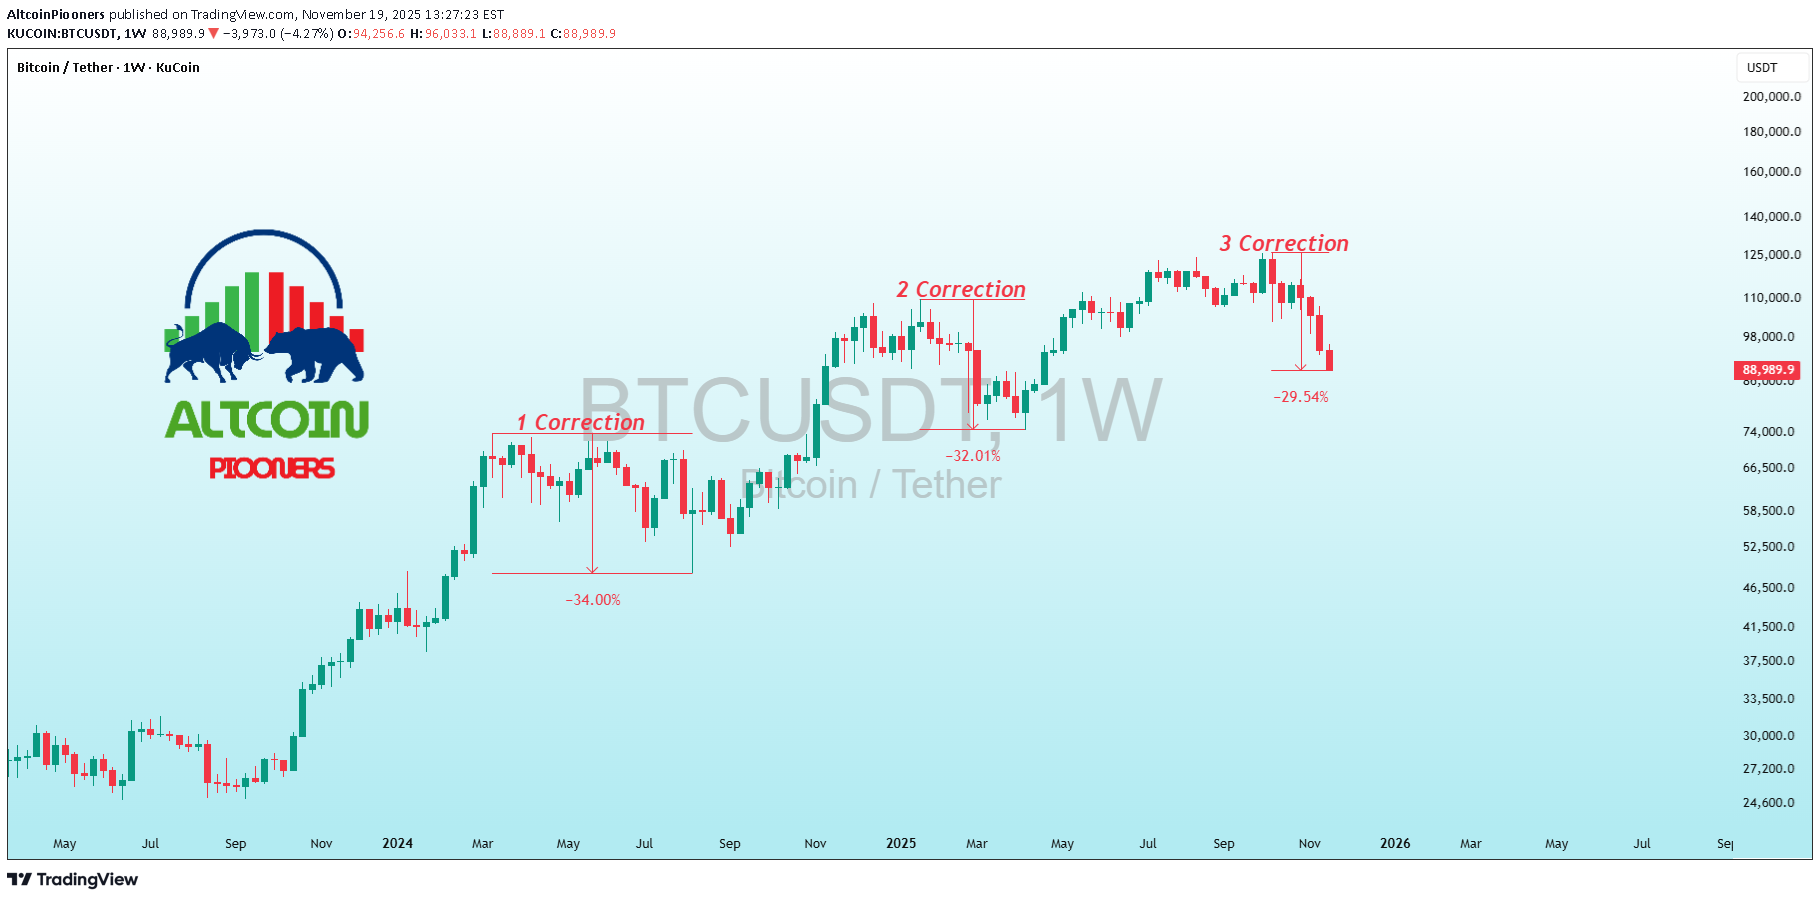
BTCUSDT BTC Correction 3 in Progress – Exactly on Script! 📉🚨 Altcoin Pioneers! ⚡ Bitcoin is following the historical fractal to the dot: - Correction 1: -34% ✅ - Correction 2: -32% ✅ - Correction 3: currently -29.5% and counting (price ~89,130) We’re now deep into the scariest phase of every bull market – the one that shakes out weak hands before the real parabolic run. This weekly candle is testing the 0.618 Fib + previous cycle highs zone (~84–88k). What happens next: - Hold 84k → final capitulation wick → explosive markup to 150k+ - Lose 84k decisively → extended correction toward 70–74k (less likely) Indicators: Weekly RSI at 58 (still healthy), no bearish divergence yet, volume rising on panic = perfect washout setup. Bias: This is the ultimate buy-the-fear moment as long as we stay above 84k. History says the biggest gains come right after Correction 3. Stay strong! 🐂💎 #Bitcoin #BTCFractal #BullMarket
AltcoinPiooners
سولانا زنده شد! جهش خیرهکننده ۱۰٪ از خط حمایت؛ آیا مسیر صعود به ۲۰۰ دلار هموار است؟
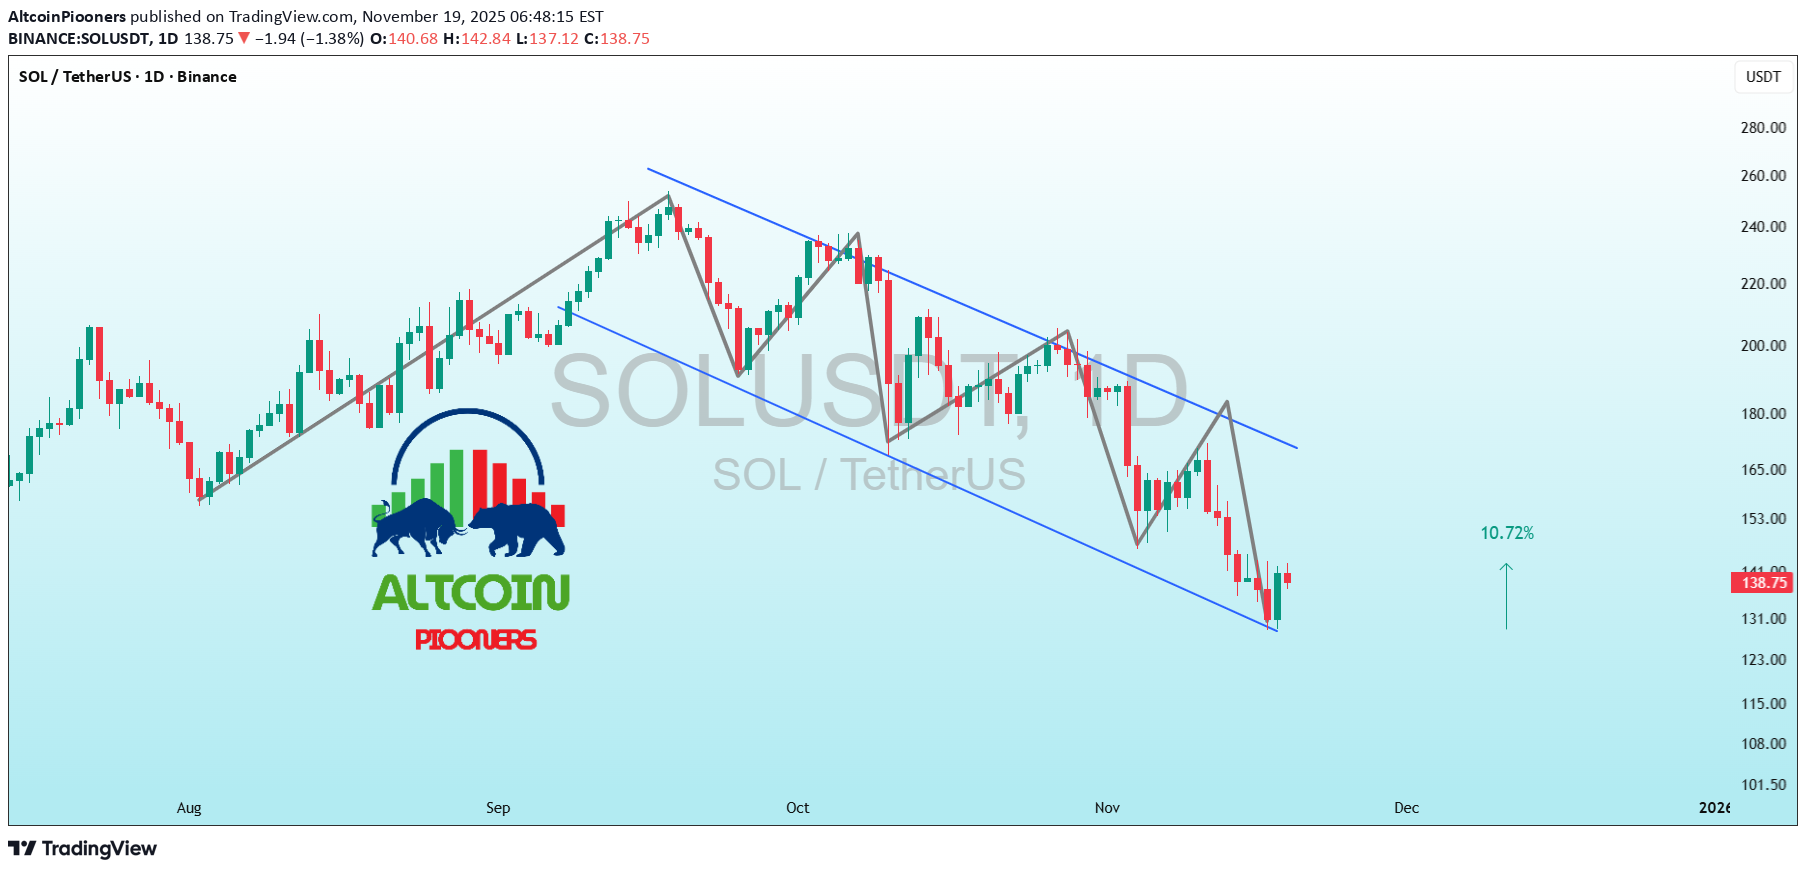
SOLUSDT SOL +10.72% Bounce Off the Trendline – Solana Is ALIVE! 🔥🚀 Altcoin Pioneers! 🐂 SOL just wicked down to the perfect multi-month ascending trendline at ~$138, rejected lower prices hard, and pumped +10.72% in hours with a massive green candle! - This exact trendline held every major dip since the 2024 breakout - Today’s bounce printed the strongest daily volume in 3 weeks + RSI bullish divergence - We’re still inside the descending channel, but lower trendline defense is flawless Bullish scenario (highly likely): → Hold $145–$150 → breakout above $165–$170 this week → fast retest $200–$220 → Full target in altseason: $300–$400 (yes, again) Only invalidation below $130 clean daily close. Solana is the king of speed and volume – when BTC bleeds, SOL leads the recovery. This is the exact spot legends buy! 💎 #Solana #SOL #AltseasonLeader LFG Solana army, we’re just getting warmed up! 🐆💥
AltcoinPiooners
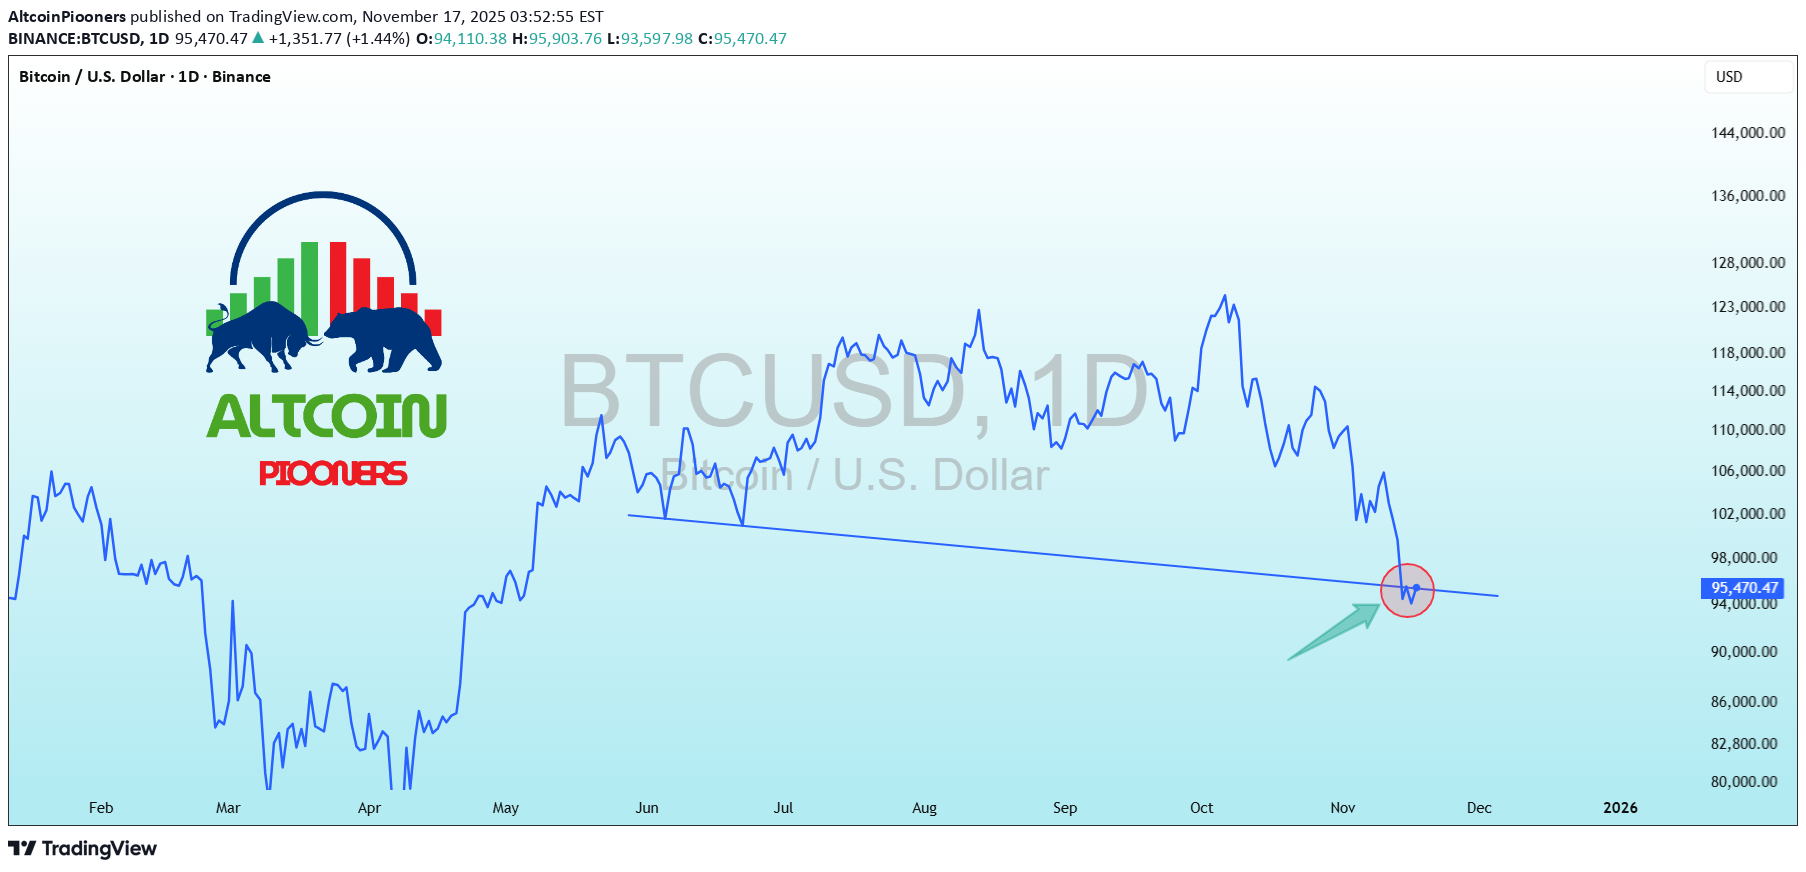
بیت کوین در لحظه سرنوشت: آیا حمایت چند ساله میشکند؟ (هشدار حیاتی)
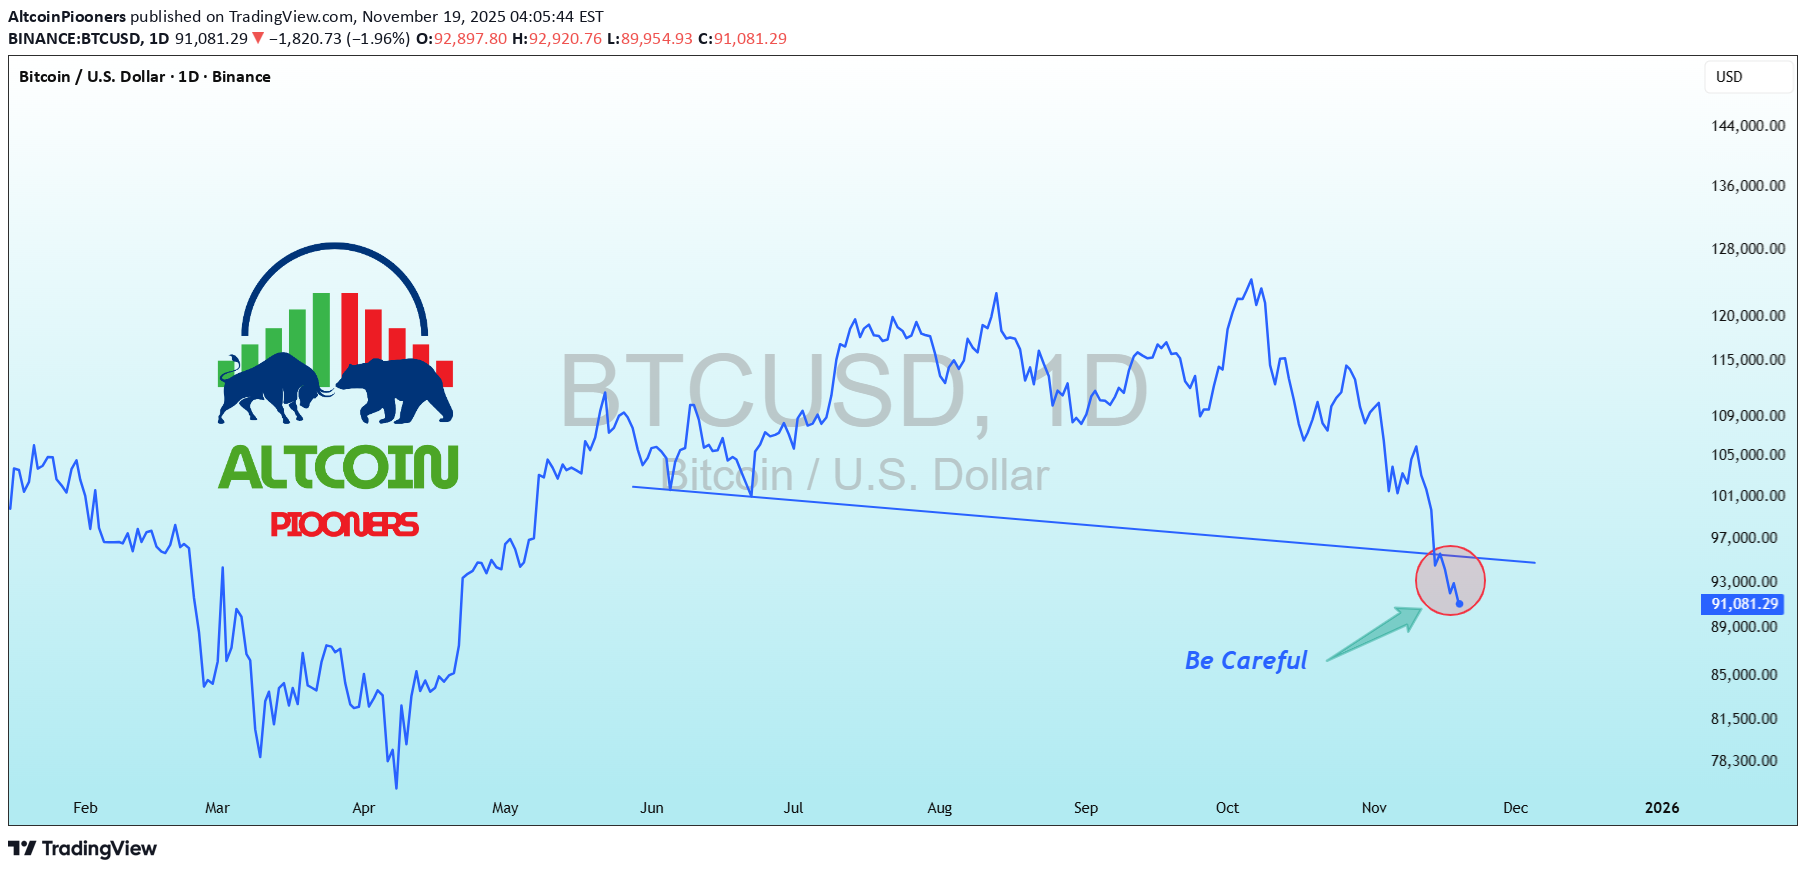
BTCUSD BTC Critical Warning – Final Major Support Test! ⚠️ Altcoin Pioneers! 🚨 Bitcoin just wicked straight into the multi-year ascending trendline on the daily chart at ~$91,281 – this exact blue line has held EVERY major correction since early 2023! - We’re literally on the edge right now - “Be Careful” arrow is spot on → one clean daily close below $90k–$91k flips the entire macro structure bearish - Invalidation of the bull market only on decisive break & close under the trendline Bullish defense scenario (still base case): → Strong bounce from here → reclaim $95k–$97k fast → continuation to $110k+ But if we lose this level? Next real support sits at $78k–$82k zone. This is the make-or-break moment of the cycle. Hold the line or risk a deeper correction! 🛡️ #Bitcoin #BTCSupport #MakeOrBreak Stay sharp, legends! 👀
AltcoinPiooners
افت 77% و 65% هایپرلکوئید تمام شد: منطقه انباشت نهایی و فرصت انفجار قیمت!
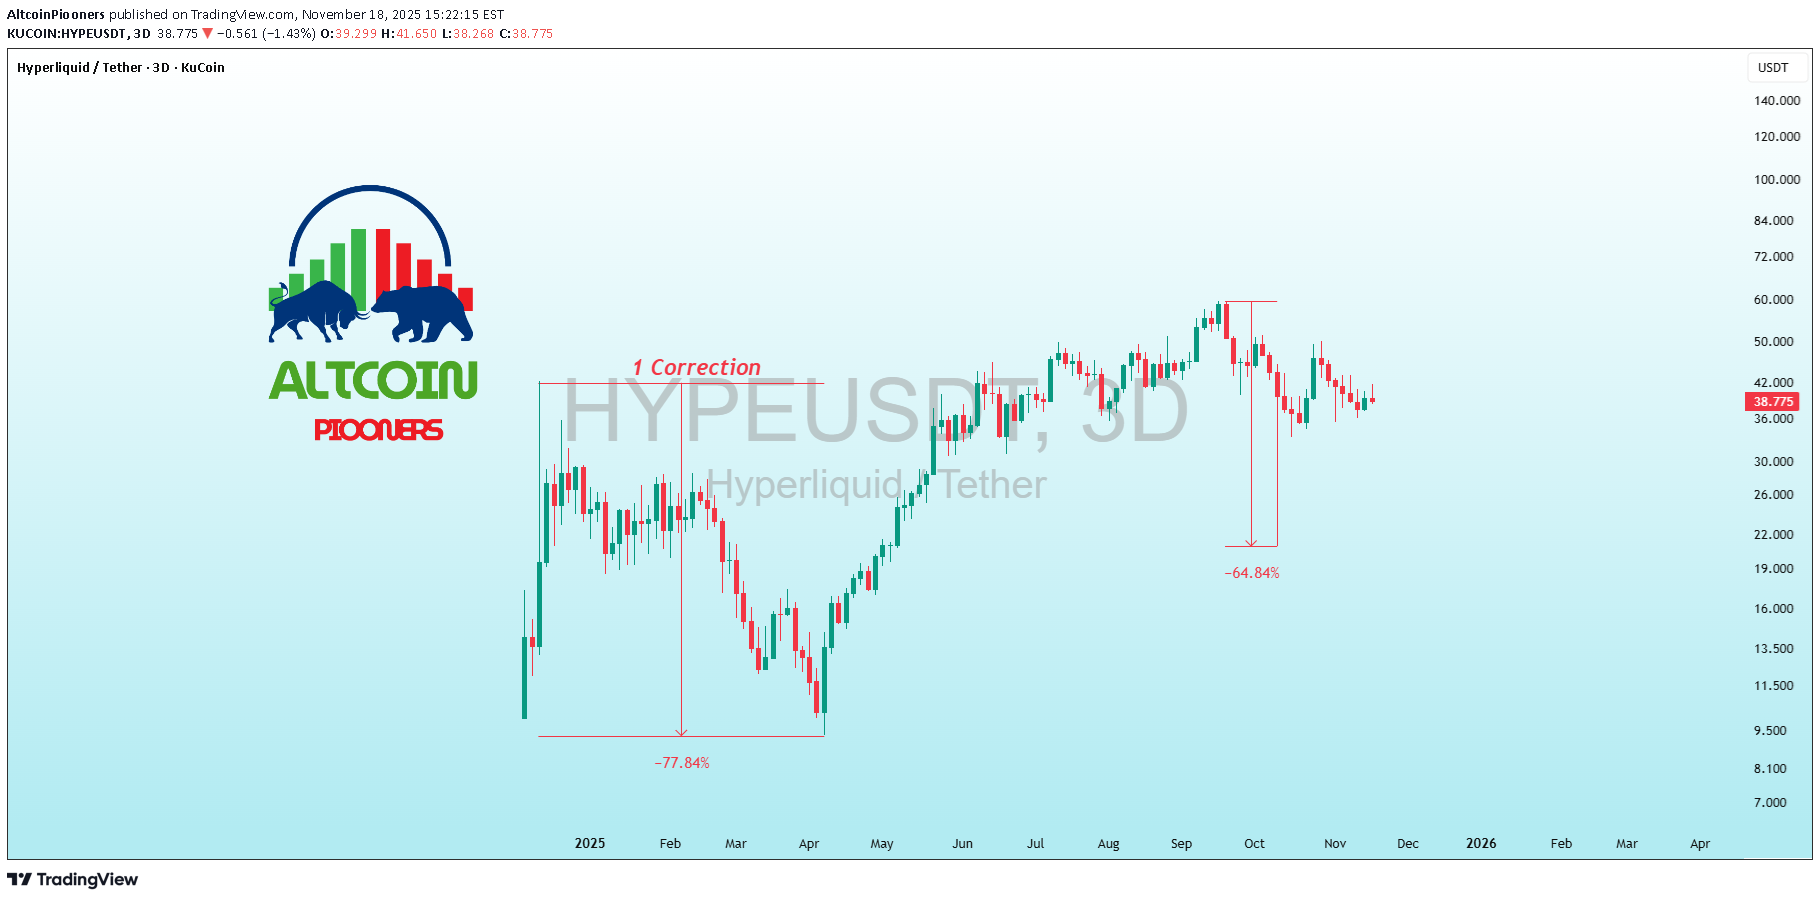
HYPEUSDT HYPE Hyperliquid Down -77% Then -65% – Now at Final Accumulation Zone! 🔥 Altcoin Pioneers! 🐂 HYPE just completed TWO massive corrections on the 3-day chart: - First leg: -77.84% (healthy reset after launch pump) - Second leg: -64.84% (final shakeout) → landed exactly on the higher low support Price is now forming a clear double-bottom structure with strong weekly divergence on RSI + volume drying up completely = textbook whale accumulation. As long as we hold $34–$36 zone: → Next leg targets $70–$85 (100%+ from here) → Full send in altseason: $120–$150+ This is the “buy when everyone forgot about it” moment. Hyperliquid is the hottest perp DEX narrative right now – chart says the pain is over, reversal loading! 🚀💥 #Hyperliquid #HYPE #PerpDEXGems
AltcoinPiooners
توقف خط روند اتریوم: آیا دوره صعودی مجدد آغاز میشود؟ (حمایت کلیدی و تارگتهای نجومی)
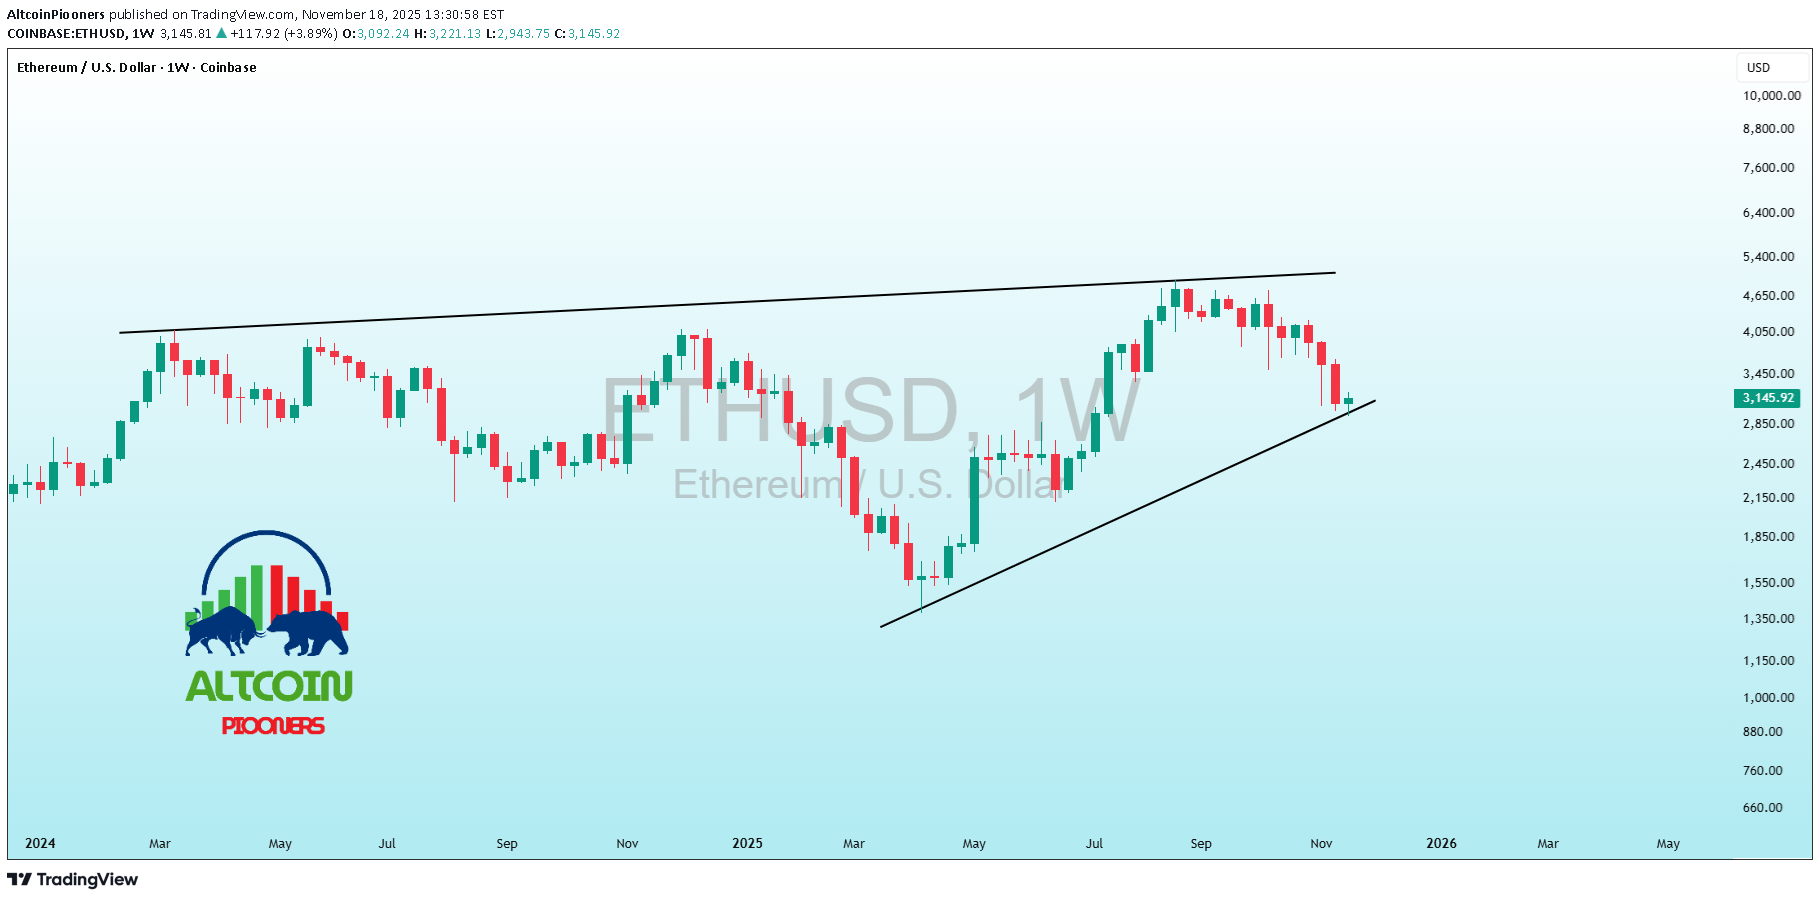
ETHUSD ETH Trendline Hold + Higher Low – Ethereum Bull Run Reloaded! 🚀 Altcoin Pioneers! 🔥 ETH just tagged the multi-year ascending trendline at ~$3,141 (the same line that perfectly caught every major low since 2022) and instantly bounced with a strong weekly green candle. Higher low officially confirmed! - Trendline defended for the 6th time ✅ - With BTC.D crashing, ETH.D bottoming & falling wedge breakout on BTC, all stars are aligning for Ethereum to lead the next leg - Close above $3,800 flips weekly structure → targets $5,000 → $7,000 → $10k+ in 2026 RSI resetting from oversold, volume building. This is the exact setup that launched ETH from $1,800 → $4,800 last cycle. Ethereum season is loading FAST! 🧪💥 #Ethereum #ETHBull #AltseasonLeader
AltcoinPiooners
آیا بیتکوین در کف چرخه، آماده جهش از منطقه اشباع فروش است؟
BTCUSD BTC Oversold Bounce Setup at Cycle Lows? 📈 Altcoin Pioneers! The daily BTC/USD chart is coiling at that blue descending channel's lower bound (~95k), with price flashing oversold signals after the brutal slide from April highs (~144k). That green arrow hints at reversal potential—volume's contracting, but a hammer wick at lows screams buyer interest. Hold support? Prime odds with RSI dipping to 25 (bullish divergence brewing). Breakout above resistance? Catalyst needed for 100k test; close >98k flips bias. Deeper dip risk? Low unless yields spike, eyeing 90k floor. Target: Rally to 102k on confirmation, or retest 92k on fakeout. Tracking: Stochastic for crossovers, on-balance volume, and spot ETF flows. Momentum shift incoming? 👀 #BTCReversal #CryptoDaily #TradingSignals
AltcoinPiooners
تحلیل داغ $HYPER: نگه داشتن حمایت یا تخلیه نقدینگی؟
HYPEUSDT $HYPER Heat Check – Support Hold or Liquidity Drain? Altcoin Pioneers! 🔥 HYPER/USDT 1H is flirting with that red support line at ~35,500 after a brutal slide down the black descending channel from 42k resistance. DeFi liquidity token showing grit, but rejection wicks scream seller dominance – volume's picking up on lows, potential trap door. Hold support? 60/40 yes if RSI climbs from 35 with a bullish pinbar; could fake out bears. Breakout above resistance? Stretch without perp DEX news, needs >41k close for 43k push. Deeper dip risk? Looming – breach targets 34k (channel proj.), alt liq cascade. Target: Bounce to 37k if holds, dump to 34.5k on crack. Watching: Funding rates for perp bias, OBV divergence, and HYPER/BTC for decoupling. Liquidate wisely! 💧📉 #HYPER #DeFiTrading #AltcoinCharts
AltcoinPiooners
تحلیل کاردانو (ADA): آیا زمان استیک کردن است یا ریزش بزرگ در راه؟
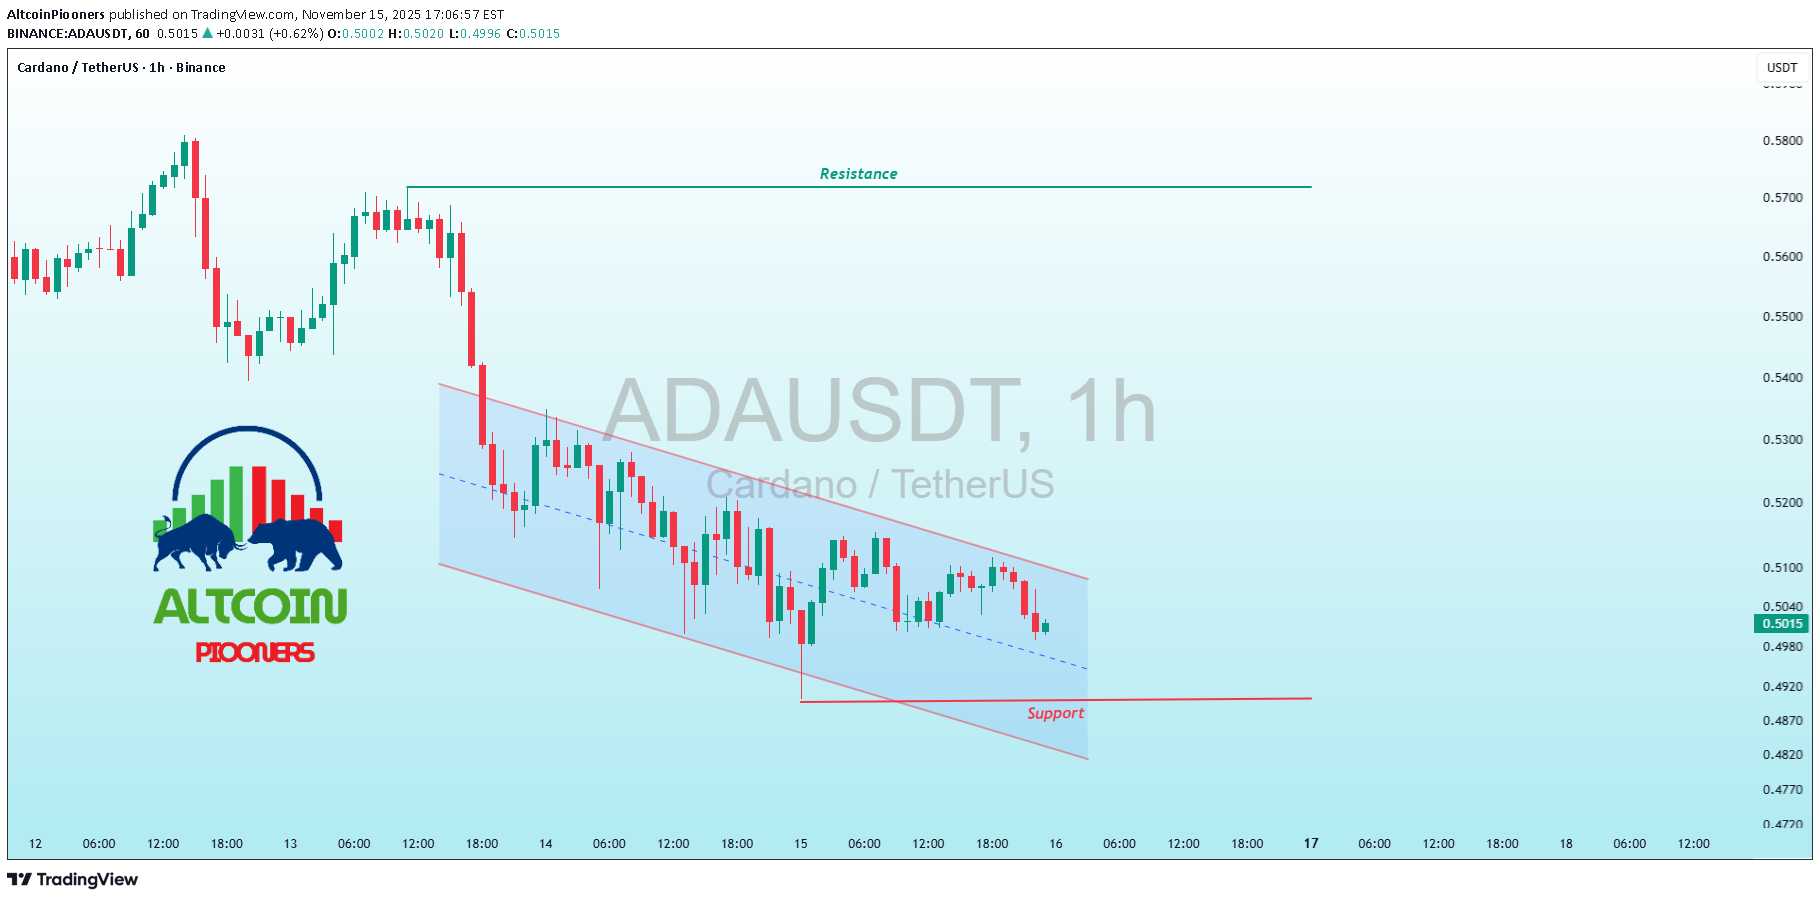
ADAUSDT ADA Cardano Channel Crunch – Stake or Break? Altcoin Pioneers! 🏔️ ADA/USDT 1H is wedged in this blue descending channel, price slamming into support ~0.487 after a fierce rejection at the upper trendline near 0.52. Cardano's PoS resilience on display, but BTC correlation keeps the pressure cooker boiling – that cyan consolidation box hints at a potential fakeout. Hold support? Bullish if volume surges on the hammer; RSI at 29 screaming oversold bounce. Breakout above resistance? Epic on Voltaire upgrade vibes, targeting 0.55. Deeper dip risk? Sharp – snap below eyes 0.47 (Fib 0.786), alt purge mode. Target: Rebound to 0.505 if holds, drop to 0.475 on fail. Tracking: EMA cloud pierce, Williams %R for reversal, and ADA/BTC for independence. Stake smart! 🔒📉 #ADA #Cardano #CryptoAnalysis
AltcoinPiooners
دوجکوین در سراشیبی: آیا جادوی میمها نجاتش میدهد یا سقوط قطعی است؟

DOGEUSDT DOGE Dips to Defend – Meme Magic or Moonshot Fade? Altcoin Pioneers! 🐕 DOGE/USDT 1H is barking at that blue descending triangle's lower edge, price clawing back from support ~0.154 after a savage rejection at resistance 0.180. Elon whispers aside, volume's thinning on the downside – classic meme coin volatility brewing. Hold support? Woof yeah, if RSI snaps from oversold 25 with a green engulfing; could trap shorts. Breakout above resistance? Pump city on tweet fuel, targeting 0.185. Deeper dip risk? Mucho – crack it and 0.148 (Fib 0.618) howls, dragging sentiment. Target: Quick bark to 0.162 if holds, whimper to 0.152 on break. Eyes on: Bollinger squeeze for vol burst, OBV for accumulation, and DOGE/BTC for BTC leash. To the moon or bust? 🚀📉 #DOGE #MemeCoins #TradingView
Disclaimer
Any content and materials included in Sahmeto's website and official communication channels are a compilation of personal opinions and analyses and are not binding. They do not constitute any recommendation for buying, selling, entering or exiting the stock market and cryptocurrency market. Also, all news and analyses included in the website and channels are merely republished information from official and unofficial domestic and foreign sources, and it is obvious that users of the said content are responsible for following up and ensuring the authenticity and accuracy of the materials. Therefore, while disclaiming responsibility, it is declared that the responsibility for any decision-making, action, and potential profit and loss in the capital market and cryptocurrency market lies with the trader.