
fibonacci6180
@t_fibonacci6180

What symbols does the trader recommend buying?
Purchase History
پیام های تریدر
Filter
fibonacci6180
Solana Chart Fibonacci Analysis 092725
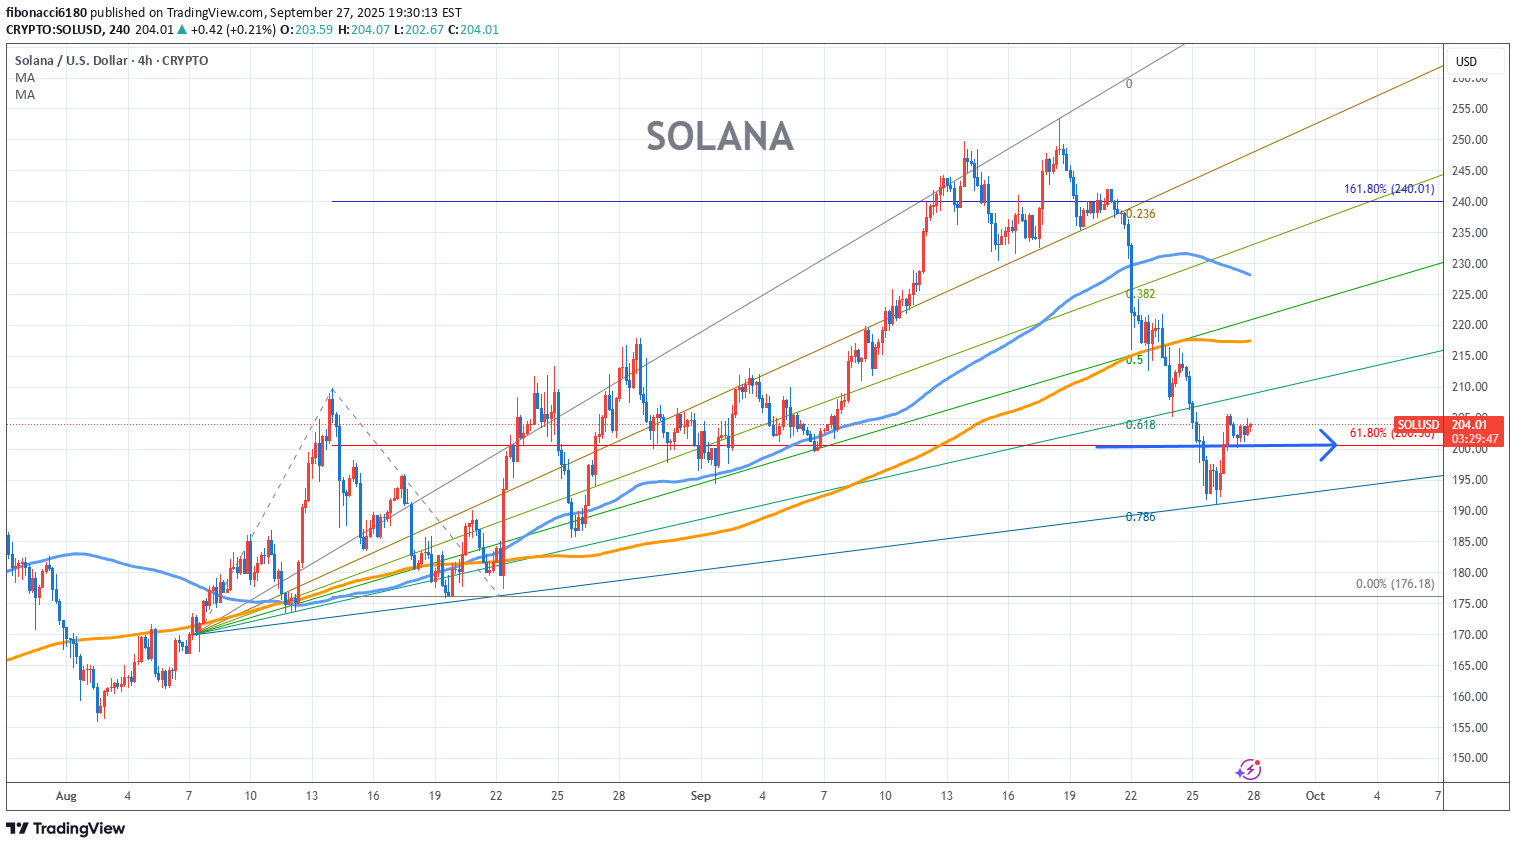
Trading Idea 1) Find a FIBO slingshot 2) Check FIBO 61.80% level 3) Entry Point > 200/61.80% Chart time frame:B A) 15 min(1W-3M) B) 1 hr(3M-6M) C) 4 hr(6M-1year) D) 1 day(1-3years) Stock progress:A A) Keep rising over 61.80% resistance B) 61.80% resistance C) 61.80% support D) Hit the bottom E) Hit the top Stocks rise as they rise from support and fall from resistance. Our goal is to find a low support point and enter. It can be referred to as buying at the pullback point. The pullback point can be found with a Fibonacci extension of 61.80%. This is a step to find an entry-level position. 1) Find a triangle (Fibonacci Speed Fan Line) that connects the high (resistance) and low (support) points of the stock in progress, where it is continuously expressed as a Slingshot, 2) and create a Fibonacci extension level for the first rising wave from the start point of the slingshot pattern. When the current price goes over the 61.80% level, that can be a good entry point, especially if the SMA 100 and 200 curves are gathered together at 61.80%, it is a very good entry point. As a great help, TradingView provides these Fibonacci speed fan lines and extension levels with ease. So if you use the Fibonacci fan line, the extension level, and the SMA 100/200 curve well, you can find an entry point for the stock market. At least you have to enter at this low point to avoid trading failure, and if you are skilled at entering this low point, with the fibonacci6180 technique, your reading skill of to chart will be greatly improved. If you want to do day trading, please set the time frame to 5 minutes or 15 minutes, and you will see many of the low points of rising stocks. If you prefer long-term range trading, you can set the time frame to 1 hr or 1 day
fibonacci6180
Bitcoin Chart Fibonacci Analysis 092725
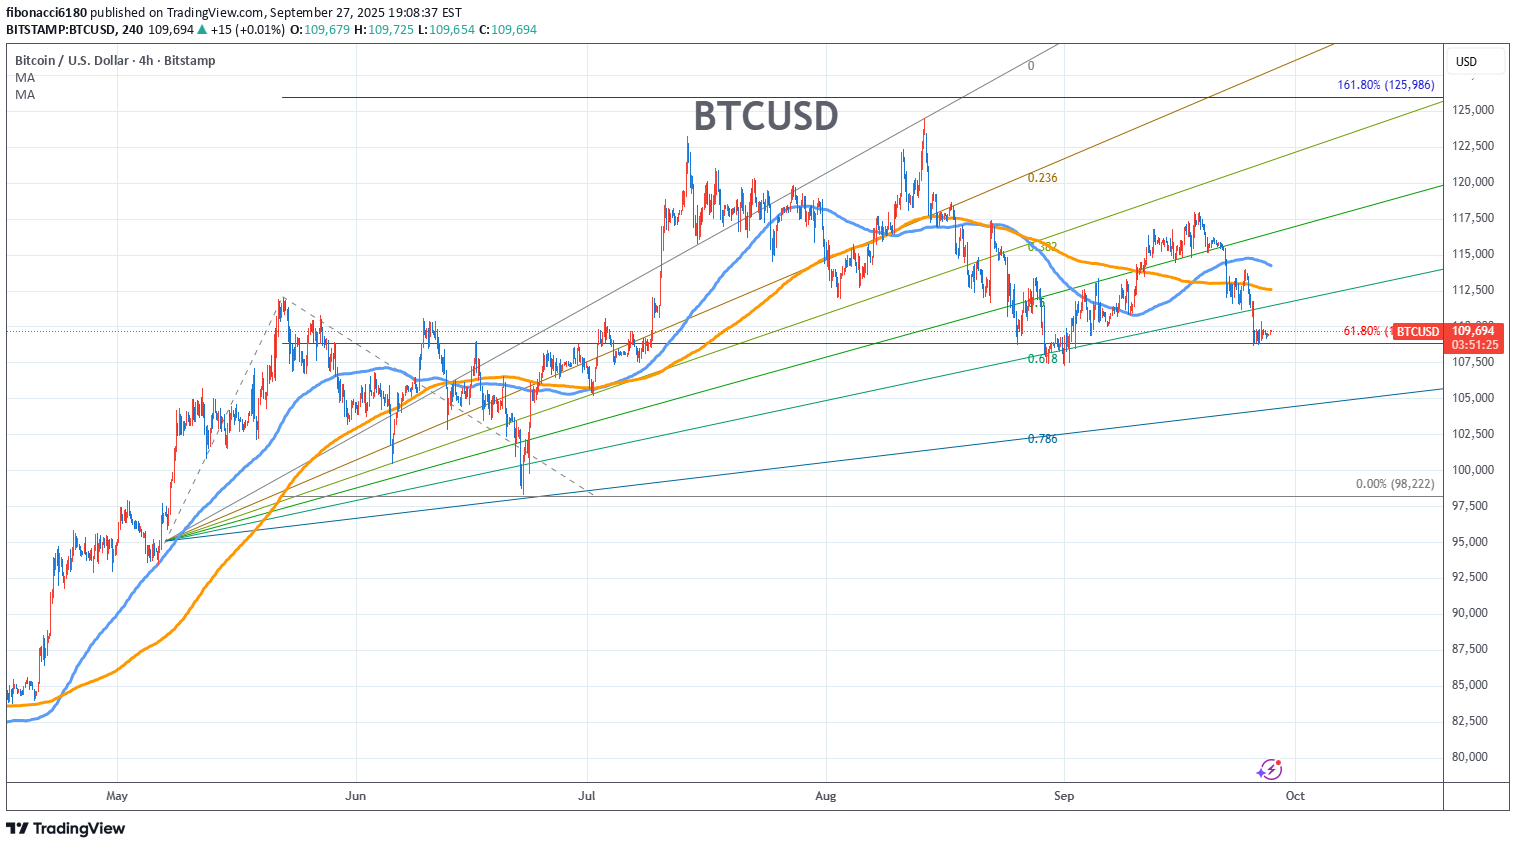
Trading Idea 1) Find a FIBO slingshot 2) Check FIBO 61.80% level 3) Entry Point > 108,850/61.80% Chart time frame:B A) 15 min(1W-3M) B) 1 hr(3M-6M) C) 4 hr(6M-1year) D) 1 day(1-3years) Stock progress:C A) Keep rising over 61.80% resistance B) 61.80% resistance C) 61.80% support D) Hit the bottom E) Hit the top Stocks rise as they rise from support and fall from resistance. Our goal is to find a low support point and enter. It can be referred to as buying at the pullback point. The pullback point can be found with a Fibonacci extension of 61.80%. This is a step to find an entry-level position. 1) Find a triangle (Fibonacci Speed Fan Line) that connects the high (resistance) and low (support) points of the stock in progress, where it is continuously expressed as a Slingshot, 2) and create a Fibonacci extension level for the first rising wave from the start point of the slingshot pattern. When the current price goes over the 61.80% level, that can be a good entry point, especially if the SMA 100 and 200 curves are gathered together at 61.80%, it is a very good entry point. As a great help, TradingView provides these Fibonacci speed fan lines and extension levels with ease. So if you use the Fibonacci fan line, the extension level, and the SMA 100/200 curve well, you can find an entry point for the stock market. At least you have to enter at this low point to avoid trading failure, and if you are skilled at entering this low point, with the fibonacci6180 technique, your reading skill of to chart will be greatly improved. If you want to do day trading, please set the time frame to 5 minutes or 15 minutes, and you will see many of the low points of rising stocks. If you prefer long-term range trading, you can set the time frame to 1 hr or 1 day
fibonacci6180
BTCUSD Chart Fibonacci Analysis 092325
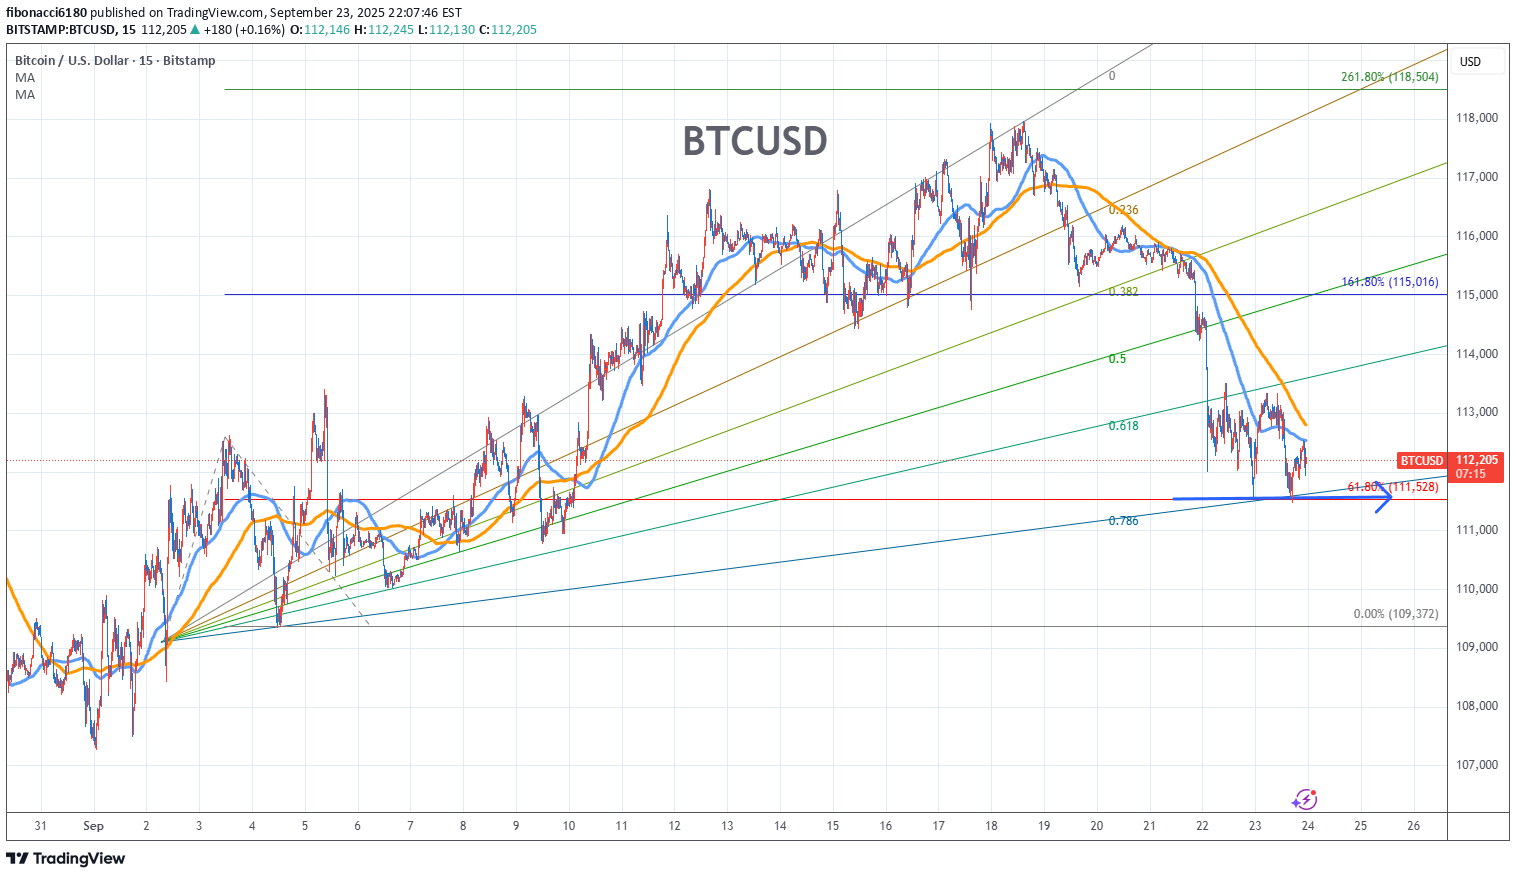
Trading Idea 1) Find a FIBO slingshot 2) Check FIBO 61.80% level 3) Entry Point > 111,528/61.80% Chart time frame:B A) 15 min(1W-3M) B) 1 hr(3M-6M) C) 4 hr(6M-1year) D) 1 day(1-3years) Stock progress:C A) Keep rising over 61.80% resistance B) 61.80% resistance C) 61.80% support D) Hit the bottom E) Hit the top Stocks rise as they rise from support and fall from resistance. Our goal is to find a low support point and enter. It can be referred to as buying at the pullback point. The pullback point can be found with a Fibonacci extension of 61.80%. This is a step to find an entry-level position. 1) Find a triangle (Fibonacci Speed Fan Line) that connects the high (resistance) and low (support) points of the stock in progress, where it is continuously expressed as a Slingshot, 2) and create a Fibonacci extension level for the first rising wave from the start point of the slingshot pattern. When the current price goes over the 61.80% level, that can be a good entry point, especially if the SMA 100 and 200 curves are gathered together at 61.80%, it is a very good entry point. As a great help, TradingView provides these Fibonacci speed fan lines and extension levels with ease. So if you use the Fibonacci fan line, the extension level, and the SMA 100/200 curve well, you can find an entry point for the stock market. At least you have to enter at this low point to avoid trading failure, and if you are skilled at entering this low point, with the fibonacci6180 technique, your reading skill of to chart will be greatly improved. If you want to do day trading, please set the time frame to 5 minutes or 15 minutes, and you will see many of the low points of rising stocks. If you prefer long-term range trading, you can set the time frame to 1 hr or 1 day
fibonacci6180
Cosmos Chart Fibonacci Analysis 091825
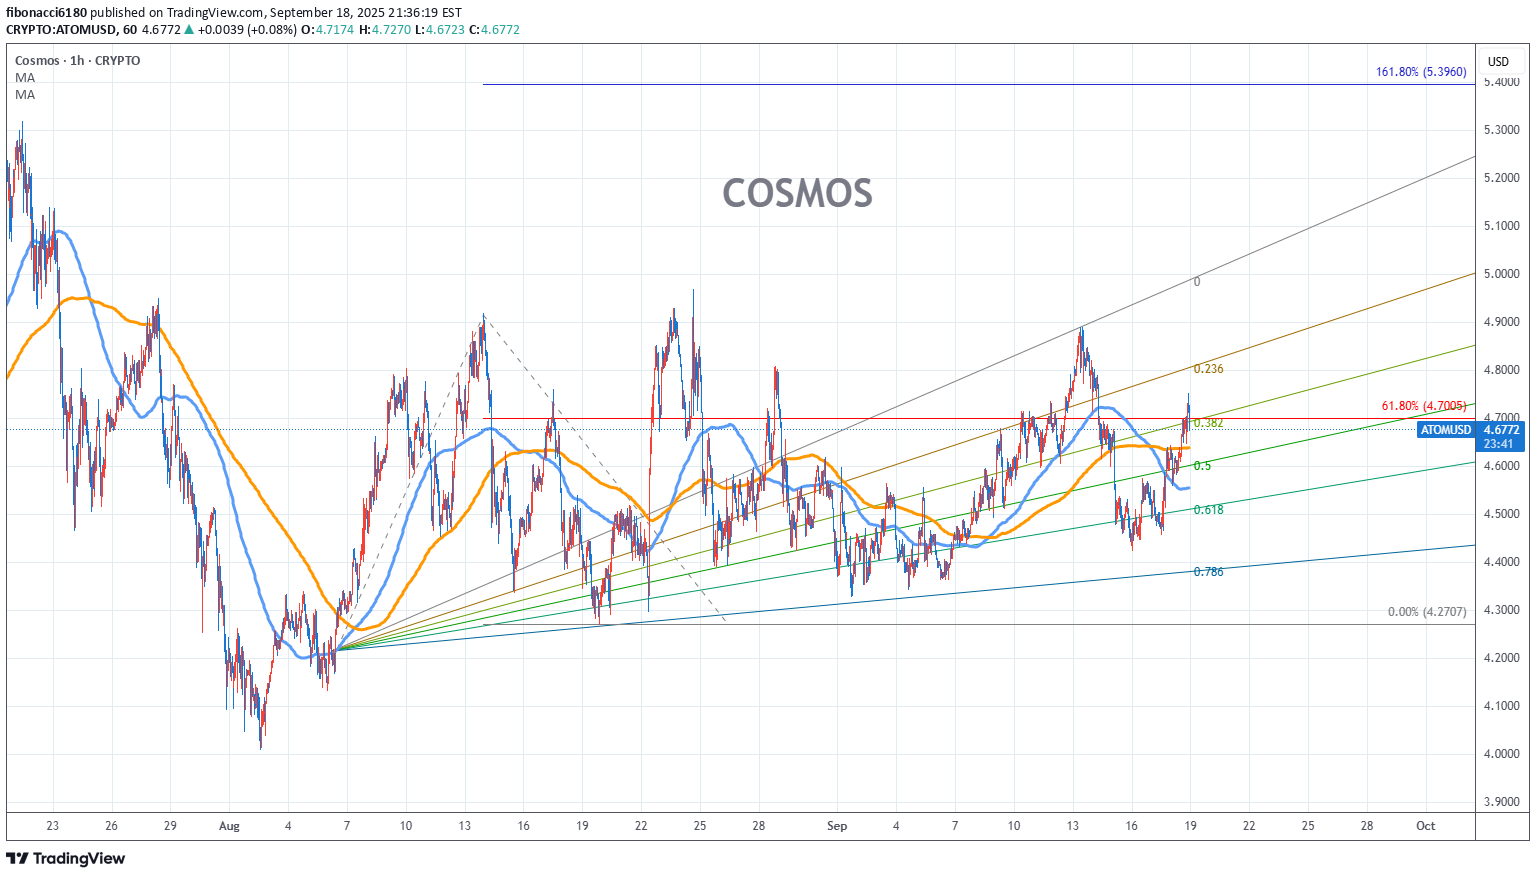
Trading Idea 1) Find a FIBO slingshot 2) Check FIBO 61.80% level 3) Entry Point > 4.7/61.80% Chart time frame:B A) 15 min(1W-3M) B) 1 hr(3M-6M) C) 4 hr(6M-1year) D) 1 day(1-3years) Stock progress:A A) Keep rising over 61.80% resistance B) 61.80% resistance C) 61.80% support D) Hit the bottom E) Hit the top Stocks rise as they rise from support and fall from resistance. Our goal is to find a low support point and enter. It can be referred to as buying at the pullback point. The pullback point can be found with a Fibonacci extension of 61.80%. This is a step to find an entry-level position. 1) Find a triangle (Fibonacci Speed Fan Line) that connects the high (resistance) and low (support) points of the stock in progress, where it is continuously expressed as a Slingshot, 2) and create a Fibonacci extension level for the first rising wave from the start point of the slingshot pattern. When the current price goes over the 61.80% level, that can be a good entry point, especially if the SMA 100 and 200 curves are gathered together at 61.80%, it is a very good entry point. As a great help, TradingView provides these Fibonacci speed fan lines and extension levels with ease. So if you use the Fibonacci fan line, the extension level, and the SMA 100/200 curve well, you can find an entry point for the stock market. At least you have to enter at this low point to avoid trading failure, and if you are skilled at entering this low point, with the fibonacci6180 technique, your reading skill of to chart will be greatly improved. If you want to do day trading, please set the time frame to 5 minutes or 15 minutes, and you will see many of the low points of rising stocks. If you prefer long-term range trading, you can set the time frame to 1 hr or 1 day
fibonacci6180
Ethereum Chart Fibonacci Analysis 091825
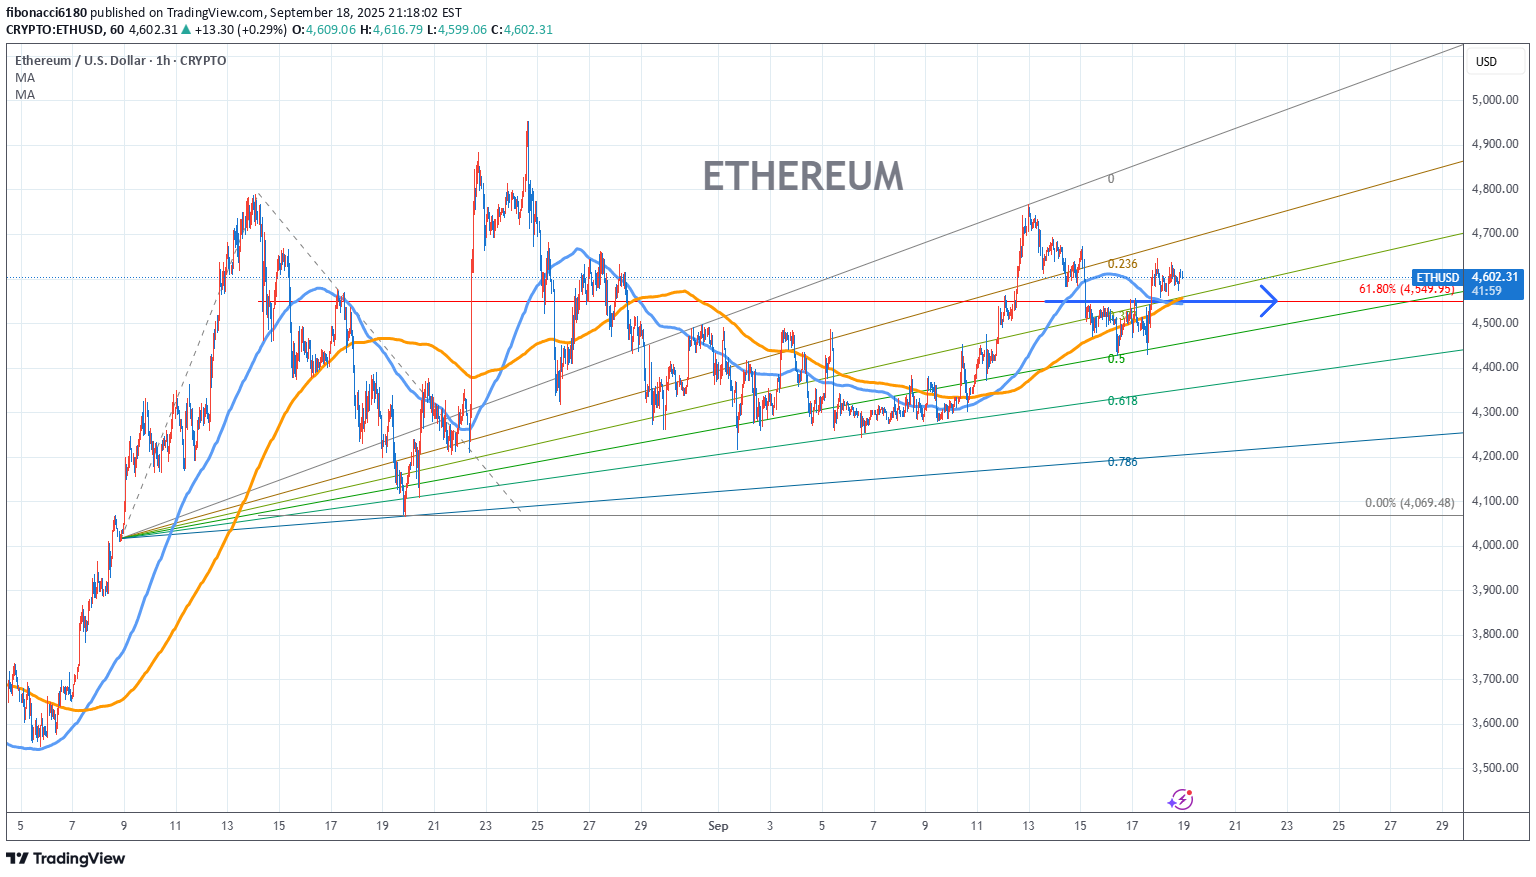
Trading Idea 1) Find a FIBO slingshot 2) Check FIBO 61.80% level 3) Entry Point > 4551/61.80% Chart time frame:B A) 15 min(1W-3M) B) 1 hr(3M-6M) C) 4 hr(6M-1year) D) 1 day(1-3years) Stock progress:A A) Keep rising over 61.80% resistance B) 61.80% resistance C) 61.80% support D) Hit the bottom E) Hit the top Stocks rise as they rise from support and fall from resistance. Our goal is to find a low support point and enter. It can be referred to as buying at the pullback point. The pullback point can be found with a Fibonacci extension of 61.80%. This is a step to find an entry-level position. 1) Find a triangle (Fibonacci Speed Fan Line) that connects the high (resistance) and low (support) points of the stock in progress, where it is continuously expressed as a Slingshot, 2) and create a Fibonacci extension level for the first rising wave from the start point of the slingshot pattern. When the current price goes over the 61.80% level, that can be a good entry point, especially if the SMA 100 and 200 curves are gathered together at 61.80%, it is a very good entry point. As a great help, TradingView provides these Fibonacci speed fan lines and extension levels with ease. So if you use the Fibonacci fan line, the extension level, and the SMA 100/200 curve well, you can find an entry point for the stock market. At least you have to enter at this low point to avoid trading failure, and if you are skilled at entering this low point, with the fibonacci6180 technique, your reading skill of to chart will be greatly improved. If you want to do day trading, please set the time frame to 5 minutes or 15 minutes, and you will see many of the low points of rising stocks. If you prefer long-term range trading, you can set the time frame to 1 hr or 1 day
fibonacci6180
Nvidia Stock Chart Fibonacci Analysis 090925
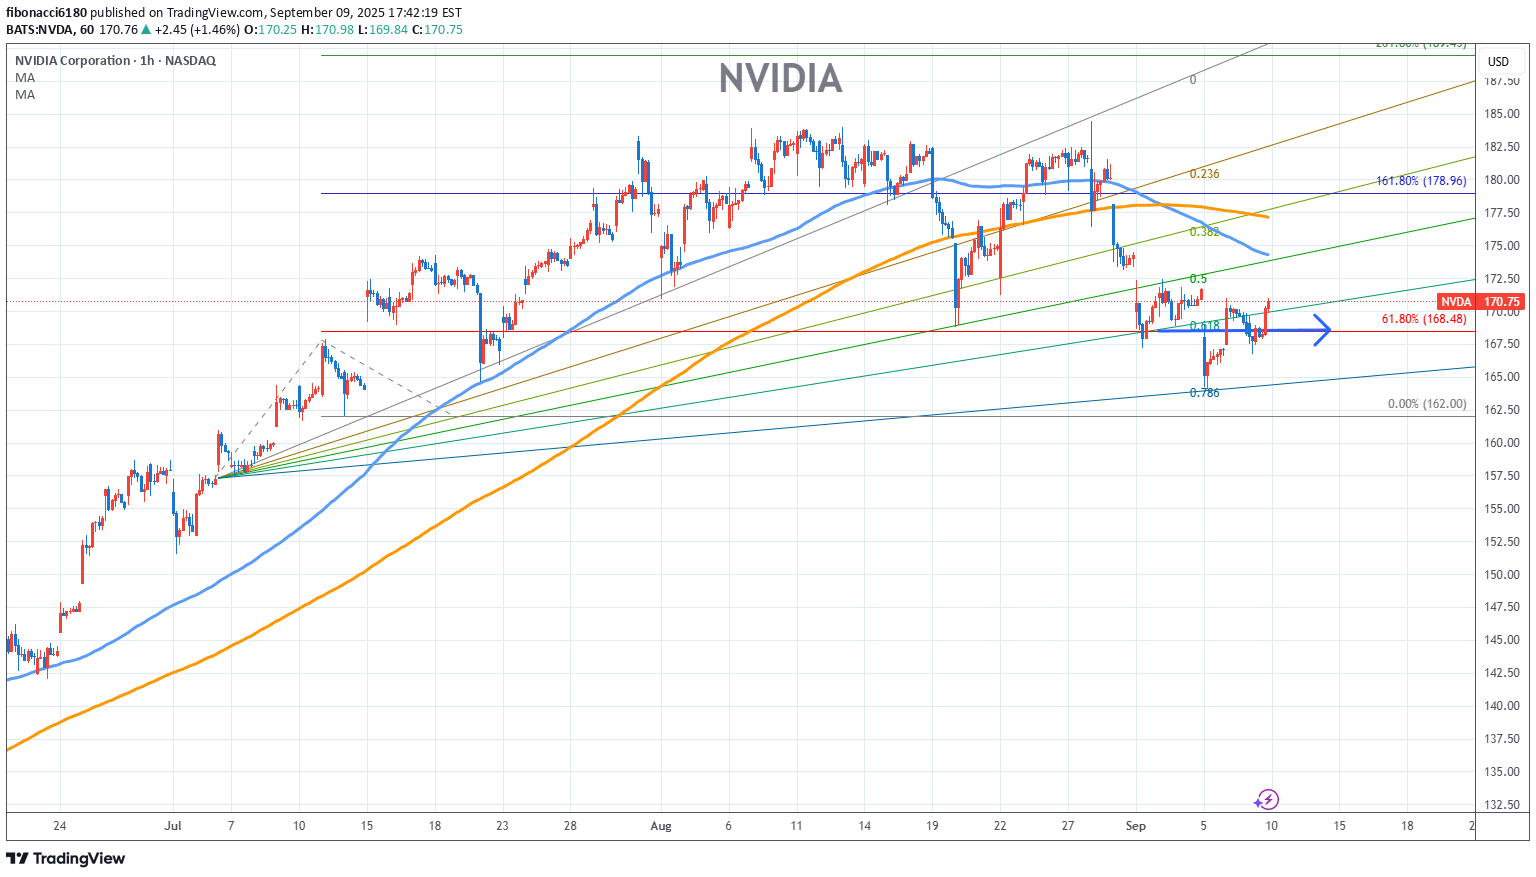
Trading Idea 1) Find a FIBO slingshot 2) Check FIBO 61.80% level 3) Entry Point > 168/61.80% Chart time frame:B A) 15 min(1W-3M) B) 1 hr(3M-6M) C) 4 hr(6M-1year) D) 1 day(1-3years) Stock progress:A A) Keep rising over 61.80% resistance B) 61.80% resistance C) 61.80% support D) Hit the bottom E) Hit the top Stocks rise as they rise from support and fall from resistance. Our goal is to find a low support point and enter. It can be referred to as buying at the pullback point. The pullback point can be found with a Fibonacci extension of 61.80%. This is a step to find an entry-level position. 1) Find a triangle (Fibonacci Speed Fan Line) that connects the high (resistance) and low (support) points of the stock in progress, where it is continuously expressed as a Slingshot, 2) and create a Fibonacci extension level for the first rising wave from the start point of the slingshot pattern. When the current price goes over the 61.80% level, that can be a good entry point, especially if the SMA 100 and 200 curves are gathered together at 61.80%, it is a very good entry point. As a great help, TradingView provides these Fibonacci speed fan lines and extension levels with ease. So if you use the Fibonacci fan line, the extension level, and the SMA 100/200 curve well, you can find an entry point for the stock market. At least you have to enter at this low point to avoid trading failure, and if you are skilled at entering this low point, with the fibonacci6180 technique, your reading skill of to chart will be greatly improved. If you want to do day trading, please set the time frame to 5 minutes or 15 minutes, and you will see many of the low points of rising stocks. If you prefer long-term range trading, you can set the time frame to 1 hr or 1 day
fibonacci6180
Coinbase Stock Chart Fibonacci Analysis 090925
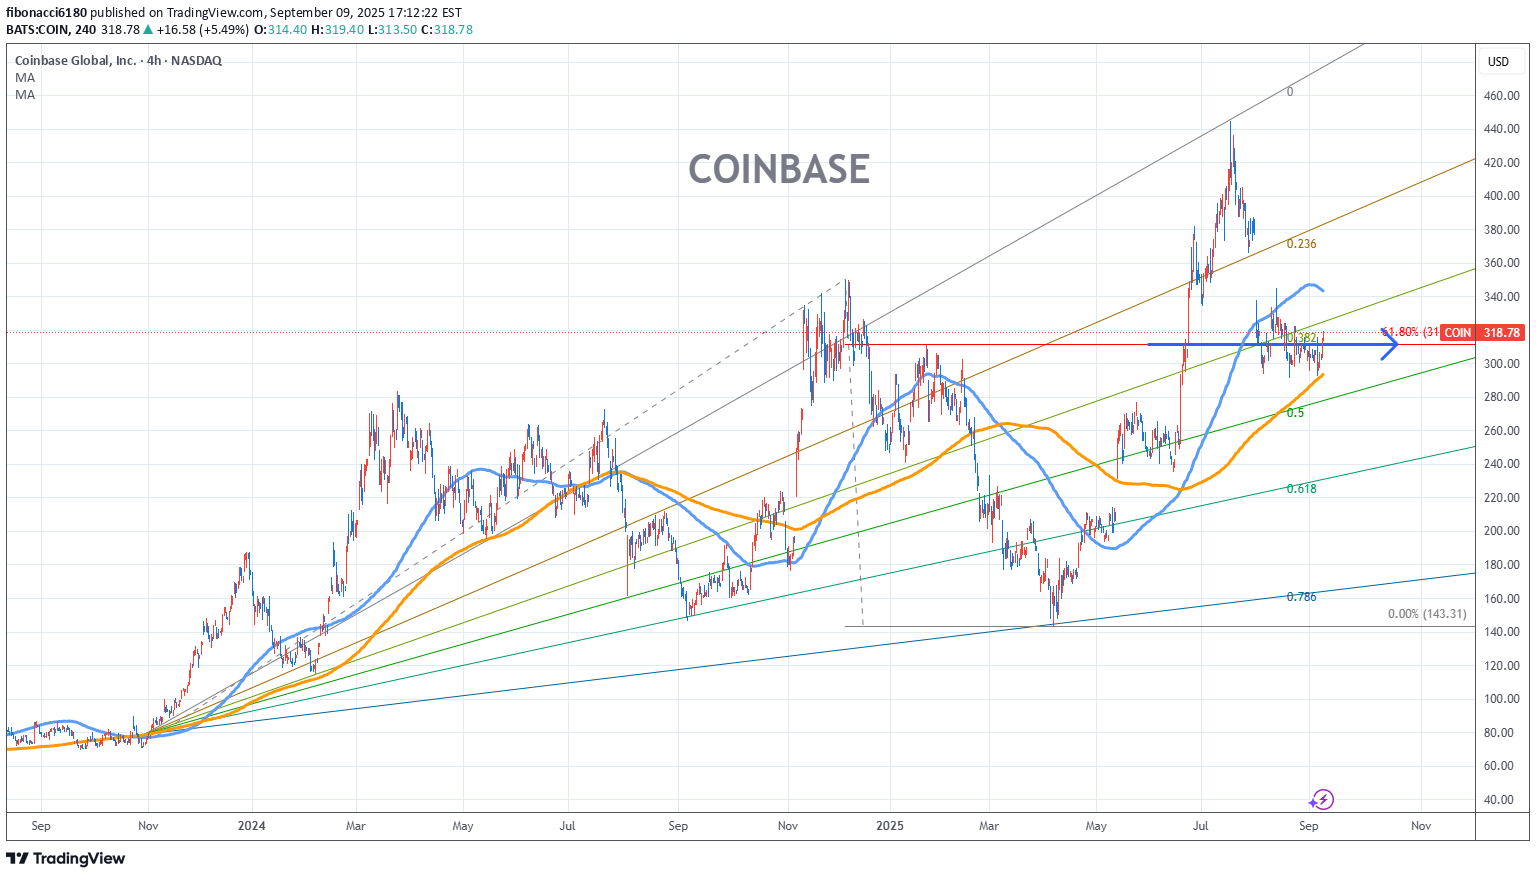
Trading Idea 1) Find a FIBO slingshot 2) Check FIBO 61.80% level 3) Entry Point > 310/61.80% Chart time frame:B A) 15 min(1W-3M) B) 1 hr(3M-6M) C) 4 hr(6M-1year) D) 1 day(1-3years) Stock progress:A A) Keep rising over 61.80% resistance B) 61.80% resistance C) 61.80% support D) Hit the bottom E) Hit the top Stocks rise as they rise from support and fall from resistance. Our goal is to find a low support point and enter. It can be referred to as buying at the pullback point. The pullback point can be found with a Fibonacci extension of 61.80%. This is a step to find an entry-level position. 1) Find a triangle (Fibonacci Speed Fan Line) that connects the high (resistance) and low (support) points of the stock in progress, where it is continuously expressed as a Slingshot, 2) and create a Fibonacci extension level for the first rising wave from the start point of the slingshot pattern. When the current price goes over the 61.80% level, that can be a good entry point, especially if the SMA 100 and 200 curves are gathered together at 61.80%, it is a very good entry point. As a great help, TradingView provides these Fibonacci speed fan lines and extension levels with ease. So if you use the Fibonacci fan line, the extension level, and the SMA 100/200 curve well, you can find an entry point for the stock market. At least you have to enter at this low point to avoid trading failure, and if you are skilled at entering this low point, with the fibonacci6180 technique, your reading skill of to chart will be greatly improved. If you want to do day trading, please set the time frame to 5 minutes or 15 minutes, and you will see many of the low points of rising stocks. If you prefer long-term range trading, you can set the time frame to 1 hr or 1 day
fibonacci6180
Robinhood Stock Chart Fibonacci Analysis 090625
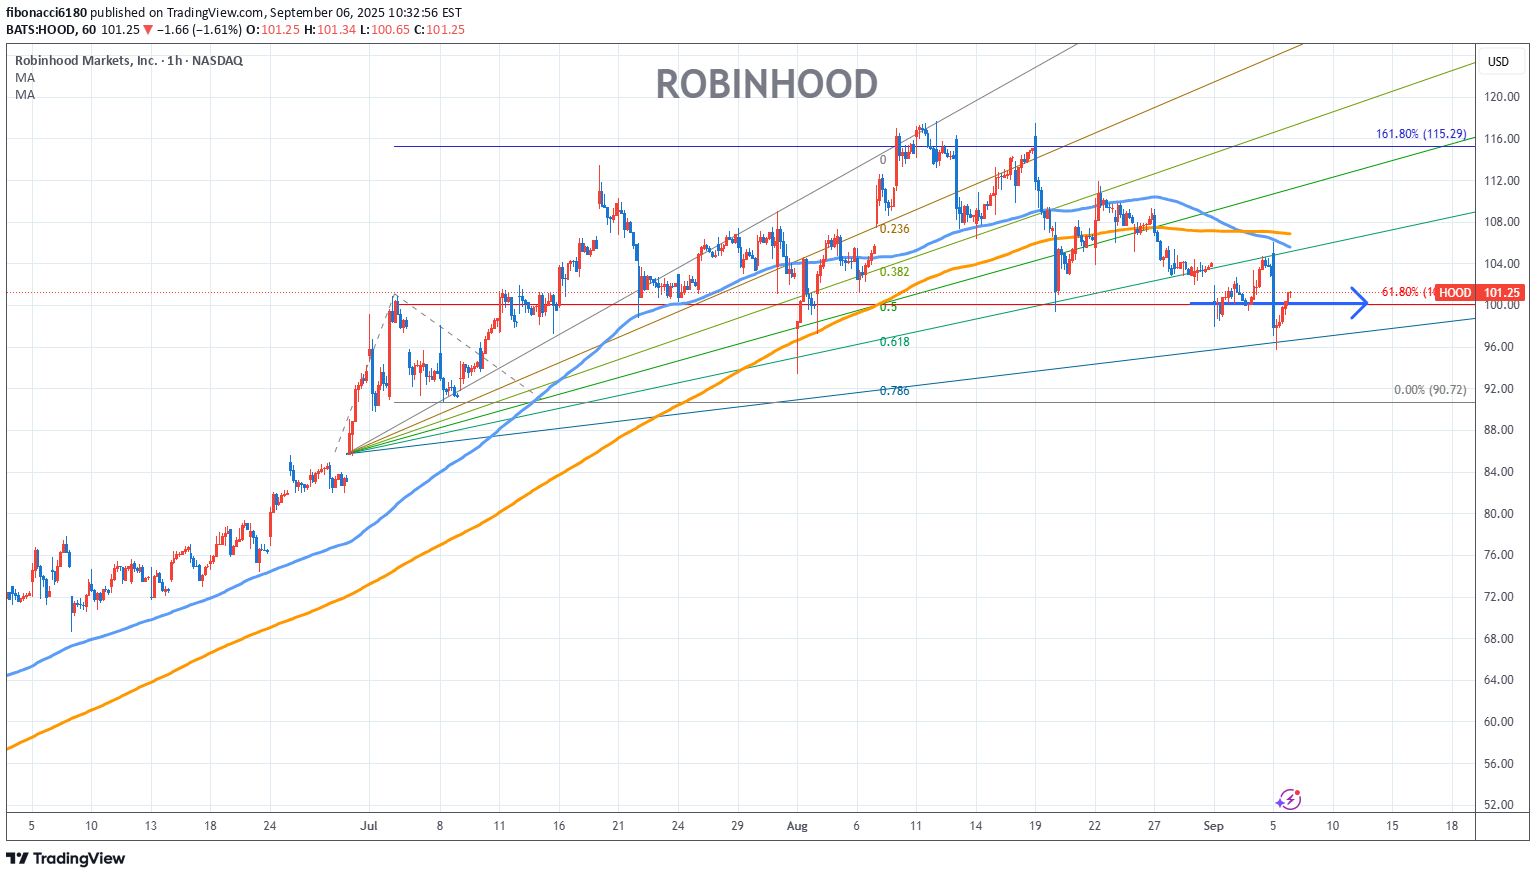
Trading Idea 1) Find a FIBO slingshot 2) Check FIBO 61.80% level 3) Entry Point > 101/61.80% Chart time frame:C A) 15 min(1W-3M) B) 1 hr(3M-6M) C) 4 hr(6M-1year) D) 1 day(1-3years) Stock progress:A A) Keep rising over 61.80% resistance B) 61.80% resistance C) 61.80% support D) Hit the bottom E) Hit the top Stocks rise as they rise from support and fall from resistance. Our goal is to find a low support point and enter. It can be referred to as buying at the pullback point. The pullback point can be found with a Fibonacci extension of 61.80%. This is a step to find an entry-level position. 1) Find a triangle (Fibonacci Speed Fan Line) that connects the high (resistance) and low (support) points of the stock in progress, where it is continuously expressed as a Slingshot, 2) and create a Fibonacci extension level for the first rising wave from the start point of the slingshot pattern. When the current price goes over the 61.80% level, that can be a good entry point, especially if the SMA 100 and 200 curves are gathered together at 61.80%, it is a very good entry point. As a great help, TradingView provides these Fibonacci speed fan lines and extension levels with ease. So if you use the Fibonacci fan line, the extension level, and the SMA 100/200 curve well, you can find an entry point for the stock market. At least you have to enter at this low point to avoid trading failure, and if you are skilled at entering this low point, with the fibonacci6180 technique, your reading skill of to chart will be greatly improved. If you want to do day trading, please set the time frame to 5 minutes or 15 minutes, and you will see many of the low points of rising stocks. If you prefer long-term range trading, you can set the time frame to 1 hr or 1 day
fibonacci6180
Meta Stock Chart Fibonacci Analysis 090425
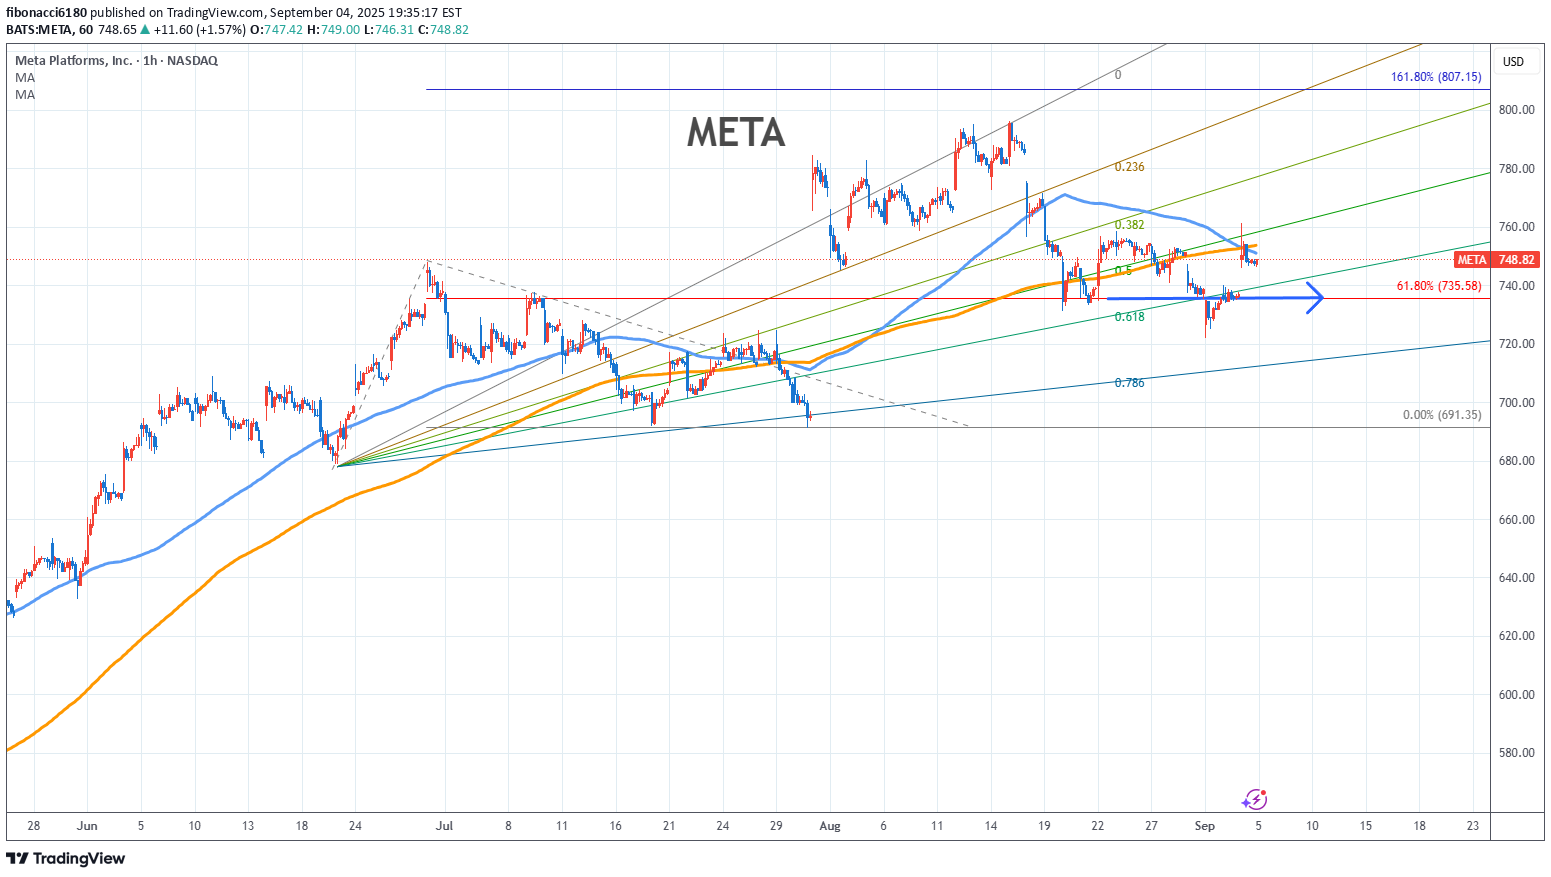
Trading Idea 1) Find a FIBO slingshot 2) Check FIBO 61.80% level 3) Entry Point > 736/61.80% Chart time frame:B A) 15 min(1W-3M) B) 1 hr(3M-6M) C) 4 hr(6M-1year) D) 1 day(1-3years) Stock progress:A A) Keep rising over 61.80% resistance B) 61.80% resistance C) 61.80% support D) Hit the bottom E) Hit the top Stocks rise as they rise from support and fall from resistance. Our goal is to find a low support point and enter. It can be referred to as buying at the pullback point. The pullback point can be found with a Fibonacci extension of 61.80%. This is a step to find an entry-level position. 1) Find a triangle (Fibonacci Speed Fan Line) that connects the high (resistance) and low (support) points of the stock in progress, where it is continuously expressed as a Slingshot, 2) and create a Fibonacci extension level for the first rising wave from the start point of the slingshot pattern. When the current price goes over the 61.80% level, that can be a good entry point, especially if the SMA 100 and 200 curves are gathered together at 61.80%, it is a very good entry point. As a great help, TradingView provides these Fibonacci speed fan lines and extension levels with ease. So if you use the Fibonacci fan line, the extension level, and the SMA 100/200 curve well, you can find an entry point for the stock market. At least you have to enter at this low point to avoid trading failure, and if you are skilled at entering this low point, with the fibonacci6180 technique, your reading skill of to chart will be greatly improved. If you want to do day trading, please set the time frame to 5 minutes or 15 minutes, and you will see many of the low points of rising stocks. If you prefer long-term range trading, you can set the time frame to 1 hr or 1 day
fibonacci6180
Tesla Stock Chart Fibonacci Analysis 090425
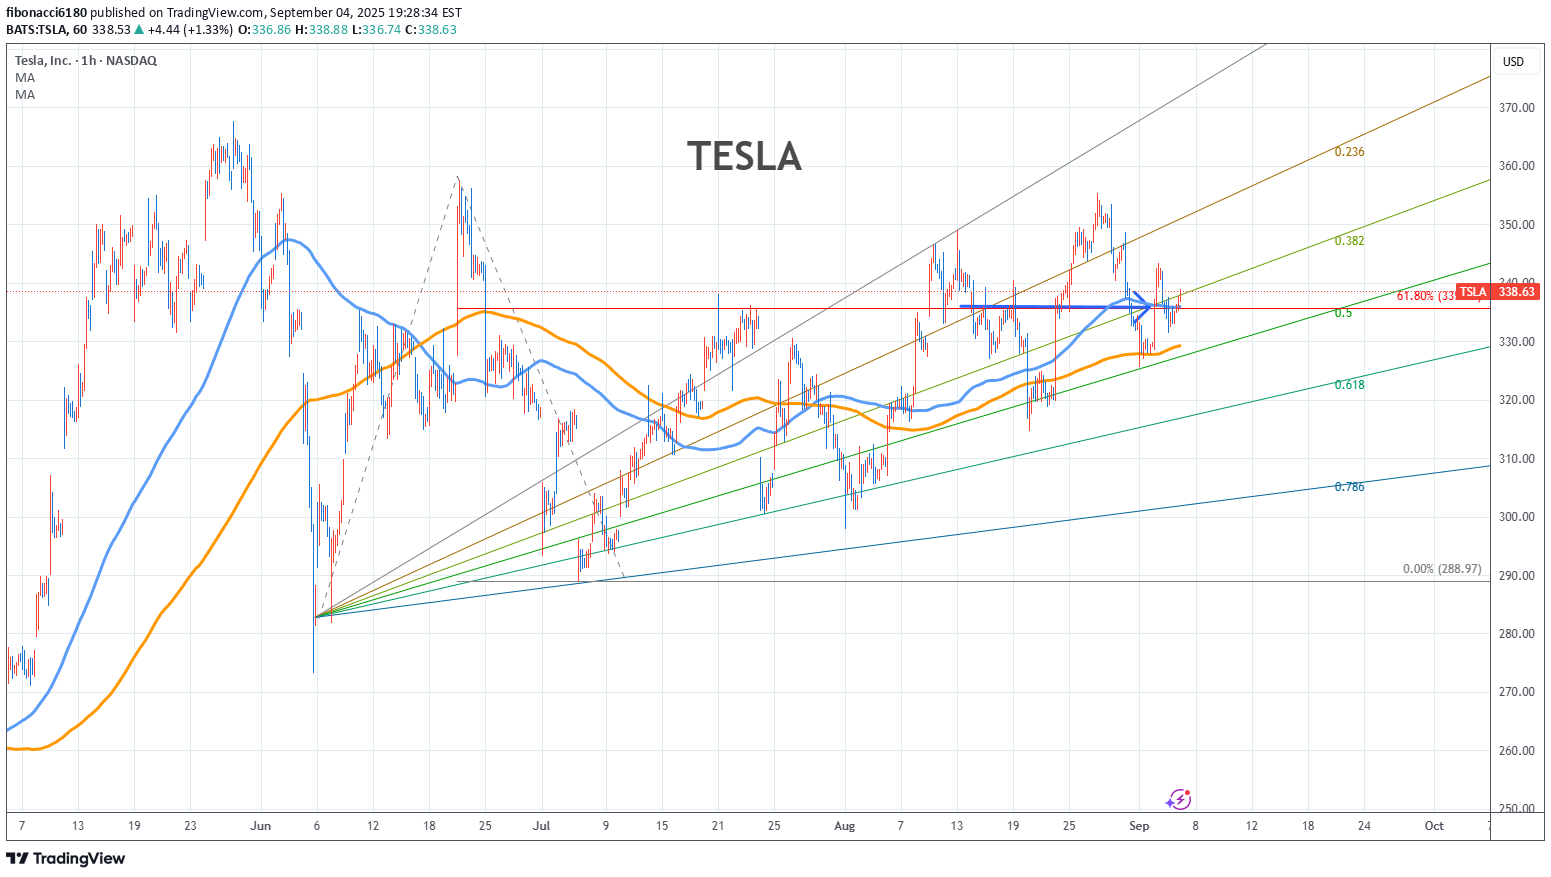
Trading Idea 1) Find a FIBO slingshot 2) Check FIBO 61.80% level 3) Entry Point > 335/61.80% Chart time frame:B A) 15 min(1W-3M) B) 1 hr(3M-6M) C) 4 hr(6M-1year) D) 1 day(1-3years) Stock progress:A A) Keep rising over 61.80% resistance B) 61.80% resistance C) 61.80% support D) Hit the bottom E) Hit the top Stocks rise as they rise from support and fall from resistance. Our goal is to find a low support point and enter. It can be referred to as buying at the pullback point. The pullback point can be found with a Fibonacci extension of 61.80%. This is a step to find an entry-level position. 1) Find a triangle (Fibonacci Speed Fan Line) that connects the high (resistance) and low (support) points of the stock in progress, where it is continuously expressed as a Slingshot, 2) and create a Fibonacci extension level for the first rising wave from the start point of the slingshot pattern. When the current price goes over the 61.80% level, that can be a good entry point, especially if the SMA 100 and 200 curves are gathered together at 61.80%, it is a very good entry point. As a great help, TradingView provides these Fibonacci speed fan lines and extension levels with ease. So if you use the Fibonacci fan line, the extension level, and the SMA 100/200 curve well, you can find an entry point for the stock market. At least you have to enter at this low point to avoid trading failure, and if you are skilled at entering this low point, with the fibonacci6180 technique, your reading skill of to chart will be greatly improved. If you want to do day trading, please set the time frame to 5 minutes or 15 minutes, and you will see many of the low points of rising stocks. If you prefer long-term range trading, you can set the time frame to 1 hr or 1 day
Disclaimer
Any content and materials included in Sahmeto's website and official communication channels are a compilation of personal opinions and analyses and are not binding. They do not constitute any recommendation for buying, selling, entering or exiting the stock market and cryptocurrency market. Also, all news and analyses included in the website and channels are merely republished information from official and unofficial domestic and foreign sources, and it is obvious that users of the said content are responsible for following up and ensuring the authenticity and accuracy of the materials. Therefore, while disclaiming responsibility, it is declared that the responsibility for any decision-making, action, and potential profit and loss in the capital market and cryptocurrency market lies with the trader.