
ThetaNomad
@t_ThetaNomad

Ne tavsiye etmek istersiniz?
önceki makale
پیام های تریدر
filtre
ThetaNomad
AVAX - LONG - SQUEEZE TRAIN LOADING
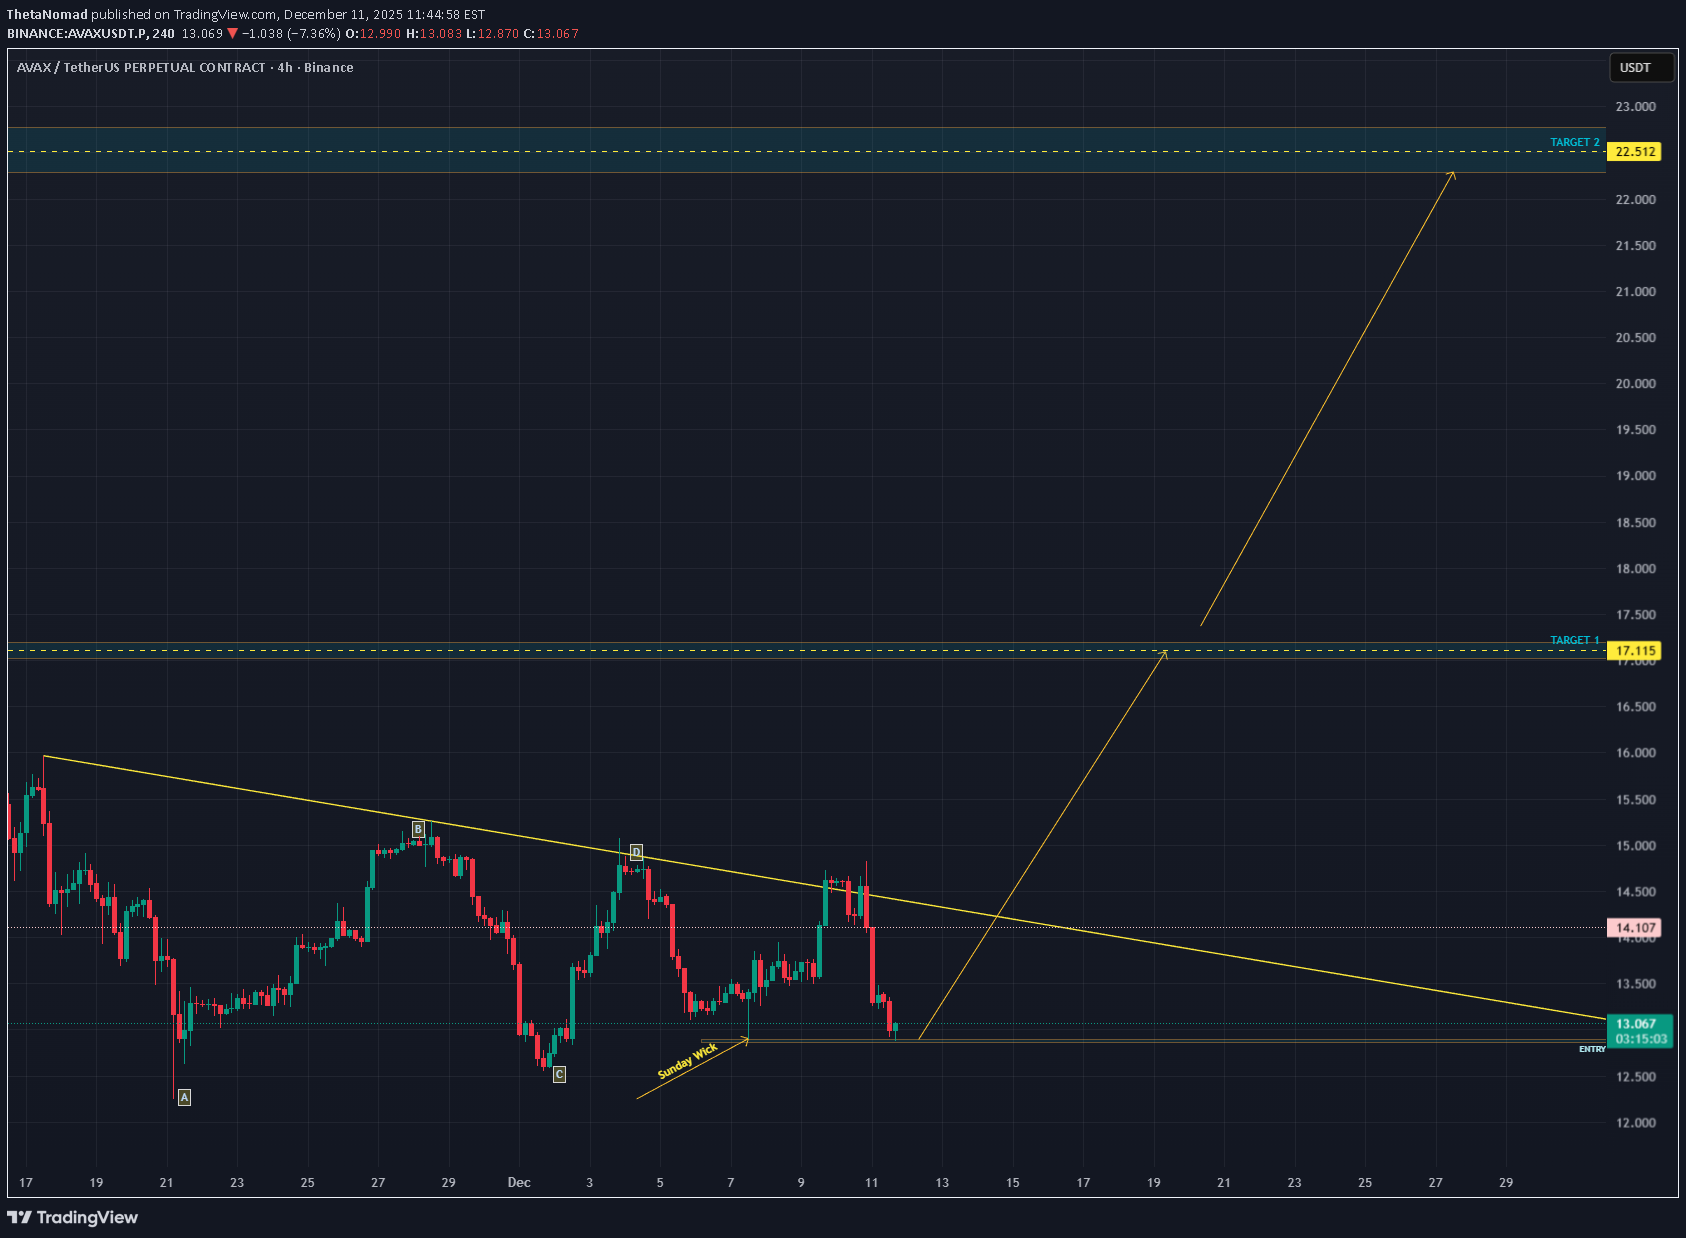
Tüccarlar, inanıyorum AVAX bir sıkma trenini yukarıya doğru yüklemeye hazırlanıyor. Bu move hızlı, hızlı ve sert olabilir; tacirleri hazırlıksız yakalayan ve geç pozisyonlarda ne olduğunu merak etmelerine neden olan türden bir tersine dönüş olabilir. Fiyat, iki ayrı Fibonacci geri çekilmesinin hizalandığı deep destek bölgesine geri döndü. A ayağından B ayağına kadar olan 0,786 seviyesi tam olarak şu anki fiyat seviyesinde bulunuyor. C'den D'ye kadar olan 0,886 seviyesi aynı yere iniyor. İki bağımsız lif bacağı bu şekilde birleştiğinde, bu genellikle daha güçlü ellerin sessizce konumlanıp beklediği yüksek ilgi alanına işaret eder. Bu bölgeye ulaşmadan önce pazar Pazar fitilini süpürdü. Pazar fitilleri, anlamlı bir kurumsal varlığın olmadığı zayıf hafta sonu hacmi sırasında yaratılıyor. form Zayıf likiditeye sahip oldukları için, piyasa, gerçek hacim geri geldiğinde bunları yeniden ziyaret etme ve temizleme eğilimindedir. Bu fitili süpürmek zayıf hafta sonu pozisyonlarını ortadan kaldırdı, yapıyı temizledi ve sürdürülebilir move için gereken likiditeyi topladı. Sipariş Flow sıraya giriyor. Spot alıcılar satışları yoğunlaştırırken, perp trader'ları düşük seviyelere kısa pozisyon veriyor. Spot CVD artıyor, bu da gerçek talebi gösteriyor. Hem coin marjlı hem de stablecoin marjlı CVD düşüyor, bu da kaldıraçlı kısa pozisyonların aşağı doğru baskı yaptığını gösteriyor. Net Şortlar dipte artıyor. Aynı zamanda Açık Faiz de artıyor. Bu, yeni kısa pozisyonların kapanmak yerine açıldığını doğruluyor. Spot birikimi deep fib desteğinde kaldıraçlı kısa baskıyla karşılaştığında, bir sıkışma için ortam hazırlanır. Yukarıdaki ilk hedef A'dan B'ye olan ayağın 1.618'lik uzantısıdır. Bu, deep 0,786'lık bir geri çekilme sonrasında beklenen devam seviyesidir. Ayrıca grafiği temiz tutmak için burada gösterilmeyen daha yüksek bir zaman dilimi olan 0,786 düzeyine de uygundur. Hedefteki birleşme yer çekimini güçlendirir. AVAX likiditeyi süpürdü, güçlü fib birleşiminden yararlandı ve geç dönemdeki açığa satışları yapıya çekti. Hızlı bir yukarı yönlü sıkışma için gereken tüm bileşenler mevcuttur. Özet • İki lif gerilemesi mevcut seviyede buluşuyor • Zayıf hafta sonu pozisyonlarını ortadan kaldıran Pazar fitili süpürüldü • Gerçek alımı gösteren spot CVD yükselişi • Perp Kaldıraçlı kısa baskıyı gösteren CVD düşüşü • Net Kısa Pozisyonlar en düşük seviyelerden yükseliyor • Yeni kısa pozisyon açılışını doğrulayan Açık Pozisyon yükselişi • Sıkıştırma koşullarının oluşması • İlk hedef A'nın B'ye 1.618 uzatılması • Bu hedef daha yüksek bir zaman dilimi olan 0,786'ya uygundur Son Düşünce Piyasa niyetini haykırmıyor. Yapısı, flow ve birleşimi aracılığıyla fısıldıyor. Deep geri çekilmeler, temizlenmiş likidite ve hasta birikimi genellikle ani genişlemeden hemen önce ortaya çıkar. AVAX Tonunu değiştirmeye hazır hissediyor ve bu gerçekleştiğinde, alçakta toplanan şortlar kendilerini sıkışık trenin yanlış yolunda giderken bulabilir. Hedefler ve Geçersiz Kılma İlk hedefim, A'dan B'ye ayağın 1,618'lik uzantısıyla aynı hizada olan ve klasik deep geri çekilme devamının yapısına uyan 17,115'tir. İkinci hedefim 22,5, aşağı doğru giderken geride bırakılan orta seviye likidite ile güzel bir şekilde bağlantı kuran ve ilk hedef temizlendiğinde doğal bir genişleme noktası görevi gören bir seviye. Orta ve uzun vadede, doğrudan daha yüksek bir zaman dilimi verimsizlik bölgesinin içinde yer alan ve basit bir düzeltici sıkışıklıktan ziyade gerçek trend devamının başlangıcını işaret eden 31.25'i izliyorum. Geçersiz kılma, A noktasının en düşük seviyesi olan 12.275'te bulunuyor. Fiyat bu seviyenin altına düşerse, mevcut fikrin yapısı çöker ve kurgu artık sıkışma anlatısına uymaz. Bu seviye ihlal edilene kadar yükseliş yapısı bozulmadan kalır ve en az direnç yolu yukarı doğru devam eder. ---------------- Bu analizi beğendiyseniz beğenmeyi veya yorum bırakmayı unutmayın. Ben para istemiyorum ve hiçbir şey satmaya çalışmıyorum. İnsanların gürültünün içinden bakıp kaosun altındaki yapıyı anlamalarına yardımcı olmaktan keyif alıyorum.
ThetaNomad
بیتکوین در آستانه تصمیم بزرگ: صعود به سقف جدید یا سقوط آزاد تا ۶۴ هزار دلار؟
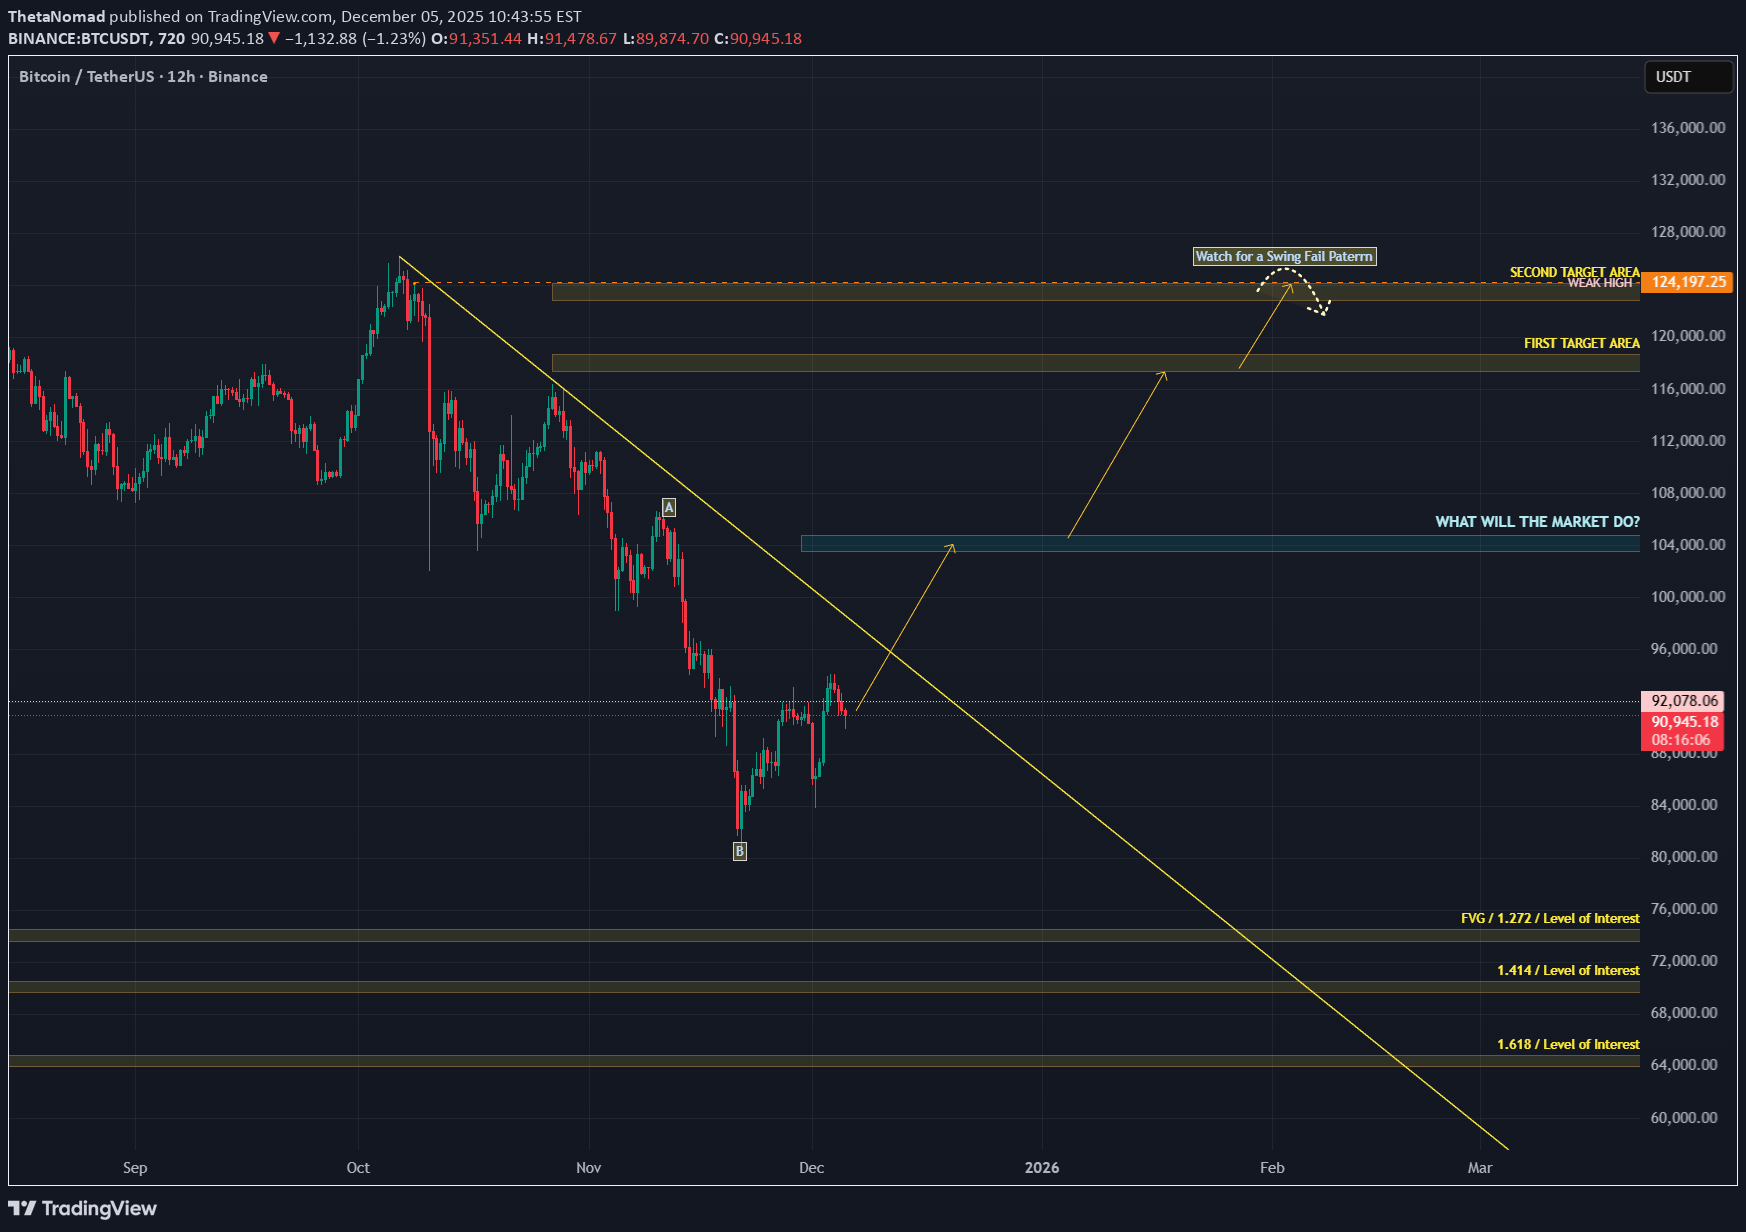
Traders, We dumped. Now Bitcoin is grinding through a controlled recovery. The important question is not simply if we move higher. The real question is where the market will reveal its true intention. The chart is giving us a very clean map and the next major decision point is already forming. 1. The structure so far Bitcoin sold off aggressively, found real buyers, and reclaimed the breakdown wick. That reclaim shows that the low was bought by spot demand rather than mechanical short covering. Price is now pushing into a zone where the next expansion will be decided. The recovery itself is not the interesting part. The levels above and below are. 2. The major checkpoint above: 104k to 105k This zone is extremely important. Two strong pieces of confluence meet here: The 0.886 of the A to B retracement The 1.618 extension of the impulse move you marked with the arrows This creates a clean Potential Reversal Zone. What this means: If the market rejects 104k to 105k structurally, the next major destination becomes the lower imbalance cluster around 64k. That would be a true higher timeframe unwind because the entire path down is filled with thin volume and inefficient price action. If Bitcoin breaks above 105k with flow support, then the next magnets open up immediately. 3. Targets above If price accepts above the 104k to 105k PRZ: First target area Around 116k to 118k where we have a liquidity pocket and HTF inefficiencies. Second target area 123k to 125k where a swing failure pattern is very likely. This is a weak high with resting liquidity and a natural magnet for price during bullish expansions. At target two I expect the first serious reaction because of the liquidity sitting above the weak high. 4. Order flow confirms accumulation not distribution Looking at the CVD grids: Spot CVD is trending lower while price holds steady. This is a sign of absorption because someone is taking the other side of the selling. Stablecoin margined CVD continues lower but without price following. Coin margined CVD is sweeping lows with no breakdown in price. This creates a hidden bullish divergence across the board. Open interest also supports this view: Stablecoin margined OI remains high which means traders did not exit during the dump. Coin margined OI is slowly building which often appears before directional expansion. This is not the profile of a market preparing for distribution. It is the profile of a market preparing for a move. 5. CME chart: AVWAP support from the last major swing On CME, the AVWAP anchored from the previous major swing low to swing high is still holding as support. CME often leads during inflection zones. As long as this AVWAP holds, the market is positioned in a continuation PRZ rather than a breakdown PRZ. If CME loses this AVWAP, the cascade scenario strengthens. As long as it holds, the bullish structure remains intact. 6. What happens if we break down instead if Bitcoin fails to reclaim structure and breaks back down, the following levels become active: 83k to 84k This is the shallow retrace zone and the first structural catch. 81k to 82k This area contains the 1.113 extension and a previously unfilled FVG. 79k to 80k This is the 1.272 level and a strong imbalance pocket. 72k to 73k This contains the 1.414 extension and the next clean liquidity cluster. 64k This is the 1.618 extension and the final major downside target. It aligns with the strong HTF imbalance that has never been fully tested. A rejection from 104k to 105k can eventually lead price through these levels in sequence because the entire zone from 90k down to 70k contains thin volume. There is not much structural support built on the way up. 7. Real time confirmation tools Watch these signals when we approach the 104k to 105k decision zone: Spot CVD rising means continuation likelihood increases Funding staying negative means shorts are still stuck OI rising with price means momentum is building CVD stalling or rolling over at 104k to 105k means rejection risk is high CME AVWAP reclaim or failure will guide direction If buyers hold flow above 105k, the path to 117k and then 124k is clean. If buyers fail and we reject 105k with aggressive selling, the path down becomes active. Final view Bitcoin is approaching one of the most important technical levels on the chart. We dumped on real flow. We recovered on spot demand. Now the market is converging toward the 104k to 105k PRZ where a true decision will be made. Break above and the next magnets are 117k and 124k with a likely swing failure at the second target. Reject and the lower zones activate with 64k as the eventual HTF destination. This is the map. The levels are clear. TLDR BTC is recovering with spot support 104k to 105k is the major PRZ Break above: targets at 116k to 118k and 123k to 125k Reject here: downside levels at 83k, 82k, 80k, 73k and 64k Order flow is showing hidden bullish divergence CME AVWAP is holding which keeps the bullish narrative alive The market leaves its footprints long before it shows its direction. Read the sands, follow the flow and stay prepared. - ThetaNomad ---------------------------------------------- If you enjoy this style of analysis feel free to leave a like or comment. It lets me know you find value in these deeper structural and flow based breakdowns. ----------------------------------------------
ThetaNomad
POLKADOT – LONG SETUP - LOADING SHORT SQUEEZE POTENTIAL
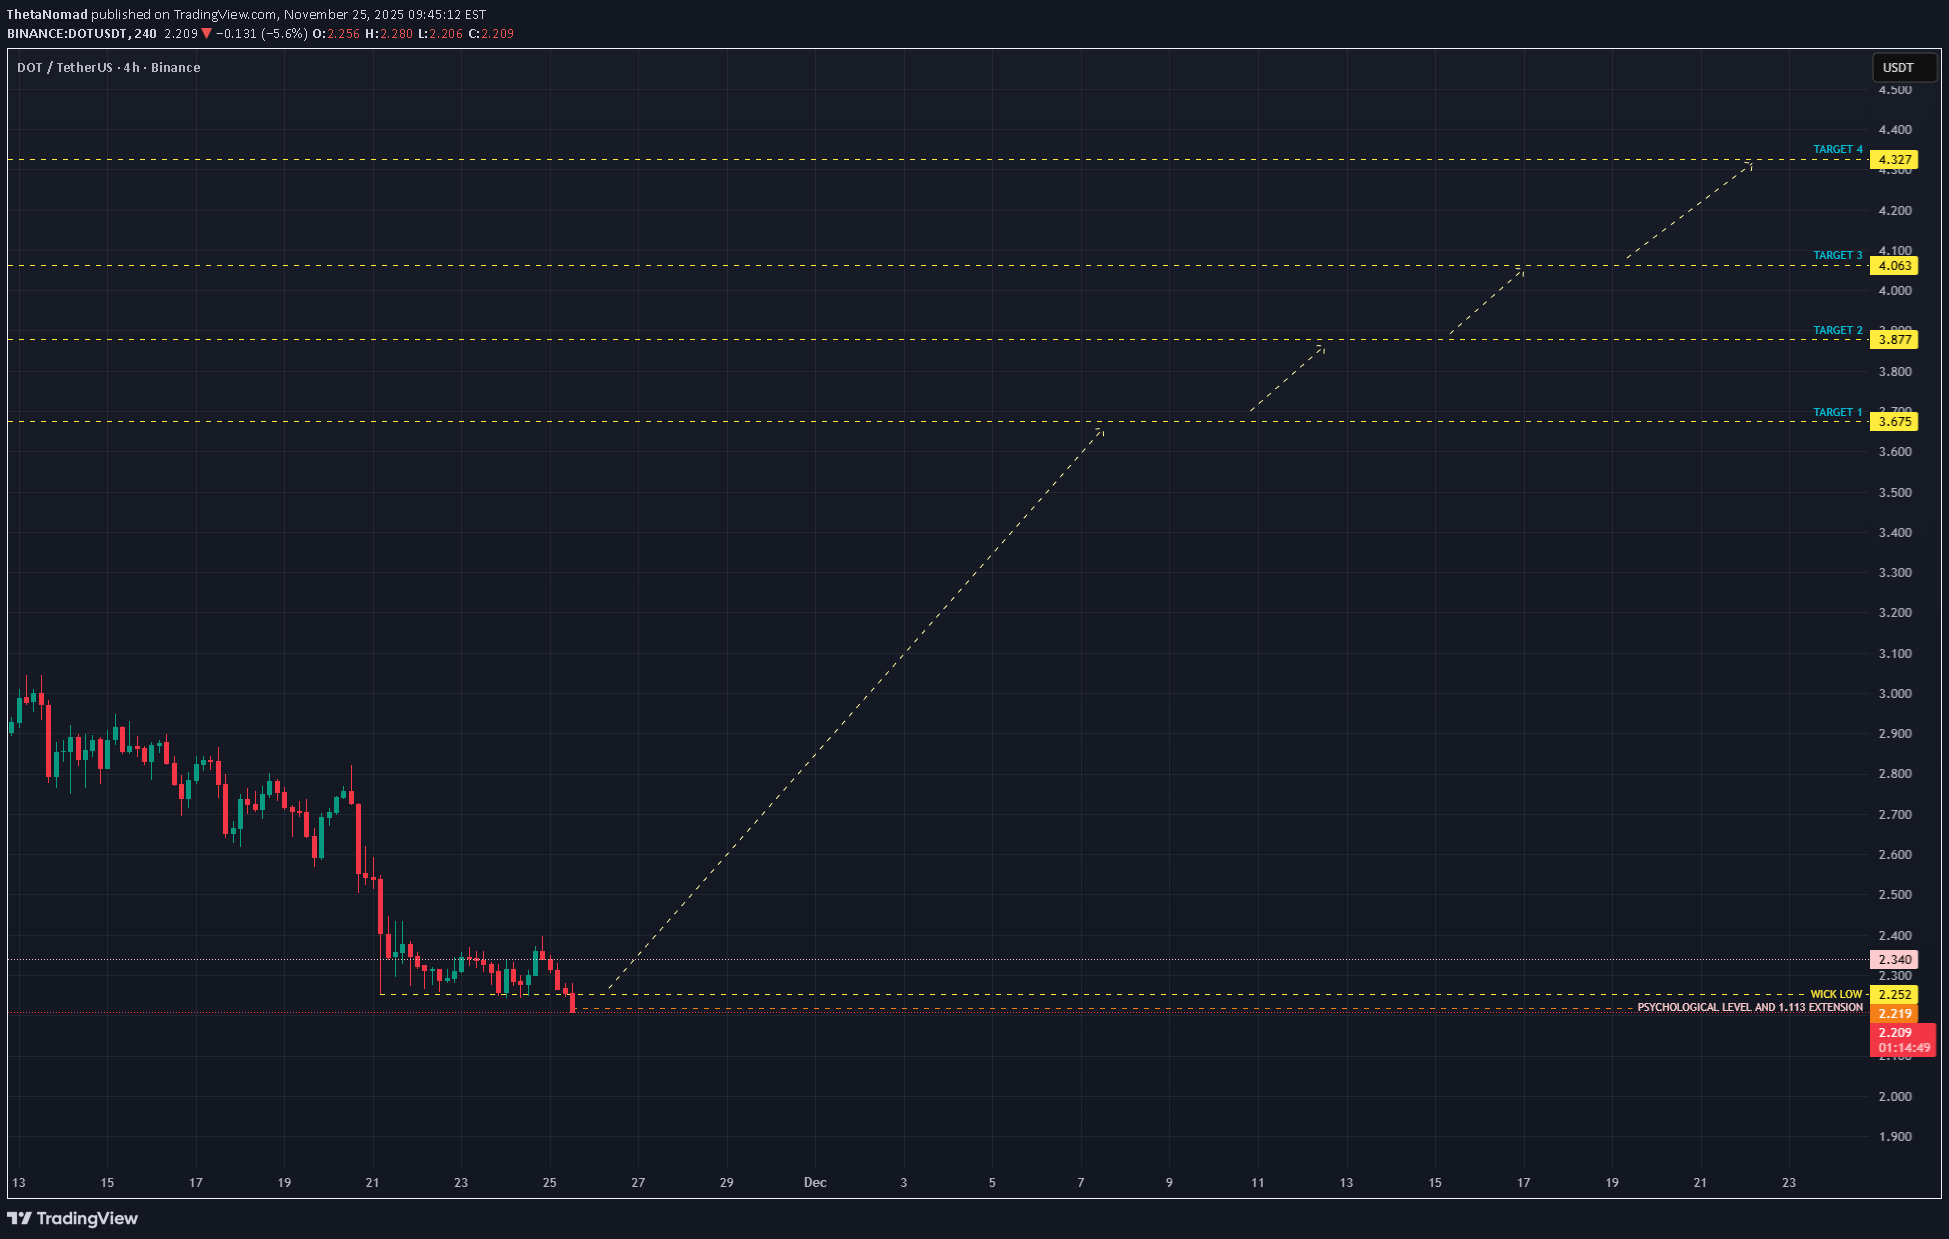
Tüccarlar, $Polkadot Yüksek olasılıklı uzun bir kurulum oluşturmaya yakın ancak henüz doğrulanmadı. İşte kompakt döküm. DOT NEDEN KURULUYOR 08 Kasım'dan bu yana fiyatlar düşüyor Spot CVD, Coin Margined CVD ve Stablecoin Margined CVD'nin tümü fiyatla düştü ve bu da gerçek satış baskısını doğruladı 21 Kasım'da en düşük seviyeler süpürüldü Bugün fiyat pivot seviyesi olan 2.220'ye dokundu ve tepki gösterdi Ancak hala 2.250 seviyesinin altında işlem görüyoruz, bu da sıkıştırma kurulumunun henüz aktif olmadığı anlamına geliyor Süpürme neden önemlidir? Bybit'te yaklaşık 915.000 Coin Margined kısa sözleşmeler düşük seviyelere açıldı. Coin Margined short'lar teminat olarak DOT kullanır; bu da DOT yükseldiğinde çift vuruş aldıkları anlamına gelir. Açığa çıkanlar değer kaybeder ve teminatları da değer kaybeder. Bu, fiyat tersine döndüğünde tasfiye edilmelerini çok daha kolay hale getirir. Ancak fiyatın bu etkiyi tetikleyebilmesi için kilit seviyeyi geri kazanması gerekiyor. ANAHTAR SEVİYELER 2,220 = pivot Fiyatın tepki gösterdiği yer burası Bu, 4 Kasım'dan 08 Kasım'a kadar olan sürenin 1.113 uzantısıdır move Bu, aşağı yönlü rotasyonun tamamlandığını gösterir 2,250 = tetikleyici Bu, geri kazanılması ve üzerinde işlem yapılması gereken fiyattır 2.250'nin üzerindeki şortlar su altına inmeye başlıyor 2.250 seviyesinin üzerinde sıkışma aktif oluyor kadar $Polkadot 2.250'nin üzerinde işlem görüyor, kurulum henüz onaylanmadı. OYUN PLANI Mumun 2.250'nin üzerinde 30 dakikalık iki kapanışını bekleyin Bu, geri kazanımı onaylar ve uzun kurulumu etkinleştirir 2,240 ila 2,250 bölgesinin yeniden test edilmesini bekleyin Alıcılar bu yeniden testi savunursa, bu temiz bir giriş olur DOT 2,250'nin altında kaldığı sürece bu yalnızca potansiyel bir kurulumdur 2.200 seviyesinin altına düşmek fikri zayıflatıyor ve yeniden değerlendirme gerektiriyor HEDEFLER DOĞRULANIRSA Eğer $Polkadot 2.250'yi geri aldı. Yukarı hedefler şöyle: 3.675 3.877 4.063 4.327 Her seviye, momentumu ve yapıyı yeniden değerlendirmek için bir noktadır. SON GÖRÜNÜM DOT alçakları taradı ve büyük bir Madeni Para Kenarlı şort bloğunu tuzağa düşürdü. 2,220'deki pivota dokunuldu ancak gerçek tetikleyici 2,250'dir. Yalnızca fiyat geri kazanıldığında ve 2.250 seviyesinin üzerinde işlem gördüğünde sıkıştırma yapısı aktif hale gelir. O zamana kadar bu, onay gerektiren potansiyel yüksek olasılıklı bir kurulum olarak kalacak. Mumlar yeniden konuşana kadar, ThetaNomad ------------ Bu, akışı okumanıza yardımcı olduysa bir beğeni ve yorum bırakın Bunların hiçbiri finansal tavsiye değil. 2,1800'e ulaştık. 2,2800'ün üzerine daha fazla eklenecek. Fiyat artık günlük VWAP'ye geri alındı.#DOT #TradingRecap Dünkü ticareti özetleyelim. Grafik kırmızıya boğulurken tüm planı hazırladım, ancak yine de yapı piksel doğruluğuyla oynandı. 2,1818 dolarda bekledi Girişi önceden planladım, burada TradingView'de canlı yayınlayın. Sıkışan şortları vurguladı Bybit kısalarının genellikle kendi kendini sabote ettiğine dikkat çekti. -> move'yi adım adım açıkladı: -> dürtü → geri kazanım → 2,250'nin yeniden test edilmesi → devam. Ve evet, piksele kadar oynandı -> Durağımı başabaş noktasına kaydırdım, geri kalanını bedava bir yolculuğa dönüştürdüm -> Bundan sonra ne olursa olsun, benim işim zaten bitti. -> Artık kaybedemem — gerisi sadece piyasanın kendi sesini fısıldıyor story. İşte bu yüzden SL'nizi her zaman biraz kâra veya başa baş noktasına koyarsınız. Durduruldum ama küçük bir kârla!
ThetaNomad
BITCOIN - PRESSURE BUILDING - SHORT SQUEEZE INCOMING?
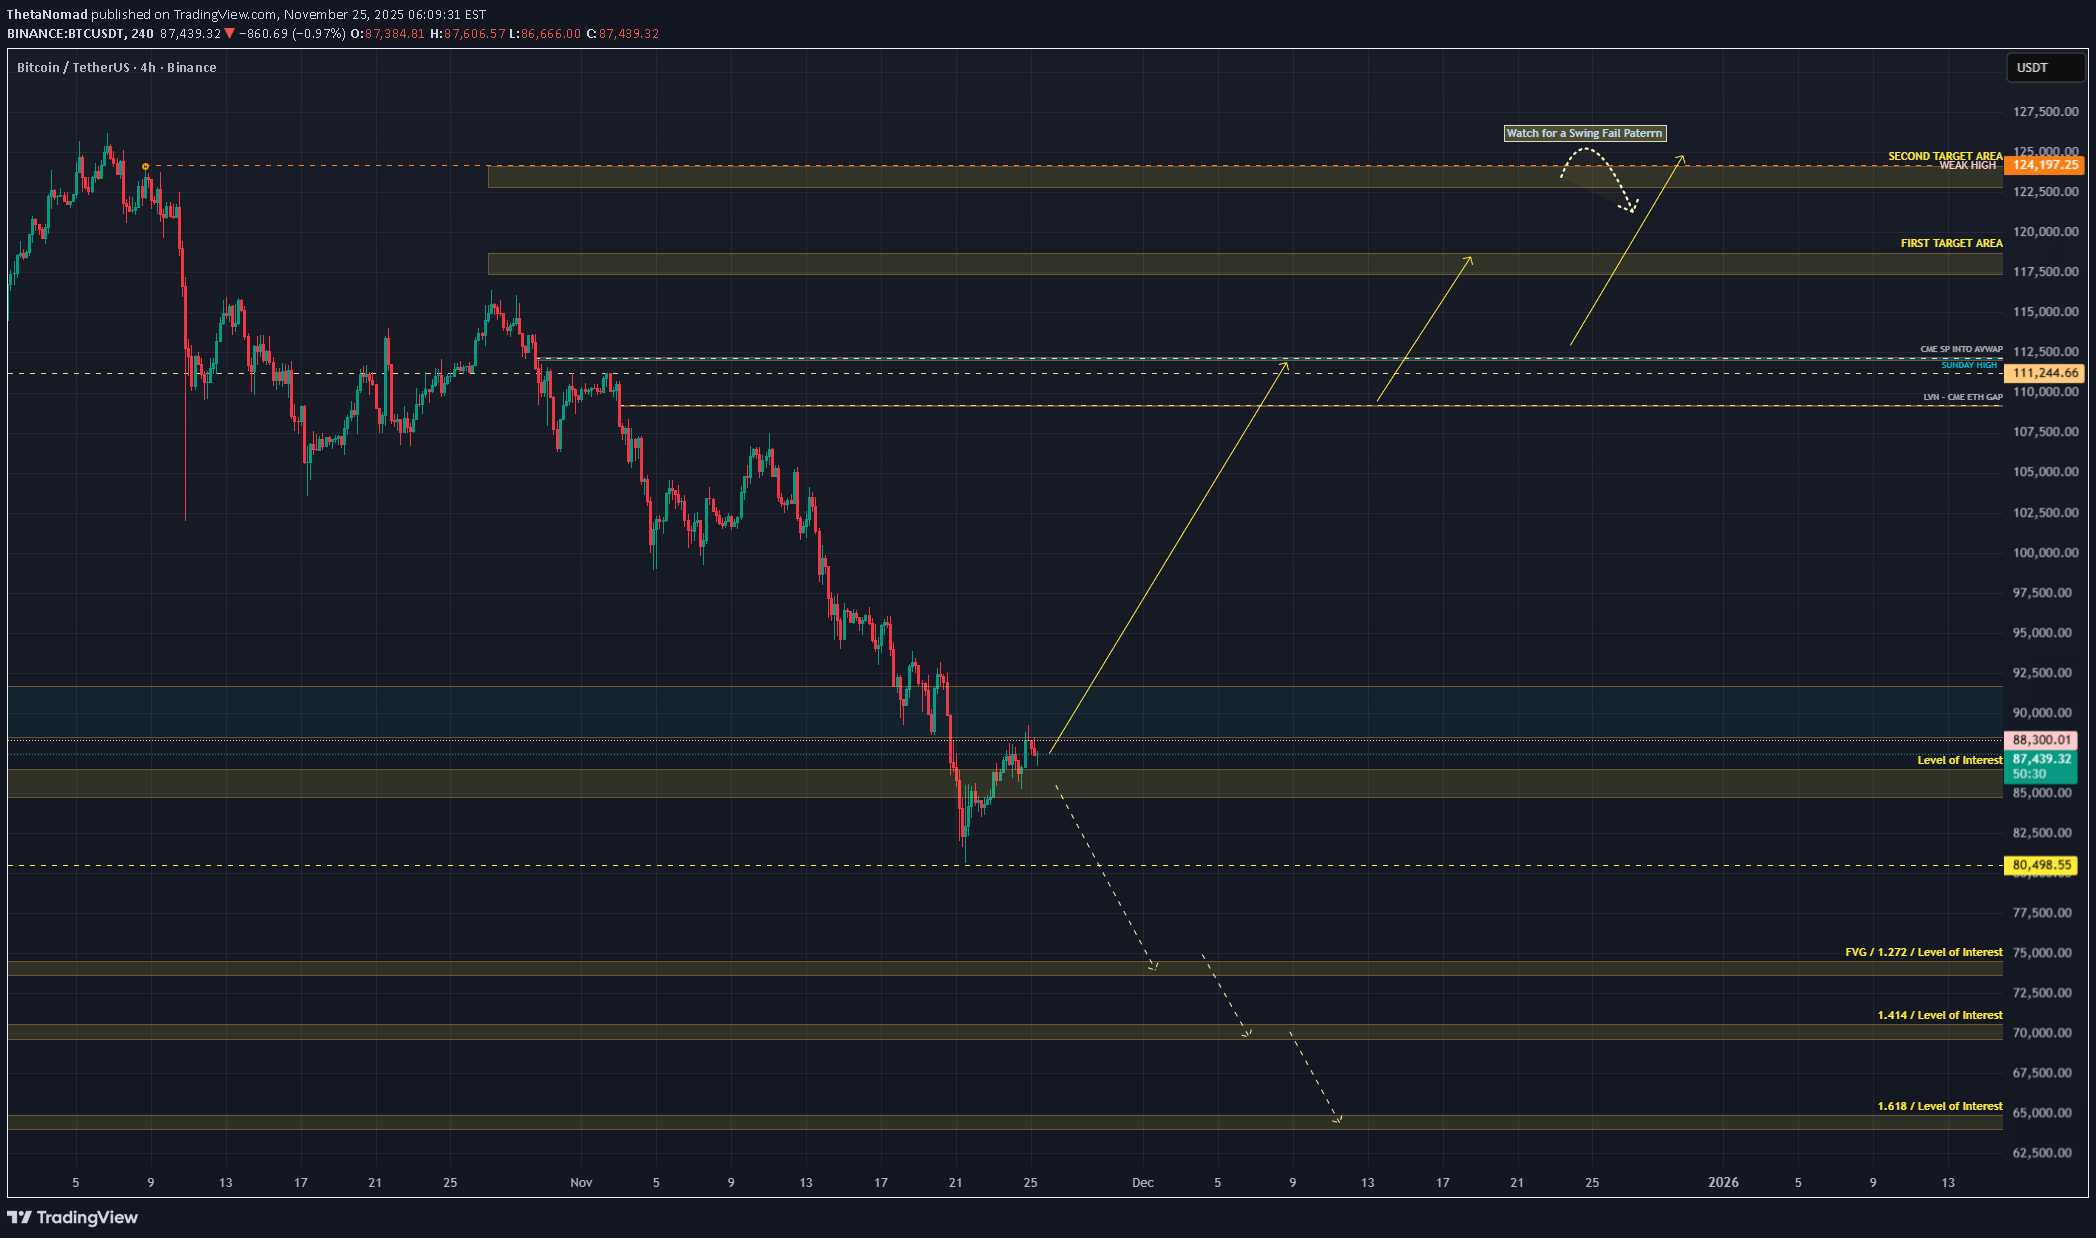
Traders, Bitcoin might be preparing a short squeeze. Let’s walk through the flow, structure, math, and correlations step-by-step so you understand what is happening and why it matters. 1. What Happened Bitcoin dumped from 96k → 80.6k last week. Price then bounced and is now trading around 87k. Under the surface: Stablecoin-Margined Futures (USDT-M) Since 27 Oct: OI increased from 225k → 280k contracts That’s +55k contracts (~24% increase) CVD went down, not up Meaning: These new positions were mostly shorts The market added leveraged short exposure during the dump Interpretation: USDT-M traders attacked the move lower aggressively. Increasing OI + dropping CVD = new sellers dominating, not buyers. Coin-Margined Futures (BTC-M) Since 27 Oct: OI and CVD both dropped from 7.41B → 5.90B BTC-M is usually “higher conviction” demand A drop in BTC-M CVD means Longs closing Capitulation Reduced bullish positioning Interpretation: Native BTC longs stepped aside. Short-term leverage traders pressed the downside. Spot + Futures CVD (27 Oct → 21 Nov) Spot CVD ↓ Futures CVD ↓ Price ↓ All making lower lows and lower highs This was a clean, correlated downtrend. 2. The First Major Shift: Spot CVD Divergence Since 21 November: Spot CVD: Higher highs Higher lows Rising together with price Indicates real demand stepping in Stablecoin Futures (USDT-M): Still making lower lows Still pressing shorts Still fighting the spot buyers This is the key: Spot = real money Futures = leveraged speculation Rising spot CVD vs falling futures CVD = absorption pattern Meaning: Strong hands buy Weak shorts keep selling Price rises anyway The pressure builds Shorts eventually run out The squeeze begins This is one of the cleanest pre-squeeze structures you can get. 3. The Math: Fibonacci Rotation Logic Let’s break down the structure. (A → B → C Structure) A = 116k (27 Oct) B = 98.710 C = 107.403 (retracement) The retrace sits at 0.5. The reciprocal extension is 2.0 The 2.0 extension lands exactly at the 21 Nov wick (~81k) This is a perfect harmonic rotation. (X → Z → A Extension) X = 06 Oct high Z = 18 Oct low A = 27 Oct high Fibonacci extension from X → Z → A: 1.618 extension = 80.544 It matches the 2.0 from the ABC structure It matches the 0.886 retracement on the HTF Three independent mathematical signals hitting the same level. This is extremely rare and confirms the 81k zone as a rotation completion. 4. Structure Break Since the 10 Nov low: 4H is making higher highs & higher lows The descending trendline from 11 Nov is broken Trend shifted from controlled downtrend → early reversal Structure now favors continuation upwards as long as higher lows hold Interpretation: Sellers who relied on the trendline no longer have control. 4.5 Intermarket Correlation: Why Bitcoin Dumped When ES Dumped Another important factor: Bitcoin dumped because ES dumped. From 12 Nov → 21 Nov: S&P500 (ES) Dropped from 6900 → 6525 –5.43% correction Bitcoin: Dropped from 107k → 80.5k –24.77% correction BTC acted as a ~4.5× levered version of ES. BTC acted as a ~4.5× levered version of ES. Correlation Data: Rolling BTC/ES correlation increased from 0.38 → 0.74 Meaning BTC traded almost in sync with equities during the selloff Why? Risk-Off Mechanics When ES sells off: Equity funds de-risk Macro algos rotate out of high beta Volatility spikes Systematic funds reduce exposure Crypto is treated as “high beta tech” BTC amplifies the move by a factor of 3–5× Bitcoin didn’t dump because crypto was weak — It dumped because macro markets were risk-off. Why this matters now ES has stabilized BTC stopped following ES lower Spot demand started rising BTC/ES correlation is dropping again (from 0.78 → ~0.55) USDT-M shorts didn’t adjust This is exactly when short squeezes start on BTC: Macro stabilizes Crypto regains independence Shorts remain positioned for risk-off Spot buyers take control Price accelerates upward This is a classic intermarket correlation unwind. 5. USDT Dominance (USDT.D) Confirms Risk Rotation USDT dominance has turned down, which means: Traders are deploying capital Less stablecoin sitting idle More risk-on appetite Historically aligns with BTC beginning new legs up after HTF rotations When USDT.D falls at the same time spot CVD rises, the market is shifting capital into crypto. 6. Targets: 118.5k → 124k These are the next liquidity magnets. Target #1: 118.5k Confluences with: 1.141 extension of the 11 Nov → 12 Nov move First major liquidity pool First real “decision point” for the market Target #2: 124k Confluences with: A weak high that will be swept 1.618 extension of the same 11→12 Nov move Natural squeeze exhaustion zone Perfect location for a Swing Fail Pattern Rotation Logic Shallow retraces → larger extensions (1.618 → 2.0) Deep retraces → smaller extensions (1.272 → 1.414) BTC currently fits the shallow retrace profile → favors strong extension 7. Other Pivot Points Marked on the chart: Minor LVNs Minor-imbalances CME Gaps Expect reaction at each point. 8. Invalidation & Bearish Pathway My invalidation is clear: Trading below 80k invalidates the squeeze setup. Below 80k, the absorption breaks. If 80k is lost, the downside extension levels become: 74k 70k 64k These levels are: The natural downside extension pathways from the 11 Nov → 21 Nov swing They form the mirrored rotation of the bullish structure Final View We dumped because macro went risk-off Bitcoin amplified the ES selloff Shorts loaded heavily into the move Spot buyers stepped in first A clean absorption pattern formed Mathematical rotation completed at ~81k Structure flipped Risk metrics like USDT.D turned down Correlation with ES is now unwinding If Bitcoin continues to hold above 80k and spot keeps leading, the squeeze toward 118.5k → 124k becomes the most likely path. Abbreviation List BTC – Bitcoin ES – S&P500 E-Mini Futures OI – Open Interest CVD – Cumulative Volume Delta USDT-M – Stablecoin-Margined Futures BTC-M – Coin-Margined Futures HTF – Higher Timeframe LVN – Low Volume Node AVWAP – Anchored Volume-Weighted Average Price PRZ – Potential Reversal Zone SFP – Swing Fail Pattern Fib – Fibonacci CTA – Commodity Trading Advisor (systematic trend-following funds) VIX – Volatility Index Beta – Sensitivity of an asset’s movement relative to a benchmark Risk-Off – Market environment where investors reduce exposure to risky assets Risk-On – Market environment where investors increase exposure to risky assets ----- If you enjoy this type of deep, data-driven breakdown—spot vs futures, CVD flow, intermarket correlation, and rotation math—drop a like and leave a comment. It helps me see whether these higher-level analyses bring value, and it motivates me to keep sharing them for free.Order Flow Data: ibb.co/Z642YLNm ibb.co/prLWKp63Another key signal: Aggregated funding across all perp exchanges flipped heavily negative after the last low. This almost never happens. Why it matters -> Shorts are paying big to stay short -> Longs are getting paid to hold -> Market is heavily skewed short This usually happens at or near bottoms, not tops When funding nukes this hard while price stabilizes, BTC has almost always squeezed upward afterward (2021, 2023, even the COVID crash). -> Deep negative funding + rising spot demand = Classic pre-squeeze conditions.Price broke out of the local structure. 91930$ is the next important level to watch.I closed all my long positions. Economic events around the world might take SP500 and equities lower, which will take Crypto down as well. Be Cautious.
ThetaNomad
لینکچین (LINK) در آستانه انفجار قیمتی: راز پنهان منطقه ۱۲ تا ۱۳ دلاری چیست؟
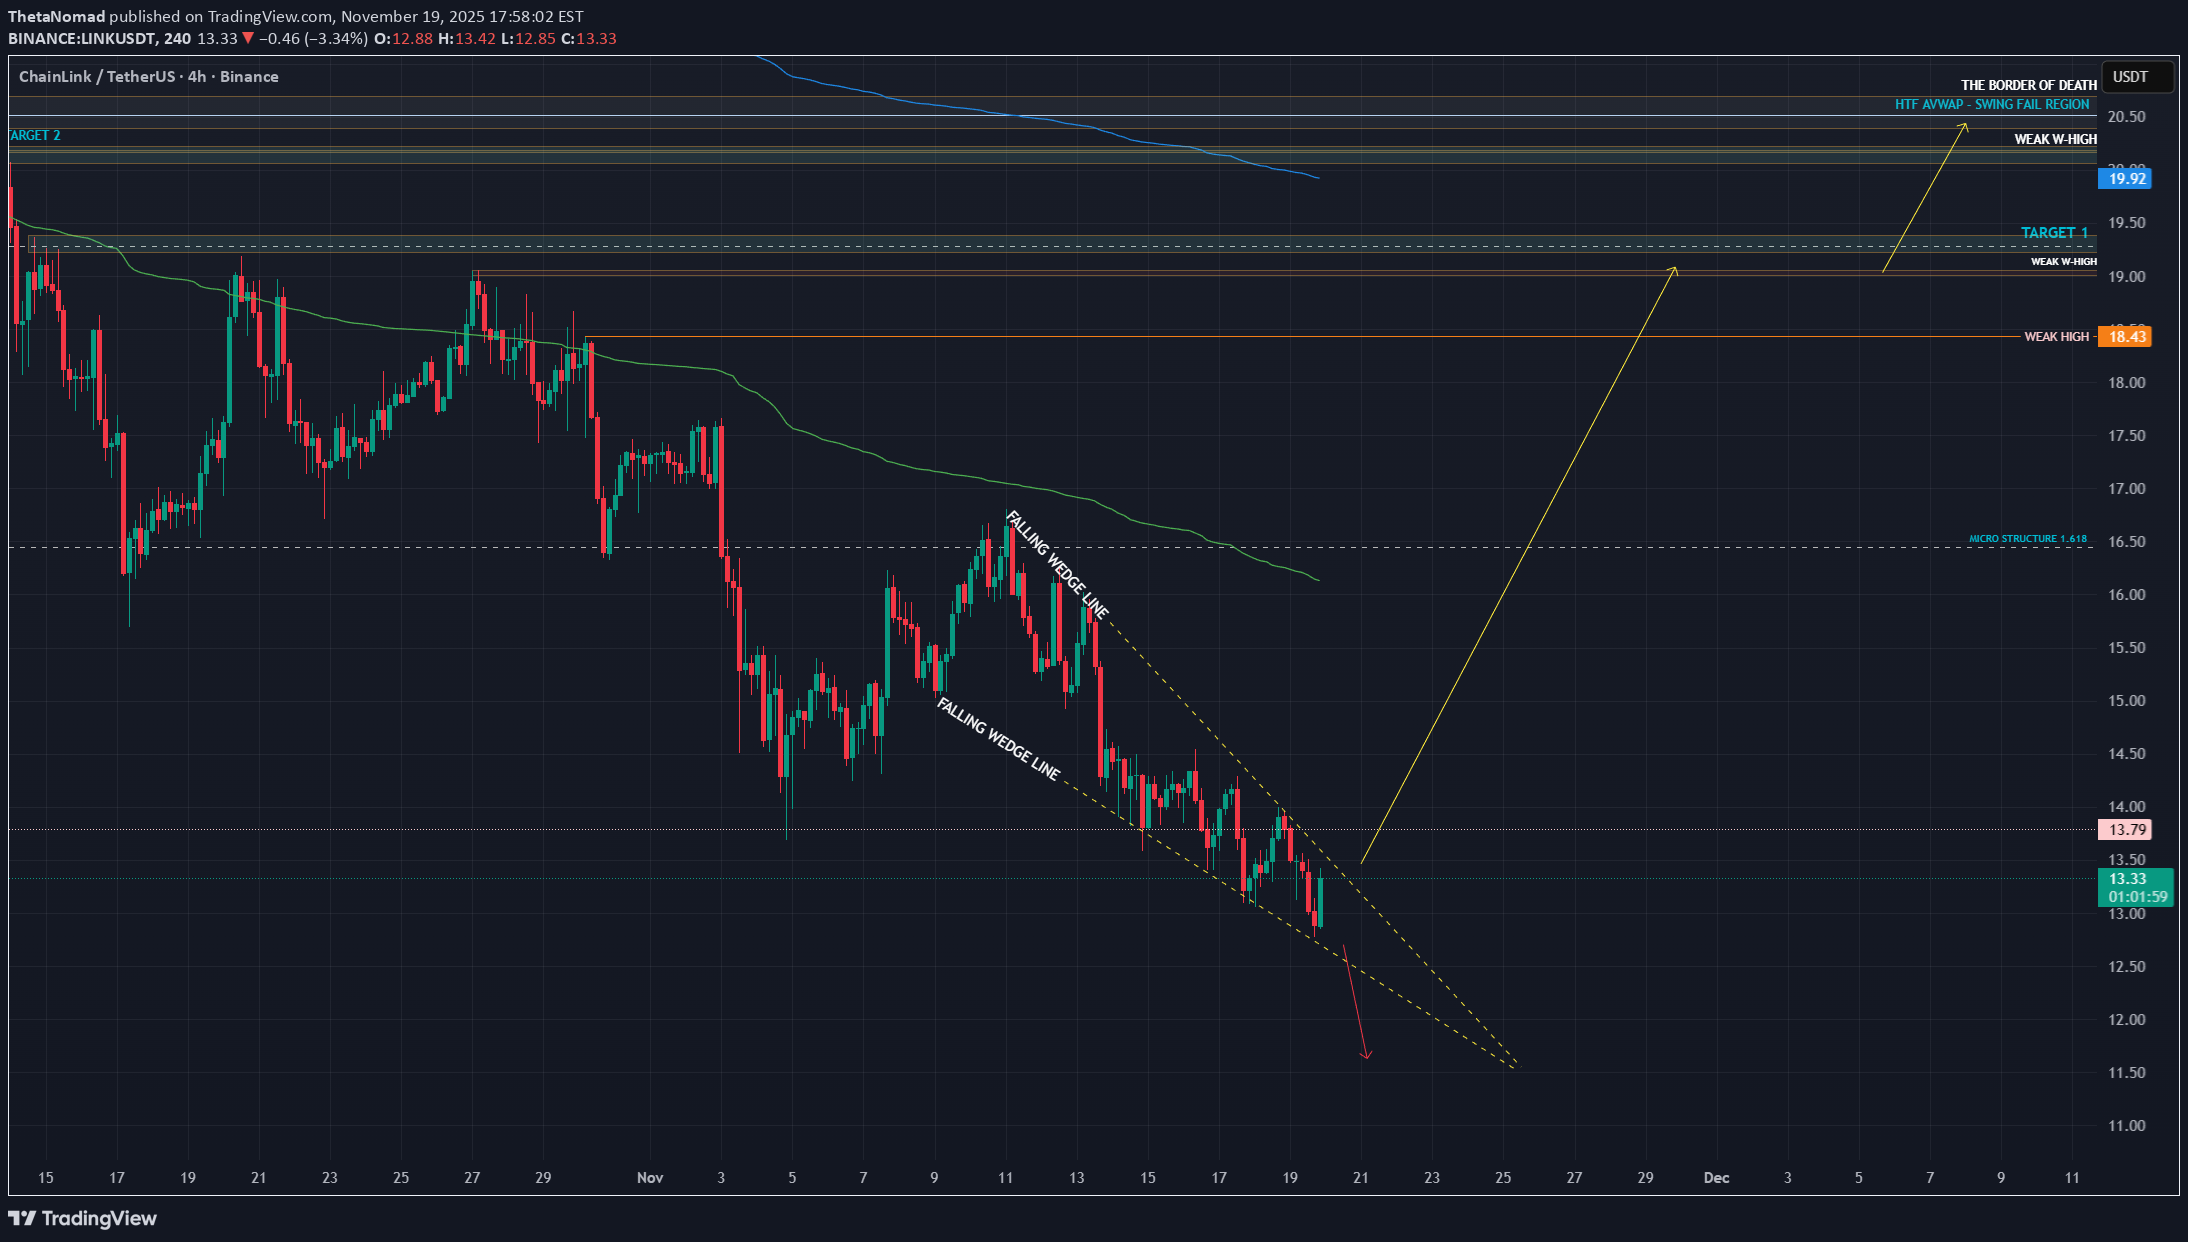
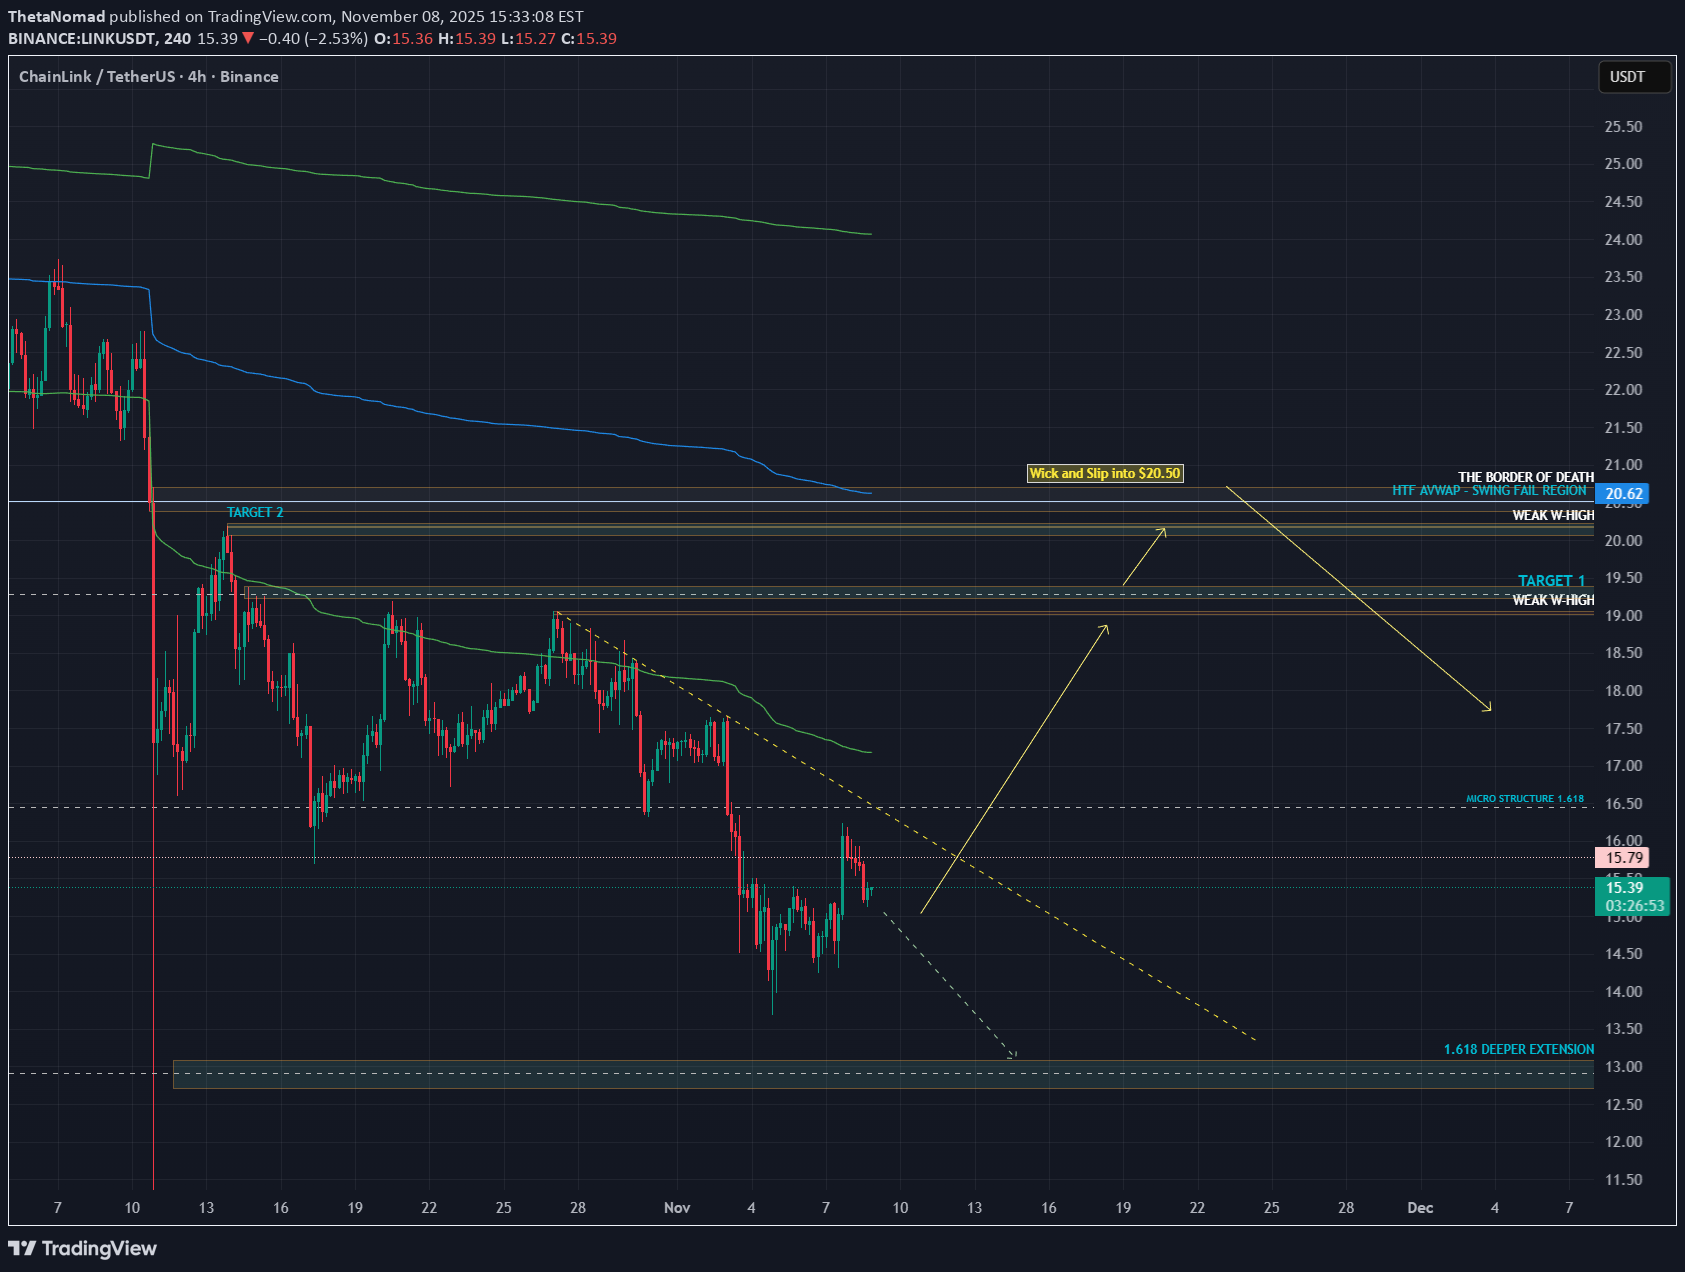
Tüccarlar, sonuncumda $CHAINLINK analiz İki senaryo yazdım. Senaryo 1 gerçekleşmedi. Senaryo 2 basitti: Bir sonraki 1.618 uzantısına bir döküm ve oradan yeni bir uzun kurulum arayışı başlıyor. Bu 1.618 12.90$'daydı Ve işte buradayız. Piksel mükemmel. Peki yanılıyor muyuz? Bu nedenle seviyelerinizin ana hatlarıyla belirtilmesi ve sabırlı olmanız her şeyden daha önemlidir. Bir yol kapandığında yapı diğerini ortaya çıkarır. Grafik her zaman konuşur. Ama bunu yalnızca bekleyenler duyabilir. Neye bakıyoruz $CHAINLINK doğrudan 12 ila 13 dolar bölgesine düştü. Bu bölge rastgele değil. Teknik olarak grafikteki en önemli ceplerden biridir. Nedenini açıklayalım. Matematiksel Seviyeler – Nokta Tablosu 10 Ekim tasfiye fitilinin neden olduğu bozulmayı önlemek için spot grafikte temiz matematiksel seviyelerle başlıyoruz. 12,886'da yüksek zaman dilimi olan 0,886 Fibonacci geri çekilmesine sahibiz. Bu, momentumun sıklıkla değiştiği deep geri çekilme bölgesidir. Fiyat burada tükenme eğilimindedir çünkü 0,886, yapısal geçersizlikten önceki son Fibonacci rotasyonunu temsil eder. Son satıcıların genellikle ellerindeki her şeyi attıkları yer burasıdır. Aynı zamanda bu seviye, 10 Ekim çöküşünden sonraki ilk yapının 1.618'lik uzantısıyla da örtüşüyor. Grafiğinizde başlangıçtaki yüksekten düşüğe sarı okla işaretlenir. Bunun tek bir anlamı var: Dezavantajı auction matematiksel olarak tamamlandı. Hem geri çekilme ayağı hem de uzatma ayağı aynı cebe indi. Bu gerçek bir birleşmedir. HTF AVWAP Kavşağı Grafik: 06 Ağustos 2024'te LINK yeni ve önemli bir düşüş kaydetti. Bu düşük seviye, arkasında güçlü bir hacim bulunan bir yükseliş dalgasını başlattı. Bu dalga uzun bir yükseliş trendinin başlangıcını işaret ediyordu, bu da bu düşük seviyeye sabitlenen AVWAP'in gerçek ağırlık taşıdığı anlamına geliyor. Şimdi işin büyüleyici kısmı: Bağlantılı AVWAP'ın alt band kısmı aşağıdakilerle mükemmel şekilde hizalanır: HTF 0.886 geri çekilmesi 1.618 uzantısı Mevcut fiyat bölgesi Matematiksel yorgunluk cebi Bu normal değil. Bu hassas seviye birleşimidir. Bu ne anlama geliyor? AVWAP, Fibonacci ve dalga uzantıları hizalandığında kurumsal maliyet temeli, piyasa hafızası ve auction matematiğinin hepsinin aynı bölgeye işaret ettiği sinyalini verir. adil değer. Akıllı paranın devreye girdiği yer burasıdır. Düşen Takoz – Teknik Kiraz Son bileşen: LINK temiz, ders kitabına uygun bir düşen takoz yazdırdı. Düşen takoz, momentumun sıkıştığı ve son satıcıların gücünün tükendiği yükseliş yönlü bir dönüş formasyonudur. Devam etmeyi değil tükenmeyi temsil eder. Bunu AVWAP, Fibonacci ve matematiksel simetri ile birleştirdiğinizde güçlü bir yapısal tersine çevirme kurulumuna sahip olursunuz. Sipariş Flow Onayı Sipariş flow teknik story'i onaylar: Spot CVD düşüş eğiliminde ancak fiyat artık aynı yoğunlukta takip etmiyor. Stablecoin ve coin marjlı CVD'ler hâlâ düşüşe geçiyor ancak fiyat yine baskıya direniyor. Açık Faiz en düşük seviyelere doğru yükseldi. Yorgunluğa yeni şortlar açıldı. Finansman küçük ve tarafsız kalıyor. Fiyat kilit bölgeyi tutuyor. Bu emilimdir. Kısa pozisyonlar itildiğinde ve fiyat kırılmayı reddettiğinde, piyasa bir bahar yüklemesi yapıyor. Sonuç 12 ila 13 dolar aralığı rastgele bir gürültü değil. Aşağıdakilerden oluşan yüksek zaman dilimli bir birleşme bölgesidir: 0,886 Fibonacci geri çekilmesi 1.618 uzatmasının tamamlanması Ağustos trend kaynağına göre daha düşük AVWAP band Düşen kama yapısı Sipariş flow emilimi Yeni şortlar zayıflığa giriyor LINK eğer bu bölge tutulursa güçlü bir taramaya hazırlanıyor. Hedefler. 19,30$ 20,50$ move daha yüksek olursak 38,00$. Kama deseninin dışına çıkmak bu fikri geçersiz kılıyor. -------- Grafik yine fısıldıyor. Sabır, fısıltıları sinyallere dönüştürür. -------- Bu tür analizleri beğendiyseniz beğeni bırakın ve yorum bırakın. Buradaki her şey ücretsiz olarak paylaşılıyor, böylece daha fazla insan gürültüyü kesip sonunda yüzeyin altında gerçekte neler olduğunu görebilir. Hopiyum yok. Korku yok. Yalnızca gerçek veriler, gerçek yapı ve gerçek düzen flow. Amaç basit. Yatırımcıların tahmin etmeyi bırakıp piyasanın gerçekte ne söylediğini anlamaya başlamasına yardımcı olmak. Keskin kalın. Objektif kalın. Ve unutmayın... harita konuşmadan çok önce fısıldar. - ThetaNomad
ThetaNomad
آیا بیت کوین بالا میرود یا سقوط میکند؟ تحلیل سطح حیاتی 90 هزار دلاری
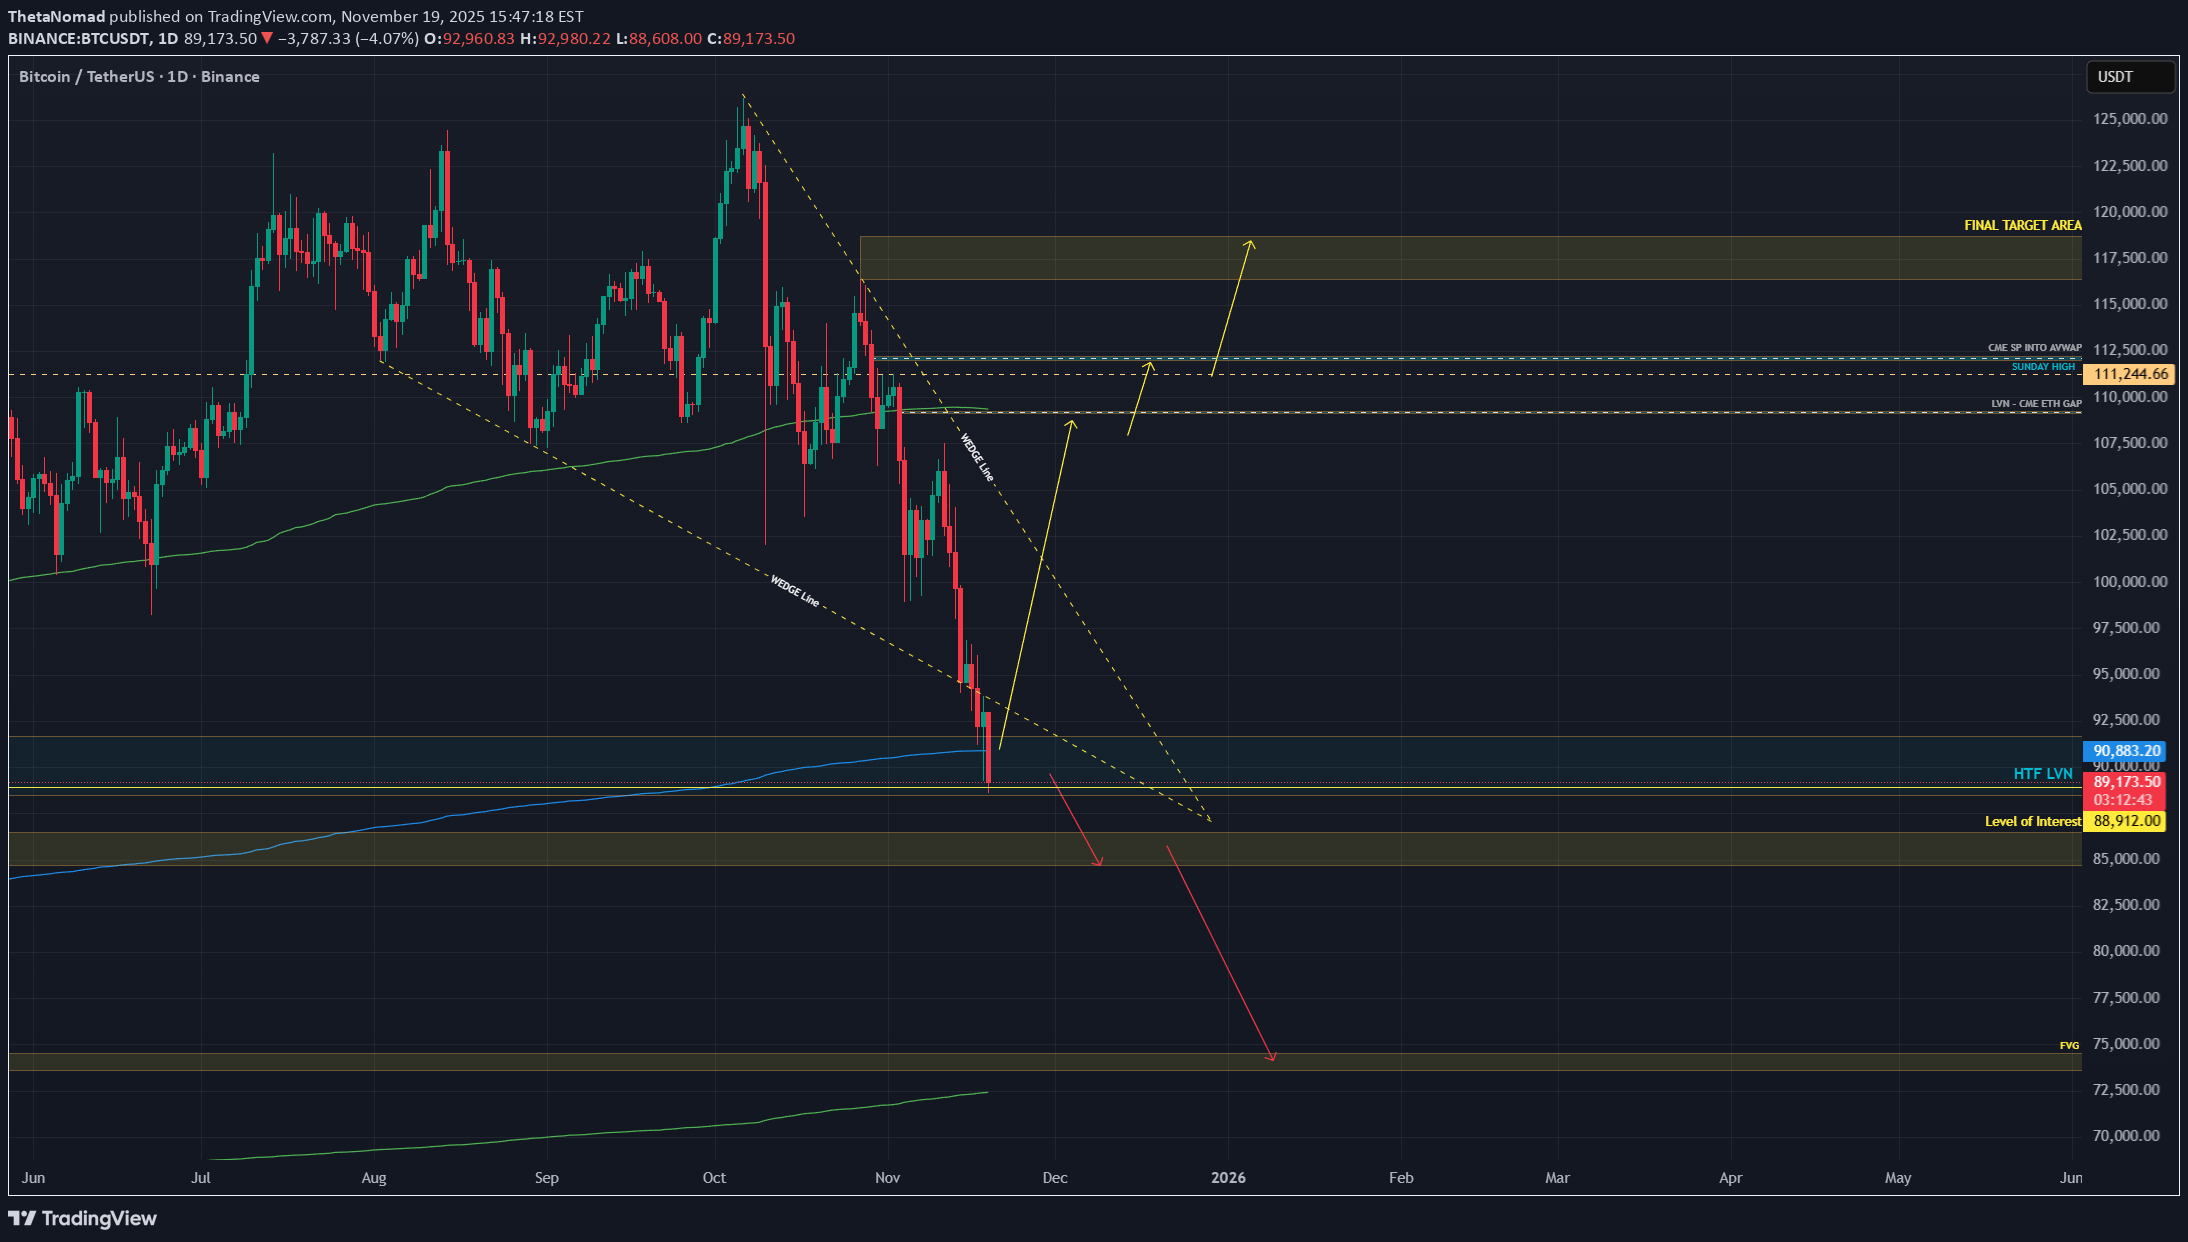
Traders, On November 5 I mapped out a scenario where Bitcoin would push into 107k to 108k and then decline to 98k first and 89k second. This entire scenario has now played out perfectly to the pixel. We swept 108k, we dumped to 98k, and then we flushed into 89k. Where I expected price to retrace from exactly this level: $88.912 So the real question now is simple. What now? Do we break lower, or do we go up? Let’s break Bitcoin down cleanly, without bias, and only by reading structure, levels, and order flow. Levels, Structure and Order Flow AVWAP at the core of the structure Bitcoin is currently trading right near the AVWAP from the 06 August 24 anchor. This is the blue line on your chart and the exact level is 90.881. This anchor began with a large volume impulse. When heavy volume kicks off a leg, the AVWAP from that point becomes a core reference level for the entire future auction. We are now sitting right on top of it, which is exactly where you would expect absorption or a strong reaction. The market is basically deciding if this AVWAP will hold or break. AB=CD completion The full AB=CD measured move has completed exactly into the AVWAP zone. This is a clean harmonic completion and adds confluence to why price reacted here. AB=CD means the downside leg is symmetrical and usually marks exhaustion inside a trend. Fixed Range Volume Profile Using a FRVP from the start of the current HTF auction (07 April until now), we see price wicked directly into the LVN that sits inside the weekly FVG. This area had imbalance and low participation. A wick into an LVN inside an FVG often means that the inefficiency is now cleaned and the auction has reached completion for that side of the range. Wedge breakout Bitcoin technically broke out of the falling wedge, but the breakout does not look clean. We are outside the wedge, but momentum on the breakout is weak. True confirmation would come if price re-enters the wedge from the outside and climbs back through the wedge body. Re-entering the wedge tells you that the breakdown was liquidity and not a structural continuation. If we reclaim it, upside targets become more likely. Order Flow – What the data shows Spot and Futures CVD Across the 15m, 30m and 1h charts, Spot CVD is forming a bullish divergence. Price keeps making lower lows, but Spot CVD is holding higher. This shows that spot buyers are stepping in at the lows and absorbing sell pressure. Futures CVD on both stablecoin margined and coin margined contracts continues to push lower. Price is not following these lower lows. This creates hidden bullish divergence and confirms that aggressive sellers are hitting the market while limit buyers are absorbing the pressure. This is a classic sign of absorption. Selling continues, but the market is refusing to break lower with the same intensity. Open Interest – A shift Earlier in the dump, Open Interest was falling. This means positions were being closed. Most of this was shorts taking profit or exiting the move. When OI drops during a downtrend, continuation becomes harder because the move loses fuel. Near the end of the screenshots, there is a shift. Both stablecoin margined and coin margined OI start to rise again. This rise in OI happens while: CVD continues to make lower lows Price stops making new lows Price begins to stabilize This tells us that new positions are being opened at the lows. Given the CVD behavior, most of these are new shorts entering the market. When new shorts enter and price does not break, the probability of those shorts becoming trapped increases. If buyers step in, this setup often leads to a short squeeze. This is how reversals form in a controlled market. Funding rate – Binance Funding is positive but very small. This means there is no extreme long pressure. There is no overcrowding on the long side. The market is not stretched. With fresh shorts entering at the lows and funding staying neutral, the market can turn quickly if support holds. What this means The combination of: Spot CVD divergence Hidden bullish divergence on futures CVD Rising Open Interest at the lows Neutral funding Price refusing to break down - So price needs to hold. shows that the market is absorbing aggressive selling at a key level. If buyers defend the current level, this can force newly opened shorts to cover, which would fuel the next move up. Targets 109k This is the first upside objective. There is a CME ETH gap resting at this level and gaps of this type tend to get filled. 109k also aligns with the 1.113 Fibonacci extension of the latest wave. This makes it the first logical level if price continues to hold the AVWAP and absorb selling pressure. 112k The next major level is 112k. This area contains single prints on CME and matches an AVWAP level on the BTC CME chart. 112k also lines up with the 1.272 extension of the wave. From a Fibonacci rotation perspective, 1.272 is the next stop after 1.113 and often acts as a mid-cycle continuation target. 118.800 The final target sits at 118.800. This is the full 1.618 extension of the wave and mathematically completes the auction. If the market rotates from AVWAP support, this level becomes the natural endpoint of the move. As long as price continues to hold the AVWAP at 90.881 and the market keeps absorbing futures selling, all three upside targets remain in play. Invalidation The structure changes only if price breaks below 88k. A clean drop under 88k opens the door for the next major high timeframe support at 85k. 85k carries strong confluence. It aligns with the 0.786 Fibonacci retracement on the HTF move and sits directly on a Point of Control zone within the Fixed Range Volume Profile. Below that level, the auction shifts into a lower structure entirely. TLDR Bitcoin completed the downside scenario perfectly. Price is now sitting directly on the AVWAP at 90.881. AB=CD is complete. LVN inside weekly FVG has been cleaned. Futures CVD is still pressing lower but price is not. That is absorption. But the key update is OI. OI was dropping earlier on the LTF, but now OI is rising again, and this is happening while CVD continues down and price holds steady. That means new shorts are entering the market and getting absorbed. If AVWAP holds, expect a bounce. Targets: 109k 112k 118.8k If 88k breaks, 85k is next. -------- Abbreviation List AVWAP Anchored Volume Weighted Average Price. A dynamic support or resistance level based on volume since a chosen anchor. AB=CD A harmonic measured move where AB equals CD. FRVP Fixed Range Volume Profile. Shows where volume was traded inside a chosen range. LVN Low Volume Node. A low interest level where price often rejects strongly. FVG Fair Value Gap. An imbalance left by aggressive price moves. CVD Cumulative Volume Delta. Tracks buying vs selling pressure. OI Open Interest. The amount of open futures positions. POC Point of Control. Level with the highest traded volume. -------- If you like this kind of analysis, drop a like and leave a comment. Everything here is shared for free so more people can cut through the noise and finally see what is actually happening under the surface. No hopium. No fear. Just real data, real structure, and real order flow. The goal is simple. To help traders stop guessing and start understanding what the market is actually saying. Stay sharp. Stay objective. And remember… the chart whispers long before it speaks. - ThetaNomad
ThetaNomad
بیت کوین در آستانه انفجار؟ سطوح کلیدی و شواهد قوی برای برگشت قیمت
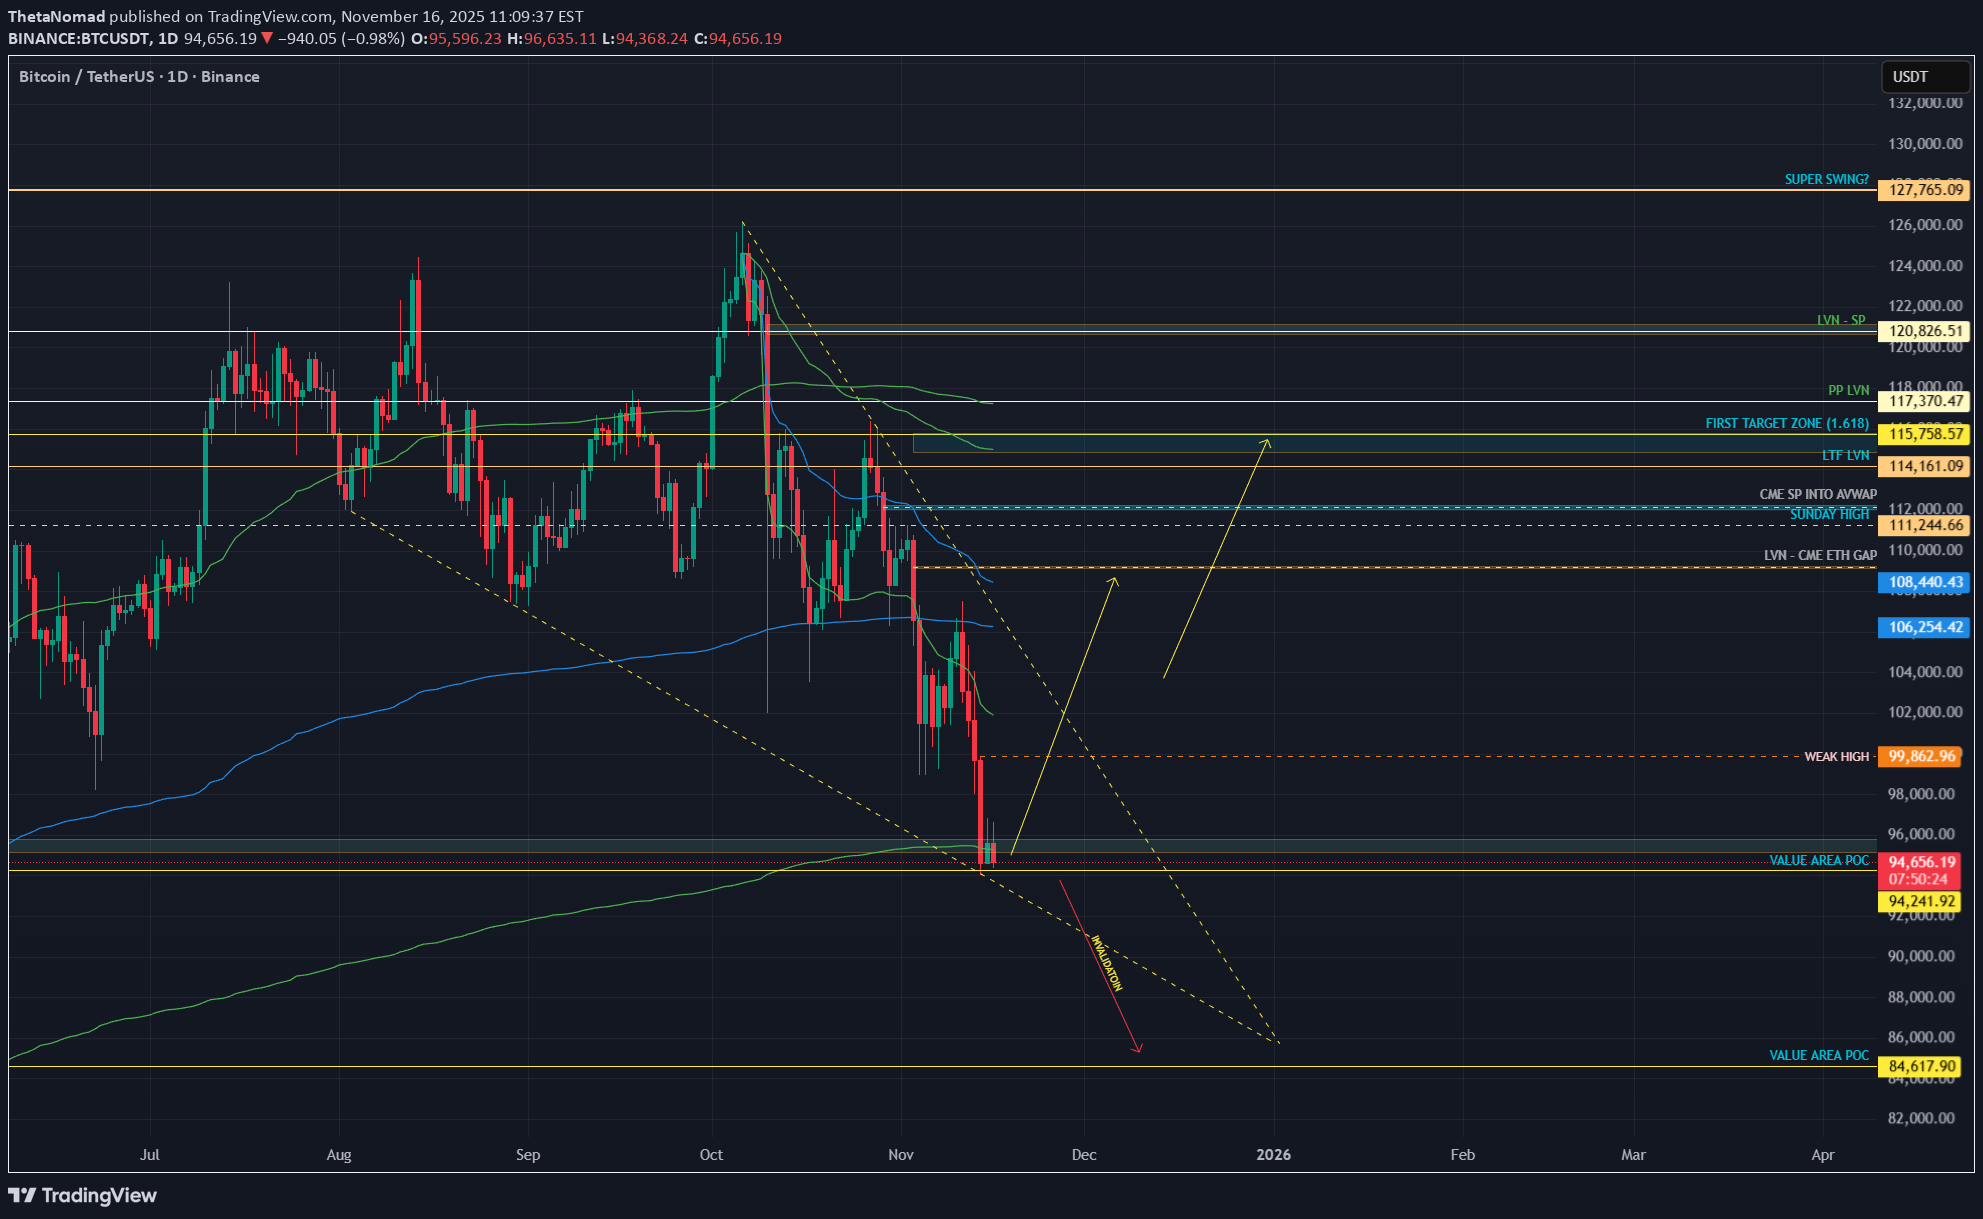
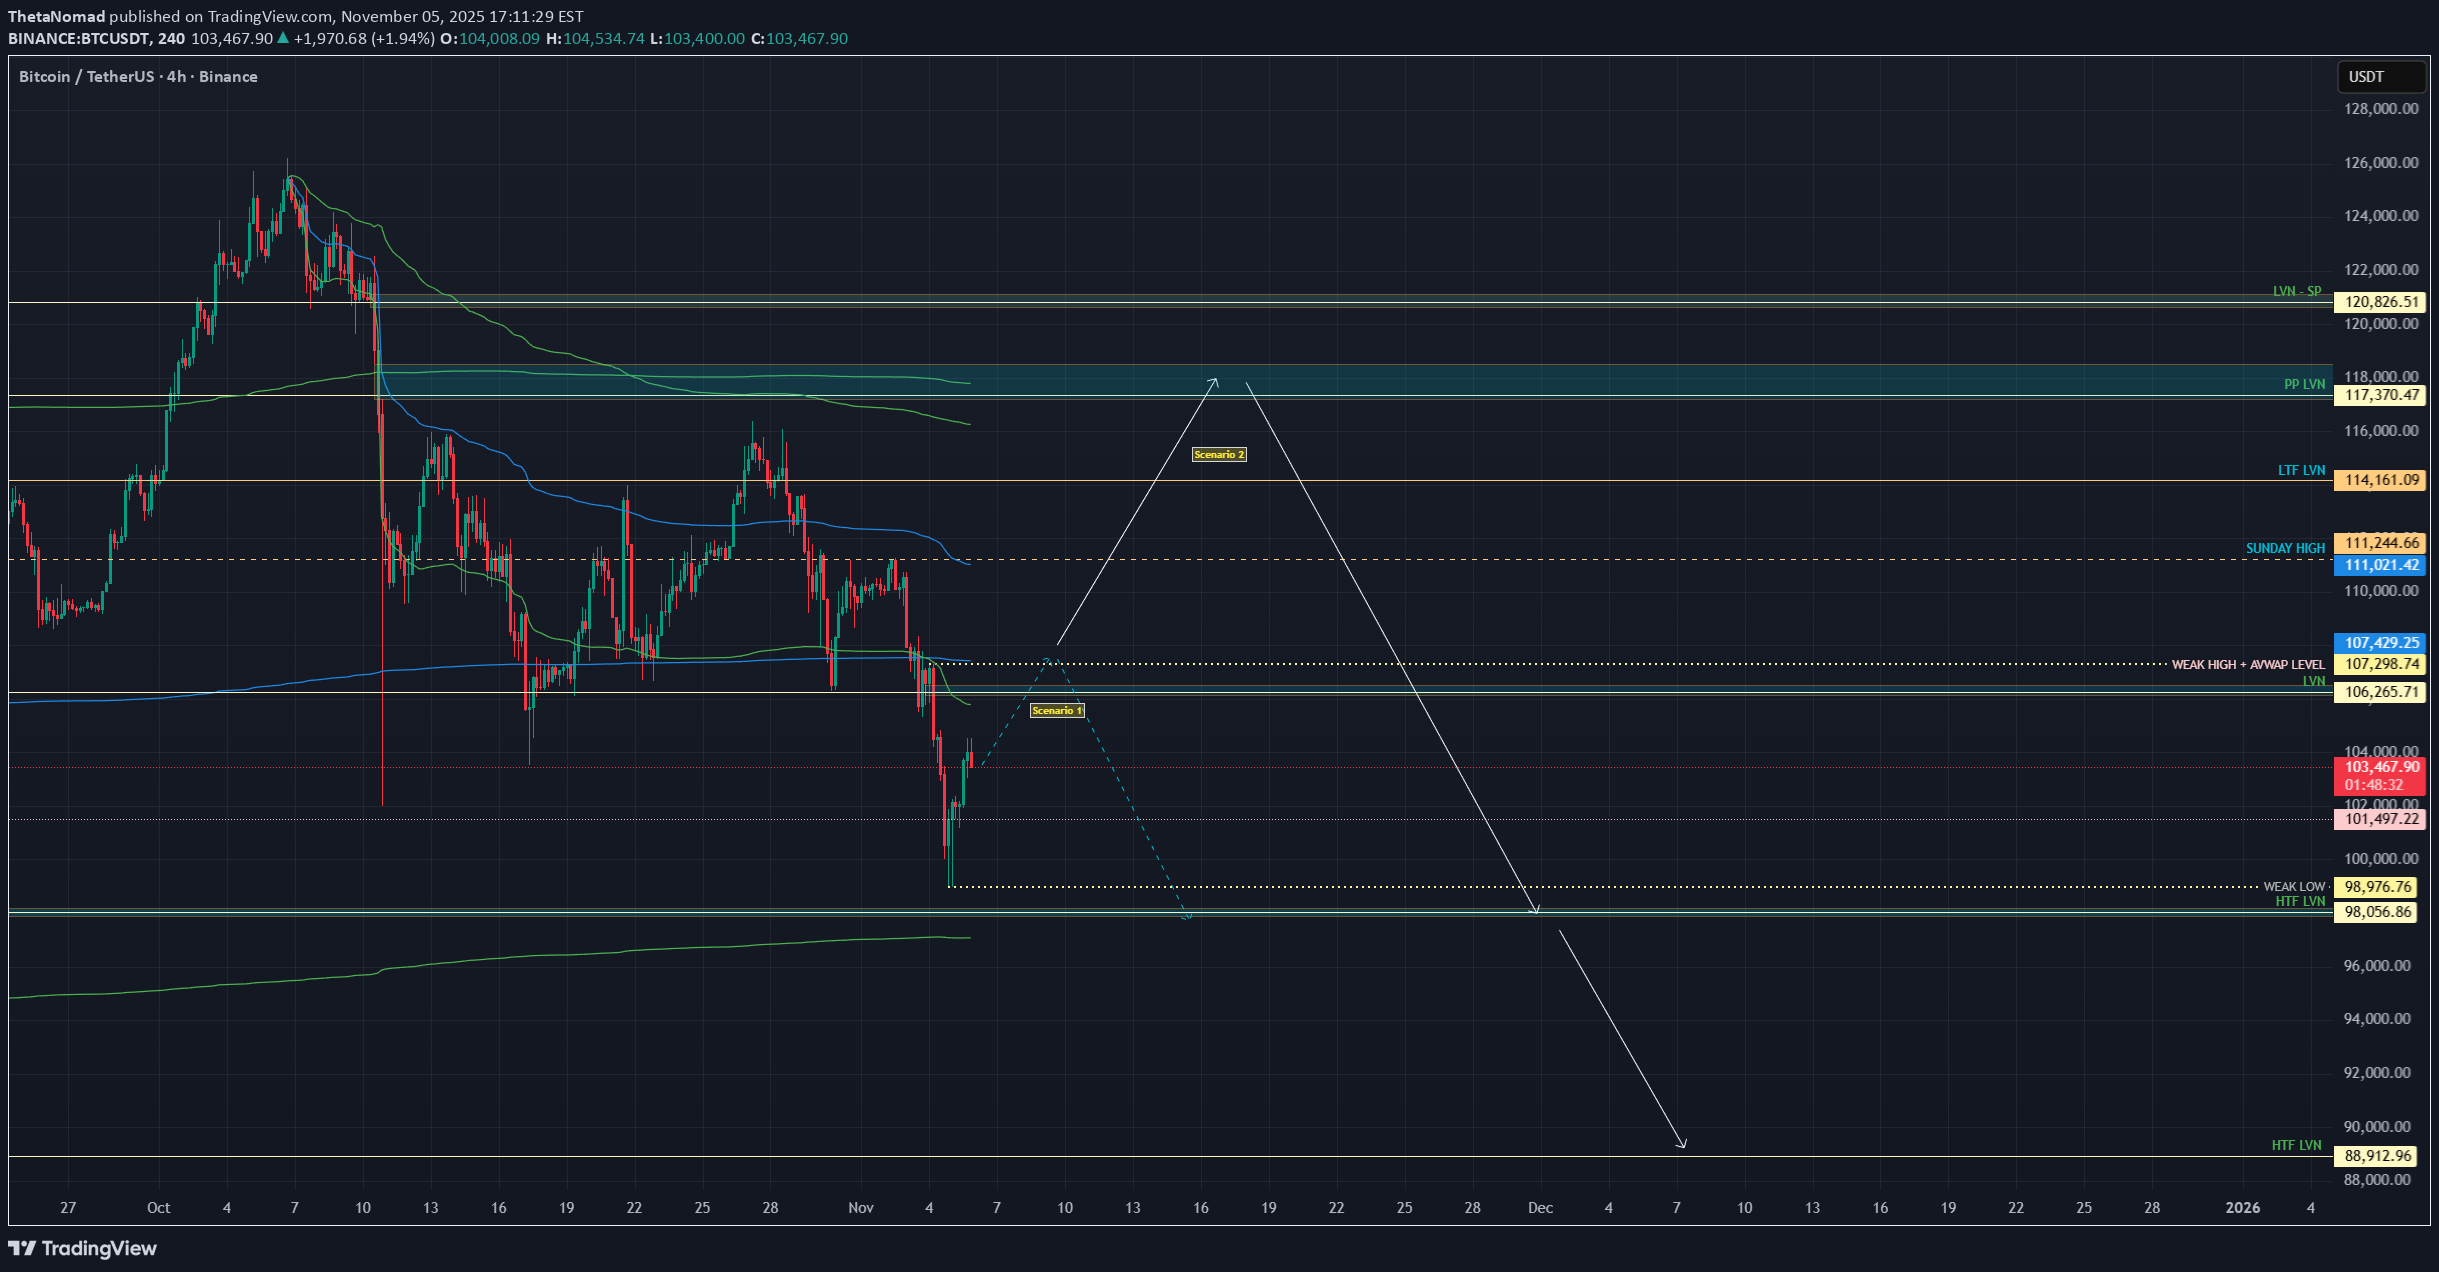
Traders, Bitcoin is now sitting inside a large falling wedge structure on the daily chart. Wedges of this type often form during trend exhaustion and can precede significant reversals when the lower boundary is reached. This pattern sets the stage for everything that follows in this analysis. Below is the full breakdown of why I believe Bitcoin is positioned for a potential reaction and where the most important levels are located. Recap of the Previous Bitcoin Analysis In the previous BITCOIN analysis I mentioned two scenarios. Scenario one outlined the following sequence: • Price pushes into 107k to 108k • That move sweeps the weak high and taps the AVWAP anchor • If spot CVD slows or perps shift into net selling, a rejection becomes likely • That rejection sends price back toward the mid range and possibly into 101k to 102k • Continuation into the higher timeframe LVN at 98k becomes possible Every single step unfolded almost perfectly. Current State of Bitcoin Bitcoin is now sitting directly on the lower band of the AVWAP anchored from 7 April 2025. What this means AVWAP stands for Anchored Volume Weighted Average Price. It calculates the average position of market participants beginning from the chosen anchor point. The April low marked a major shift in trend structure. When price reaches the lower band of an AVWAP anchored to such a significant low, it often acts as dynamic support. This is because it reflects the average entry of early cycle buyers. If price holds and begins reclaiming from this area, it signals that the strongest hands are defending their positions. If it fails, the market risks a deeper flush into lower demand clusters. Value Zone Analysis with Fixed Range Volume Profile To determine whether Bitcoin is inside a significant value region, we use a Fixed Range Volume Profile (FRVP). The range is anchored from the April low to the October high. Zooming into the profile on the left, price has now re-entered the core value area of this entire swing. The red horizontal line marks the Point of Control, which is the level with the highest traded volume in the entire range. The current low sits almost exactly on this level. Pixel perfect confluence. Why this matters When price returns to the value area after a distribution phase, two possible outcomes appear: 1. Reversal Buyers defend value and price rotates back toward high volume nodes above. 2. Continuation breakdown Price accepts below value, meaning even previous buyers are unwilling to re accumulate here. This opens the door to the next low volume pocket and lower demand zones. Right now, the reaction at this level is critical because we have perfect alignment between the lower AVWAP band and the FRVP Point of Control. Mathematical Levels and Fibonacci Structure Now we collect the mathematical evidence. We are sitting at a core AVWAP level and a core FRVP level. Now we check if the market is stretched mathematically. Bitcoin at the 1.618 Extension On the four hour spot chart, I apply a Trend Based Fibonacci Extension from A to B and project it from C. The placement rule Ask yourself: What was the last meaningful swing high that ended the previous trend and started the current reversal? That swing becomes A to B. The first corrective lower high after that becomes C. Using this structure, Bitcoin has now extended perfectly into the 1.618 level. The 1.618 Fibonacci extension is historically associated with exhaustion. Sharp downlegs often pause, take liquidity, or reverse at this point. TOTAL at the 2.0 Extension To confirm that this move is not isolated to Bitcoin, we check the TOTAL crypto market. TOTAL reflects the entire crypto market and shows equilibrium conditions. When Bitcoin and TOTAL stretch at the same time, reaction probability increases. Start with a retracement from A to B: Price nearly hit the fifty percent mark but not entirely. Then reverse the tool from B to A. Doing so reveals the extension levels below. Price is now sitting exactly at the 2.0 extension. Why the 50 percent connects to the 2.0 If a move retraces halfway, the remaining distance becomes the basis of the flipped extension. Doubling that distance gives the 2.0 level. Because TOTAL did not fully reach the fifty percent retracement, there is a small missing portion. To visualise this, I draw a box between the actual retracement and the fifty percent level. Then I duplicate the box under the 2.0 extension. The duplicated box lands perfectly on the current low, showing mathematical symmetry. Additional Mathematical Check I also check the structure that began after the 10 October crash. By extending from B to A, the downside projections appear. Price tagged the 1.618 level perfectly. Full symmetry Bitcoin at the 1.618 TOTAL at the 2.0 Internal structure at the 1.618 When all three align, the move has reached market wide symmetry. These zones commonly produce strong reactions or reversals. Summary so far We now have confluence in four categories: • AVWAP support • FRVP Point of Control support • Fibonacci extensions on BTC and TOTAL • Mathematical symmetry across multiple swings Next, we check the internal fuel of the move: order flow. Order Flow Analysis Spot CVD Divergence On both the one hour and thirty minute charts, Spot CVD continues making lower lows while price holds steady. This means aggressive sellers are pushing market sell but price refuses to break down. This can only occur when passive limit buyers absorb the flow. This is hidden absorption. Coin Margined Futures CVD Coin margined CVD shows the same pattern: lower lows while price stays flat. This indicates aggressive shorting with no continuation. Why coin margined matters Coin margined futures use BTC as collateral. When price declines, the collateral loses value. When price rises, shorts lose even more because both their collateral and their position move against them. Coin margined shorts get squeezed harder and faster. Open Interest • Stablecoin margined OI: holding steady. Traders continue to open or maintain positions during sell pressure. • Coin margined OI: compressed during the dump and is now flat. This means shorts are sitting in the market and can be forced out. Summary Price stable CVD falling OI steady This is absorption combined with short build-up. This often leads to a sharp reversal when price begins to lift. Volume Analysis Chart: Accumulation and Distribution (A D Indicator) The A D indicator shows whether volume flows into candles or out of them. On the one hour chart, the A/D is trending up while price stays flat. This means buyers are stepping in during down-wicks and absorbing sell pressure. Price is not showing this strength yet, which is typical for accumulation phases. On Balance Volume (OBV) OBV measures directional volume flow. On the last wick down, OBV actually moved up. This means buyers absorbed the move rather than sellers pushing price down. This is the classic bullish volume divergence after a liquidity sweep. Both Spot and Perps Confirm These divergences appear on both spot and perpetual futures. Spot confirmation is the strongest form of validation because it represents real buying without leverage distortion. The combination of A/D rising, OBV diverging, Spot CVD falling, and Futures CVD falling strongly supports that the sell pressure is being absorbed. What Happens Next Based on everything above, I expect Bitcoin to start by taking the weak local high at 99,862. Weak highs form when the wick structure is sloppy and no real sellers defended the level. On fine tick data, this high looks even weaker. Taking that high breaks the current local structure and potentially triggers a short squeeze. If Bitcoin begins closing four hour candles above 106,200, the next important level is 108,500. Main Thesis Bitcoin pushes into the first target zone and performs a Swing Failure Pattern around 115,700. With strong momentum, the move could extend into the 17,300 to 18,000 region. Invalidation and Downside If Bitcoin loses support and spends meaningful time below 93,000, the next major support is 84,617. This is the next Point of Control from the AVWAP auction and an extremely important level to watch. All relevant levels are marked on the charts. Trade safe and manage risk. From the depths of the sands, ThetaNomad ------------------- If you like my analysis, give it a like and leave a comment so more people can see real analysis without the noise.#Bitcoin #LINK We’ve reached the levels of interest — here’s what I’m watching: -> CME ETH gap closed -> Price nearing the HTF AVWAP (04 Aug ’24) inside a HTF gap -> HTF AB=CD completed -> A lot of fresh shorts chasing the move down For a long I want: -> Structure confluence -> CVD confluence -> Volume shift -> OI confluence — ideally OI drops Why OI drop? Because a drop means shorts are closing → move is losing fuel → good conditions for a reversal. Exception: If we get hidden bull div (absorption) — CVD making a higher low while price makes a lower low — then high OI can actually be bullish. That means aggressive sellers are being absorbed and shorts are getting trapped. I won’t instantly enter — first I want to see how OI, CVD and volume behave at the level.Patiently waiting for $88,888 — expecting one more local low. The current one looks weak and fragile. There’s an LVN sitting right on $88,888, formed around the weekly FVG. For a long setup, I want to see price wick and slip into that LVN, with CVD turning red and OI increasing — a push that traps fresh shorts before wicking back up.Need to re-assess the market. Keep a close eye at the next target I targeted: 85k~.
ThetaNomad
تحلیل جامع LINK: از ریاضیات فیبوناچی تا ساختار بازار و تله شورتها!
Traders, In my latest LINKUSDT analysis I started my thesis with " I BELIEVE THE CRYPTO MARKET IS SETTING UP FOR A BIG, BIG, BIG DUMP! NOT JUST LINK! " It wasn’t coincidence that I wrote those words in caps lock. The market was whispering louder than usual: not in price, but in data. Every metric pulsed in rhythm, like the heartbeat of a system about to release its tension. The numbers weren’t random; they were poetry in motion, quietly syncing toward one inevitable point. Sometimes, data doesn’t just inform — it sings. And when it does, your fingertips start typing before your mind even realizes what the melody means. Now we’re back — same chart, same logic, but a different side of the market. I’m going to analyze it the same way I did before — step by step, math-backed, structure-based, and logic-driven. Only this time, it’s even more extensive. For free. For nothing. So that you, the people who actually care to learn, can start to see how markets truly work. How they breathe, trap, rotate, rebalance — and how every candle hides intent. I believe the LINKUSDT dump might be over — for now, at least — and that the market is slowly starting to build upward momentum. This post is not a quick “looks bullish” statement. It’s a structured walkthrough from mathematical foundation to market structure, liquidity, and order flow, showing why the $20–$21 region might become the next key target before a rotation lower. Let’s go step by step. Step 1 – Is There a Mathematical Reason to Say the Current Auction Might Be Finished? By “auction,” I mean the move from a clear swing high to a clear swing low where sellers were in control. Markets move in auctions — from high to low, then pull back, then extend again. To determine whether a sell auction is finished, we measure how far it has retraced and extended. After the 10 Oct liquidation event, price printed a clean new high — more valid than the liquidation spike. That’s point A (~20.15). From there, it sold off to point B (~15.70). So our first auction is: A → B | Direction: Down Step 2 – Measuring the Retrace Since the move was downward, I drew a Fibonacci retracement from A to B (high → low). nThat gives us retracement levels above price on TradingView. Price retraced almost perfectly to the 0.786 level (~19.23) — not shallow (0.382 or 0.5), not extreme (0.886), but deep enough to classify as a “normal” yet decisive retrace. That means sellers regained control after a 0.786 pullback, a key ratio in the Fibonacci family. Step 3 – What Does a 0.786 Retrace Usually Lead To? Here’s where the Fibonacci logic becomes meaningful. The 0.786 level is derived from the square root of the golden ratio inverse: √(1/φ). Its natural mirror on the other side of price is √(φ), or 1.272. That’s why 0.786 retraces often project toward 1.272 extensions — the two are mathematically linked. Beyond that, the next probable extensions are 1.414 and 1.618. So, for a 0.786 retrace, the Fibonacci extension ladder is: Primary: 1.272 Intermediate: 1.414 Extended: 1.618 Step 4 – Did LINKUSDT Reach One of These Fibonacci Targets? To check that, we reverse the Fibonacci — draw it from B to A (low → high). That prints the extension levels below the swing low. Price hit the 1.414 extension almost perfectly before structure began shifting: Lower lows stopped forming Higher lows began to appear Small higher highs emerged on lower timeframes That’s a structural sign the sellers exhausted their leg — a textbook confirmation that the 1.414 zone completed the auction. Step 5 – Confirming the Auction The A → B auction retraced to 0.786, extended to 1.414, and then reversed in structure. This matches the Fibonacci expectation for a completed wave. If the retrace had been 0.886 instead, we’d likely expect continuation to 1.618 — but since it was 0.786, the 1.414 tap followed by reversal fits perfectly. ✅ 0.786 retrace → 1.272 / 1.414 / 1.618 extension ✅ 1.414 tapped → structure reversed We can reasonably call this auction finished. Step 6 – Confluence from the Smaller ABC Swing After the main leg, the market made a small rally and a lower high — point C. Using the Fibonacci Extension tool (A → B → C), we project this smaller swing. Interestingly, the ABC projection lands exactly on the same 1.414 zone as the larger A → B measurement. That’s two independent Fibonacci constructions converging on the same price. From a math perspective, this isn’t coincidence — both patterns use the same ratio family. It’s proportion — the geometry folding back onto itself. Nature’s Geometry on a Price Chart This is where Fibonacci goes beyond numbers. The same proportions that define growth patterns in seashells, tree branches, sunflowers, hurricanes, and galaxies are present in the market’s structure. Two distinct swings produce the same 1.414 target.That’s natural proportion — mathematical harmony showing up in price behaviour. It’s not random. It’s geometry repeating itself. Part 2 – The Structural Context: Liquidity and Value We’ve identified our Potential Reversal Zone (PRZ) using Fibonacci confluence. Now let’s look inside the structure and the market’s underlying “memory.” We’ll answer three questions: Where does liquidity sit — which levels might the market hunt next? What is the order flow showing — is there absorption or continuation? What do the next extensions project mathematically? 1. Liquidity via TPO (Market Profile) TPO (Time Price Opportunity) shows how much time price spent at each level. Clusters = acceptance and value. Gaps = imbalance and rejection. Around $19.00, during TPO periods G, H, N, and O, price built acceptance but didn’t explore higher. That created a weak high — a level that often acts as a magnet for future liquidity hunts. Another, slightly weaker high sits near $20.00, which is still unfinished. And as James Bond said, “I never leave loose ends.” Neither does the market. 2. Anchored VWAP Confluence Anchoring VWAP from the major swing high shows the blue AVWAP aligning almost perfectly with that $20.00 region. That gives strong confluence between volume-weighted value, liquidity, and structure. 3. Low Volume Nodes (LVNs) and Imbalance Using the Fixed Range Volume Profile (FRVP) from A → B reveals clear low-volume zones — “air pockets” where price moved too fast to build volume. Between $20.00 and $20.50, there’s a notable LVN, meaning price skipped over it during the selloff.Such zones often act as magnets — the market tends to revisit them to rebalance unfinished business. Now we have three layers of confluence: Weak high at $19.00–$20.00 Anchored VWAP aligning with $20.00 LVN pocket at $20.00–$20.50 That defines a clear liquidity and target zone. Structure and Confluence Summary PRZ established through Fibonacci symmetry Structure showing higher lows and early accumulation Confluence cluster between $20.00 and $20.50, combining: Weak highs Low-volume node Anchored VWAP Market Profile imbalance The setup aligns across math, volume, and structure. Part 4 – Order Flow: What Lies Beneath the Candles From the outside, price action looks calm — clean candles, defined Fibonacci levels, and structure that seems perfectly balanced. But the real story is hidden underneath, inside the Order Flow. Every candle represents a battle — between aggression and absorption, buyers and sellers, liquidity and imbalance. Understanding who is winning that battle tells us whether a move is genuine strength or a trap waiting to unwind. Order Flow allows us to look beneath the surface and see where transactions are actually happening — where volume clusters, where buyers are absorbed, and where sellers are defending. It’s the market’s heartbeat. The Current Picture Here’s what we see right now on LINKUSDT : CVD (Cumulative Volume Delta) — across both spot and futures (stablecoin- and coin-margined contracts) — is making lower highs, showing persistent sell aggression. Yet price itself is not breaking down. Instead, it’s holding steady and even forming higher lows. Meanwhile, the A/D (Accumulation/Distribution) line is rising, indicating that despite heavy selling pressure, buyers continue to absorb and accumulate. That means one thing: aggressive sellers are being absorbed by large passive buyers quietly taking the other side. Recognizing the Setup Let’s break down the pattern: CVD ↓ → sustained sell aggression OI ↑ → new short positions entering the market Price ↔ or ↑ slightly → absorption and accumulation taking place When these three align: It often signals a short trap forming. Sellers feel in control because CVD shows selling dominance. In reality, their aggression is being absorbed by larger passive buyers. Once that liquidity runs out and buyers stop absorbing, shorts are trapped. Those trapped shorts must cover — triggering a fast, aggressive short squeeze upward. Also: CVD on Stablecoin Margined Contracts remains flat while Stablecoin Margined Open Interest rises — showing aggressive shorting being absorbed by larger buyers. Price stability suggests accumulation, not weakness. Since OI stays high, those shorts are still in the game, meaning their positions haven’t been closed yet. If price starts to move up, they’ll be forced to cover — setting up the conditions for a short squeeze. Absorption in Context Absorption isn’t random — it’s the footprint of strong hands quietly taking in sell pressure without letting price break down. While most see weakness, they’re actually witnessing controlled accumulation. Here, price holds steady as CVD trends flat and OI stays high — meaning aggressive shorts are still in the game, being absorbed by larger buyers. Every new short adds fuel to the spring. When that pressure releases, it doesn’t drift — it snaps. Shorts are forced to cover, triggering a sharp, emotional squeeze toward the next liquidity zone around $20–$20.50, where Fibonacci confluence and a weak high align. This is where microstructure meets the macro picture — absorption building the base for a violent move higher. Part 5 – Fibonacci Extension Confirmation To justify the $20–$21 target mathematically, we apply one more Fibonacci extension — from the last swing low to the recent high, projected forward. The 1.618 extension aligns almost perfectly around $20.00, adding strong mathematical confluence to our previously defined liquidity and structure zone. That makes $20.00–$20.50 a textbook target cluster — a Fibonacci, liquidity, and volume alignment. Final Outlook – The Path Ahead Based on all the combined data: Fibonacci structure shows completion and new expansion potential Market Profile and VWAP reveal unfinished business around $20–$20.50 Order Flow confirms absorption and hidden accumulation The 1.618 Fibonacci projection reinforces this level as a natural mathematical destination I believe the market will squeeze upward toward $20–$21, taking out the weak high and the LVN pocket — and once that liquidity is collected, rotate back down to restore balance. The setup is mathematically justified, structurally valid, and order-flow supported — a complete picture of how Fibonacci geometry, structure, and liquidity align to reveal where the next phase of this auction may unfold. If price slips lower instead, the key level to watch is $12.90 — the latest 1.618 extension from the initial wave we measured earlier. That remains the deep liquidity and structural boundary where balance could be restored. Last words. Everything we have mapped — Fibonacci structure, confluence, liquidity, and absorption — means nothing without the psychology behind it. The market is not just math and candles; it is a mirror of collective emotion. Every trapped short, every breakout chase, every hesitation is human behaviour written in numbers. When confidence is at its peak, risk is usually greatest. When fear dominates, opportunity hides in plain sight. That is why sentiment often reaches its extreme just before reversals. Most traders only see what is already visible, not what is quietly building beneath the surface. So next time you scroll through social media or read the news about what everyone expects, remind yourself of this: When everyone sees the same breakout, the trade was over hours ago. And the markets whisper long before they speak. From the depths of the sands, ThetaNomad ------------------------------------ If you enjoy this kind of analysis, leave a like and drop a comment. I don’t ask for anything — I just want to help more people learn to look behind the charts, to see the story that price and volume quietly write together.15.015 entry. 0.382 retrace. It lined up to the pixel. You can’t make stuff like this up. That “holy moly!” kind of precision where math, order flow, psychology, and price geometry all meet at once. My stop is in profit. I can’t lose. Precision met patience, and the chart decided to follow. From the depths of the sands, ThetaNomad
ThetaNomad
سطوح حیاتی بیت کوین: مقاومت اول و هدف بعدی کجاست؟
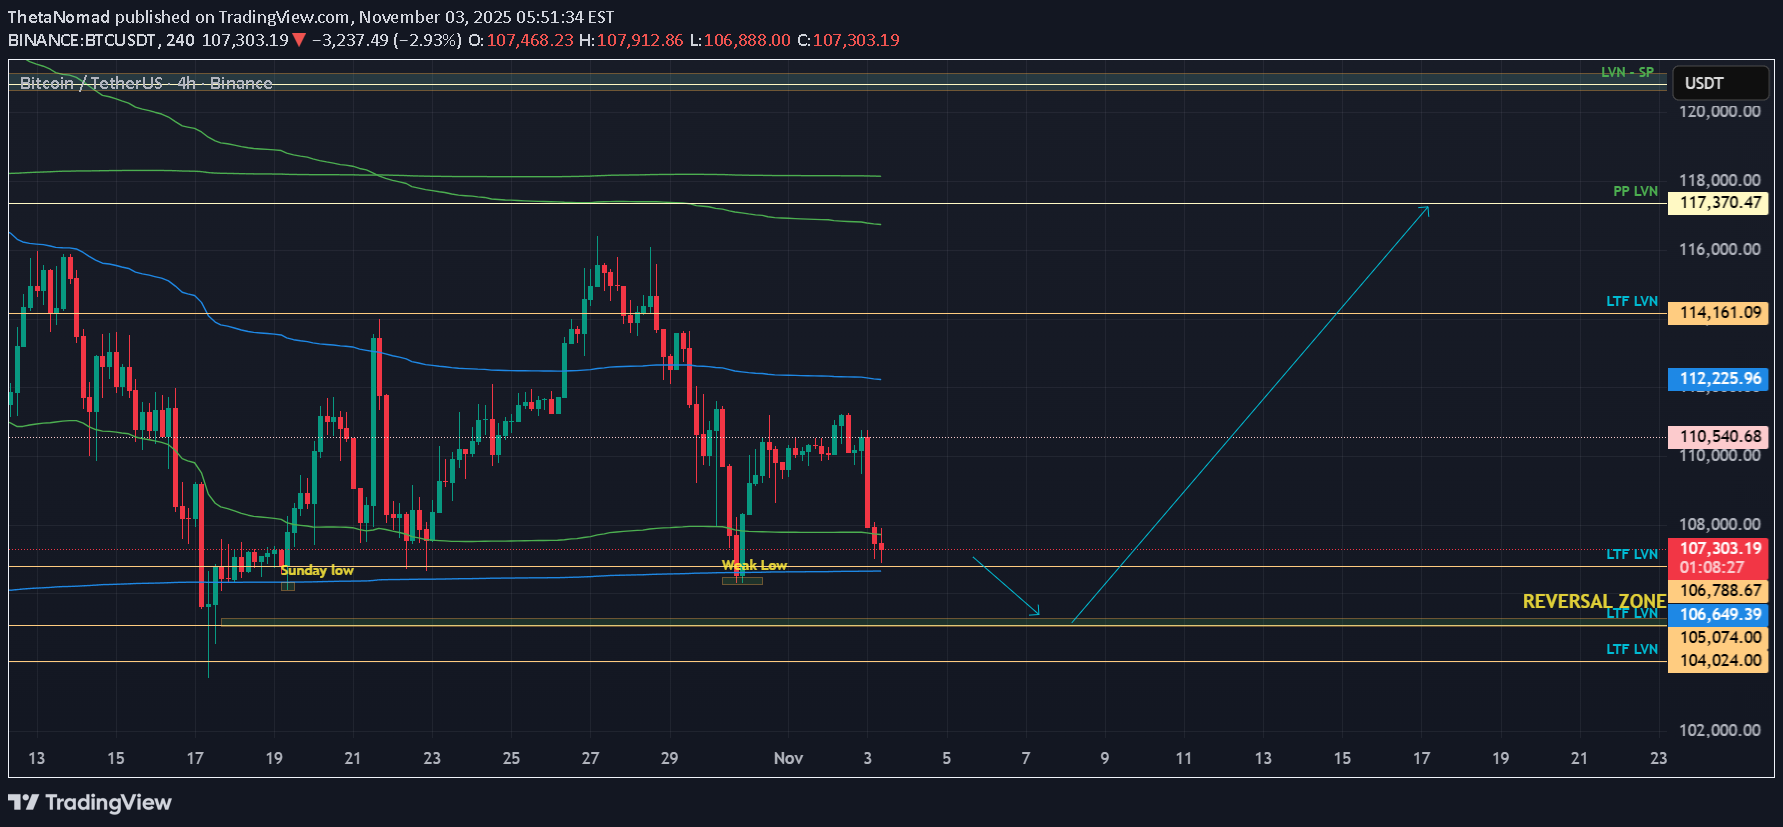
Traders, We dumped. Now we are in a controlled recovery. The question is not only “are we going up” but “where will the market make its real decision.” Right now the chart is giving us two very clean checkpoints. 1. What happened We lost the weekly open and sold off. Spot was selling too, so the dump was real. After the low, spot started buying again and price reclaimed above the big wick. That looks like a failed attempt lower. Markets left a really weak low behind at ~99k. I am convinced we will sweep this low somewhere in the coming weeks. Funding is negative while price is moving up. Shorts are still in the market. This is how squeezes start. 2. First decision zone: 107.300 to 108.000 This area is important because several things come together. 107.300 is a weak high. It stopped at a clean level without strong rejection. That often means liquidity is still sitting above it. The AVWAP anchored from 7 April is there. Price is below it for the first time since that move. When price comes back into an AVWAP from below the market often reacts because old buyers meet new sellers. We also have an LVN just below. That tells us the market did not trade much there before. Price likes to test that kind of gap. So 107k to 108k is our first place to watch the data. If spot keeps pushing and perps do not start selling we can break it. If CVD stalls there it can be a take profit zone. 3. Accumulation and Distribution On both the 1 hour and 4 hour spot charts the Accumulation/Distribution line tells an important story. Price made a clear new low after the dump. The A/D line did not make a new low. It actually started to turn up. That is what traders call a bullish divergence. Price is still falling but the money flow is already improving. In simple words. While candles were going down someone was quietly buying. That means the bounce we see now is not just short covering or a random spike. It was prepared by real spot demand. Futures can show a similar thing but spot is the cleaner signal because it is not influenced by funding, leverage or hedges. When real buyers step in while shorts are still in the market it often creates the right conditions for a squeeze. 4. OBV check On the 4h OBV you can see it popping up from the base after the dump. OBV going up while price is moving up means volume is supporting the move. This agrees with the spot A/D story. It is better when price and OBV move together than when price moves alone. 5. Scenario 1 Price pushes into 107k to 108k. That sweep takes the weak high and tags the AVWAP. If at that point spot CVD slows down or perps start to sell we can reject. A rejection there can send price back into the mid zone and even lower towards 101k to 102k and in extension back to the HTF LVN near 98k. This is the simple “first resistance holds” idea. 6. Scenario 2 This is the one I am leaning toward. Price breaks and holds above 108k. Shorts do not get their reaction. Spot keeps supporting and funding stays negative to flat. Then the market has room to go for the next real liquidity pool which is 117k to 118k. 7. Why 117k to 118k matters On the liquidity heatmap there is clear resting liquidity higher up. Price often travels to those areas because that is where orders are. The golden pocket of the previous move sits in this same zone. Many traders watch this fib area so reactions there are common. Several AVWAP bands from earlier dates are meeting around 117k to 118k. When AVWAPs from different anchors cluster together it creates a stronger level because different groups of traders all care about that price. Between the current price and that zone there are imbalances and LVNs. That means the market moved quickly there before and did not build volume. These thin areas often get filled on the next push. 8. How to read it in real time Above 108k and spot CVD still rising means squeeze is on. Above 108k and funding still negative means shorts are paying to stay wrong. Lose 108k again after a sweep and see CVD roll over means scenario 1 is playing. Price can just dump down without getting more liquidity. But looking unlikely based on the data right now. So if Bitcoin can break and hold above 108k there is not much in the way until 117k to 118k. Final view We dumped on real flow. We are recovering with spot support. We have a clear first test at 107k to 108k. Break and hold and the magnet becomes 117k to 118k because of liquidity, golden pocket, AVWAP confluence and imbalance. TLDR; Bitcoin sold off hard, but the data says the low was bought. Spot A/D started rising while price was still making new lows, funding turned negative and price reclaimed above the wick, which tells us real buyers stepped in while shorts stayed in their positions. Now price is climbing back toward 107k to 108k where a weak high and the April AVWAP are waiting, so that is the first place the market can decide if this recovery is just a bounce or the start of a squeeze. If buyers keep showing up there and we push through, the path above is thin and the next real pocket of liquidity, AVWAP confluence, imbalance and even the golden pocket of the earlier move all sit together around 117k to 118k. That is why this recovery matters. It is not just candles going up. It is positioning, spot flow and liquidity all lining up. If you enjoy this type of analysis or find it helpful, leave a like or drop a comment. I don’t ask for anything in return — I share this to help traders understand what’s really happening behind the charts. It also helps me see if people actually read and value these breakdowns, so if it helped you, let me know below.Bitcoin closed the CME RTH gap — RTH stands for Regular Trading Hours. This is important because the CME (Chicago Mercantile Exchange) only trades Bitcoin futures during traditional U.S. market hours, while the crypto market itself trades 24/7. Here’s why that matters: - If price moves significantly outside RTH-hours, a “gap” appears on the CME chart. - These gaps are often filled later because institutional traders and algorithmic models anchored to CME prices tend to rebalance positions once trading resumes, pulling price back to the last RTH close. - In other words, the CME RTH session represents institutional reference pricing, while the weekend crypto moves represent retail and offshore flow. So when Bitcoin “closes the CME RTH gap,” it means price has retraced to align spot/perp pricing with institutional CME levels — a key signal that markets have re-synced after a period of imbalance.Look closely at USDT Dominance — you can see that W shaping up, like a bird spreading its wings in perfect harmonic symmetry. “When the bird spreads its wings, it’s about to drop a big one.” And when USDT.D drops that harmonic “poop”… 🚀 Bitcoin takes flight. The markets sing in rhythm — one’s fall is another’s rise. 🎶Traders, This Harmonic has to hold. We’re seeing fresh shorts piling in while open interest is increasing — and although it might sound paradoxical, this is exactly what you want before a reversal. We need more aggressive short positioning to fuel a potential squeeze. If the lower level is lost, things will get very interesting and we will most likely tap into the 98k imbalance zone.After.Spot CVD has joined the move up, which means it’s not just a short squeeze anymore — there’s genuine spot demand entering the market. In other words, buyers are stepping in with real volume, not just forced liquidations. Open Interest (OI) is increasing during this move, confirming that new positions are being opened — both longs chasing the breakout and shorts trying to fade it. This combination fuels volatility and often leads to stop runs above local highs. Price is now pushing toward key liquidity zones I marked as weak highs (orange lines). These are areas where liquidity pools from stop orders tend to build up. If price manages to close above 104,000$, the probability of a liquidity sweep toward the next resistance (around 106,200–107,300$) becomes very high — aligning with Scenario 1. Since Wednesday, we’ve been trading inside a value range. The VAH (Value Area High) marks the upper boundary of where 70% of all volume has traded. A breakout above this level signals that the market has agreed to explore new value, meaning traders are comfortable pricing Bitcoin higher. In short: Spot CVD joining = real buying pressure. Rising OI = more participants entering, both sides loading up. Closing above VAH = market ready to reprice higher. Everything aligns for a potential sweep of the highs before we find new equilibrium.#Bitcoin Price broke above the VAH (Value Area High) as described in my earlier post and is now testing the lower outer AVWAP band from the October 7th ATH auction (green line). The VAH represents the upper boundary of the value area where roughly 70% of the volume has traded. Breaking above it means the market temporarily accepted higher prices, but the next step is to see if it can sustain value there. If price fails to hold above the VAH, it often signals a lack of acceptance and a potential return toward the POC or VAL. The AVWAP from the October 7th ATH is equally important. It tracks the average price of participants since that local top, effectively marking where sellers from that move still hold influence. Finding acceptance below this lower AVWAP band suggests that the market is still in a phase of lower value exploration, while a strong reclaim with volume above it would hint at a shift in control back to buyers. In short: Holding above VAH = new value forming higher. Acceptance below AVWAP = sellers still in control. Reclaiming AVWAP = possible momentum shift back to buyers. If price starts accepting here, we need to keep a close eye on the marked Single Print around 105,250. A clean break above that level would likely confirm that Scenario 1 is in play.Expecting price to retrace 0.5% to the last weeks VAH. This will complete an textbook AB=CD. At the same time it will also close the CME ETH Gap. Gaps like these often get refilled within 2 days.In my Analysis I wrote: • Price pushes into 107k–108k • That sweep takes the weak high and tags the AVWAP • If spot CVD slows or perps start selling, rejection is likely • Rejection sends us back to the mid-zone and possibly 101k–102k, with an extension toward the HTF LVN at 98k • Classic “first resistance holds” idea Scenario 1 now unfolded Pixel Perfect! This is why planning and execution is so important. I kept all my longs — and hedged short at $107,444. Data is not really giving me to much trapped longs. CVD is giving me more bearish absorption, than bearish confirmation. Meaning I'm expecting more upside potential. Will monitor the data closely now.Bitcoin just opened CME and dumped in the 104k imbalance. At the same time it closed the ETH CME gap. This is very important. We might see a new upwards wave starting from here .Based on everything I wrote above, and the fact that we just did this I believe the market will set-up to go after scenario 2. Let's see where the market brings us!Traders, Bitcoin swept the weekend liquidity earlier today. Within the order flow, we can see a massive buildup of new net short positions combined with a clear rise in Open Interest. This tells us that many traders are opening shorts near the lower range of this structure. As long as price holds above 100,650 USD, there is a strong probability that the market will start to reverse. The amount of short exposure built up here is immense, which means that any move to the upside could trigger a fast and violent short squeeze. If price decides to move lower first, keep a close eye on 100,200 USD. Losing that Fibonacci level would likely push Bitcoin into the liquidity pocket around 98,000 USD. My current thesis is that the market will squeeze up to take out those trapped shorts. The first target zone sits around 109,250 USD, where we have a CME Bitcoin-ETH gap and some local imbalance. The second target zone is near 112,000 USD, which aligns with a higher timeframe AVWAP and another imbalance zone. Eventually, I still expect a sweep of the larger liquidity cluster sitting near 118,500 USD. Once that area is cleared, a mean reversion from that zone becomes highly probable. If we lose the current level, the next logical downside magnet sits near 97,500 USD, which lines up with the next mathematical support area.At the end of the day: Scenario 1 played out. Now it's just waiting. To see where the data brings us.
ThetaNomad
بیت کوین: طمع فروشندگان در 105 هزار دلار و صعود به سوی 117 هزار!
Tüccarlar, Son analizimde Daha büyük bir düşüş öncesinde Bitcoin'ın 117.000-117.500'e ulaşacağını söyledim. Fiyat henüz bu seviyelere ulaşmadı ve anında düştü. Ancak ana tez hâlâ geçerli: Fiyatın daha büyük bir geri dönüş öncesinde bu bölgeye (117.000-117.500) ulaşması muhtemel. Ancak ondan önce 105.000 dolardan başlayan kısa bir sıkışma bekliyorum. Neden Bir Sıkışma Bekliyorum? Asya oturumu sırasında yeni kaldıraçlı kısa pozisyon oluşturuldu. Açık Faiz (OI) artarken Net Kısa Pozisyonlar yükseldi, bu da yatırımcıların yeni kısa pozisyonlar eklediğini gösterdi. 107.000-107.500 civarında, hem Spot CVD hem de Coin Margined CVD yükseliş eğilimi gösteriyor. Satıcılar aktif ancak fiyat sabit kalıyor, bu da emilimin göstergesi. Aynı aralıktaki Stablecoin Marjinli CVD, tükenmeyi gösteriyor ve satış baskısının azaldığını gösteriyor. New York açılışında OI, Net Uzun pozisyonlarla birlikte yükselmeye devam etti, bu da agresif uzun pozisyonların artık Asya'da oluşan kısa pozisyona dönüştüğü anlamına geliyor. Bu ne anlama geliyor? Tarihsel olarak, Londra ve New York oturumları Asya'nın konumunu değiştirme eğilimindedir. Asya kısa pozisyon oluşturduğunda, daha sonraki seanslar genellikle bu short pozisyonları tasfiye etmek için fiyatı daha da yükseltir. Bu genellikle kısa bir sıkışmayla sonuçlanır ve bu da şu anda görebildiğimiz şeyle uyumludur. Sonraki Move Aşağıyı Belirleme Fiyatın daha aşağıya inip uzanmayacağına karar vermeden önce, daha düşük bir süpürme olasılığını artıran "mıknatıslar" olan olasılık değişkenlerini (VOP) tanımlamalıyız. 1. Zayıf Perşembe Düşük Doğru şekilde test edilmemiş zayıf bir düşük seviye var. TPO (Zamanlı Fiyat Fırsatı) açısından, güçlü bir satın alma tepkisi olmadan fiyat geçici destek bulduğunda zayıf bir dip oluşur. Bu seviyeler sıklıkla tekrar ziyaret edilir. 2. 19 Ekim Pazar Düşük Ayrıca 19 Ekim'den itibaren Pazar günü görülen en düşük seviye de var. Hafta sonu likiditesinin zayıf olması ve sipariş defterlerinin sığ olması nedeniyle pazar günlerinin en düşük seviyeleri sıklıkla silinir. Hafta boyunca likidite geri geldiğinde, bu verimsiz alanlar dolma eğilimindedir. Aşağıdaki Dengesizlikler ve Hacim Boşlukları Daha sonra, ticaret faaliyetinin sınırlı veya tek taraflı olduğu alanlar olan boşlukları, dengesizlikleri veya LVN'leri (Düşük Hacimli Düğümler) ararız. Bu bölgeler genellikle fiyatların ilgisini çeker çünkü piyasalar denge arayışındadır. Birçok yatırımcı mumlara bakarak "gerçeğe uygun değer boşluklarını" tespit ediyor ancak bu, resmin yalnızca bir kısmını gösteriyor. Gerçek verimsizliği bulmak için, teklif-talep dengesizliğinin tam seviyelerini bulmak için flow sırasını veya Sabit Aralık Hacim Profilini (FRVP) kullanarak mumların içine bakmamız gerekir. Hacim Profili ve Fibonacci Kesişimi Sabit Aralık Hacim Profilini, 19 Ekim Pazar gününün en düşük seviyesi altındaki move itici gücünden çizmek, 105.070 seviyesinde açık bir dengesizlik olduğunu gösteriyor. Kavşakların kontrol edilmesi: 0,786 Fibonacci geri çekilmesi (düşükten yükseğe) 105.070 ile tam olarak aynı hizada 0,886'lık geri çekilme (yüksekten alçaktan yükseğe) aynı zamanda 105.070 ile tam olarak aynı hizada Fibonacci uzantılarının (1.113 ve 1.272) her ikisi de yaklaşık 105.000'i hedefliyor 0,618 uzantısı da 105.000'e yaklaşıyor Tez Özeti Tüm data ve izdihama dayalı olarak: Fiyatın 30 Ekim'deki zayıf ve 19 Ekim Pazar gününün en düşük seviyelerini süpürmesi muhtemel düşüşler Hedef bölge: LVN / dengesizlik 105.000'e yakın Geç short pozisyonlarını yakalayan ve zayıf uzun pozisyonları sallayan bir likidite yakalamasını bekleyin Bundan sonra, bir sonraki major likidite havuzunun bulunduğu 117.000-117.500'e doğru bir geri dönüş bekliyoruz Neden Daha Düşük Bir Tarama Bekleniyor? Asya oturumu önemli ölçüde kısa pozlama oluşturdu 105k civarında verimsizlik ve düşük hacimli bir mıknatıs var Zayıf düşük seviyeler net likidite hedefleri sağlıyor Bu alanlar temizlendikten sonra piyasa yapısı yukarı doğru güçlü bir dönüşü destekliyor Özetle: Bitcoin'nın likiditeyi temizlemek için 105.000 bölgesine doğru bir tarama daha yapması ve ardından daha büyük bir geri dönüş kurulumunun form muhtemel olduğu 117.000-117.500 bölgesine doğru genişlemesi muhtemel. Elbette fiyatlar bu seviyelere tam olarak uymadan da her zaman move yükselebilir veya düşebilir; piyasanın bize kesinlik borcu yoktur. Bu seviyeler basitçe şu anki data ve kesişmeye dayalı en yüksek olasılıklı alanları temsil ediyor. Bu arada, az önce vurulan 'LTF LVN' çizgisi de ~117.500$'a doğru katalizör olabilir. Ancak 105 bin seviyesine ulaşmadıkça pozisyondan uzak duracağım. İlk uzun açılış 107.555 dolardan gerçekleşti.
Sorumluluk Reddi
Sahmeto'nun web sitesinde ve resmi iletişim kanallarında yer alan herhangi bir içerik ve materyal, kişisel görüşlerin ve analizlerin bir derlemesidir ve bağlayıcı değildir. Borsa ve kripto para piyasasına alım, satım, giriş veya çıkış için herhangi bir tavsiye oluşturmazlar. Ayrıca, web sitesinde ve kanallarda yer alan tüm haberler ve analizler, yalnızca resmi ve gayri resmi yerli ve yabancı kaynaklardan yeniden yayınlanan bilgilerdir ve söz konusu içeriğin kullanıcılarının materyallerin orijinalliğini ve doğruluğunu takip etmekten ve sağlamaktan sorumlu olduğu açıktır. Bu nedenle, sorumluluk reddedilirken, sermaye piyasası ve kripto para piyasasındaki herhangi bir karar verme, eylem ve olası kar ve zarar sorumluluğunun yatırımcıya ait olduğu beyan edilir.