19.11.2025 tarihinde sembol BTC hakkında Teknik ThetaNomad analizi

ThetaNomad
آیا بیت کوین بالا میرود یا سقوط میکند؟ تحلیل سطح حیاتی 90 هزار دلاری
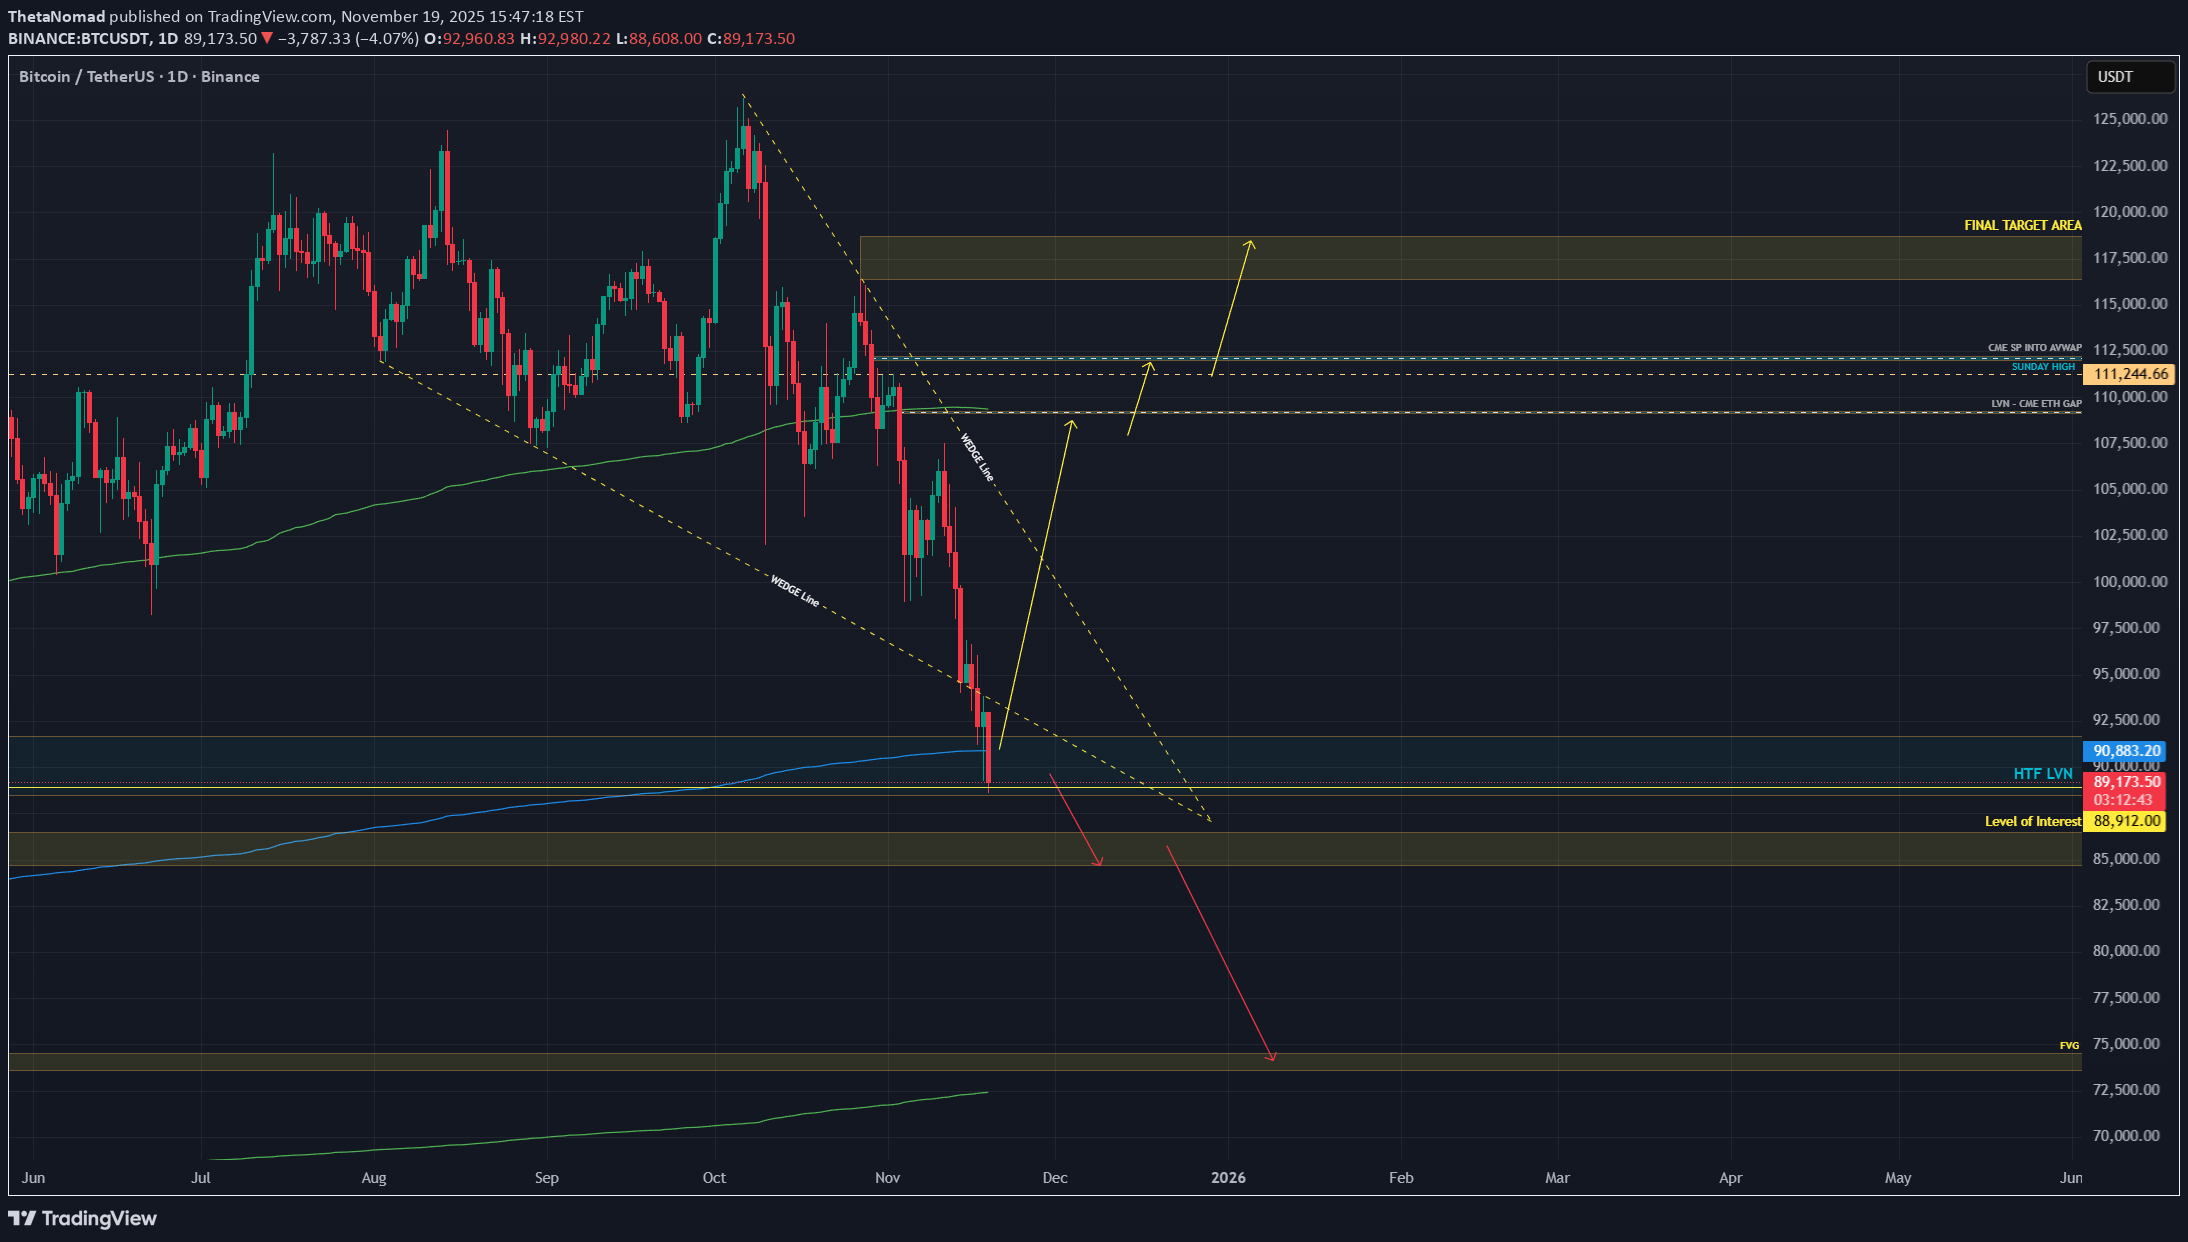
Traders, On November 5 I mapped out a scenario where Bitcoin would push into 107k to 108k and then decline to 98k first and 89k second. This entire scenario has now played out perfectly to the pixel. We swept 108k, we dumped to 98k, and then we flushed into 89k. Where I expected price to retrace from exactly this level: $88.912 So the real question now is simple. What now? Do we break lower, or do we go up? Let’s break Bitcoin down cleanly, without bias, and only by reading structure, levels, and order flow. Levels, Structure and Order Flow AVWAP at the core of the structure Bitcoin is currently trading right near the AVWAP from the 06 August 24 anchor. This is the blue line on your chart and the exact level is 90.881. This anchor began with a large volume impulse. When heavy volume kicks off a leg, the AVWAP from that point becomes a core reference level for the entire future auction. We are now sitting right on top of it, which is exactly where you would expect absorption or a strong reaction. The market is basically deciding if this AVWAP will hold or break. AB=CD completion The full AB=CD measured move has completed exactly into the AVWAP zone. This is a clean harmonic completion and adds confluence to why price reacted here. AB=CD means the downside leg is symmetrical and usually marks exhaustion inside a trend. Fixed Range Volume Profile Using a FRVP from the start of the current HTF auction (07 April until now), we see price wicked directly into the LVN that sits inside the weekly FVG. This area had imbalance and low participation. A wick into an LVN inside an FVG often means that the inefficiency is now cleaned and the auction has reached completion for that side of the range. Wedge breakout Bitcoin technically broke out of the falling wedge, but the breakout does not look clean. We are outside the wedge, but momentum on the breakout is weak. True confirmation would come if price re-enters the wedge from the outside and climbs back through the wedge body. Re-entering the wedge tells you that the breakdown was liquidity and not a structural continuation. If we reclaim it, upside targets become more likely. Order Flow – What the data shows Spot and Futures CVD Across the 15m, 30m and 1h charts, Spot CVD is forming a bullish divergence. Price keeps making lower lows, but Spot CVD is holding higher. This shows that spot buyers are stepping in at the lows and absorbing sell pressure. Futures CVD on both stablecoin margined and coin margined contracts continues to push lower. Price is not following these lower lows. This creates hidden bullish divergence and confirms that aggressive sellers are hitting the market while limit buyers are absorbing the pressure. This is a classic sign of absorption. Selling continues, but the market is refusing to break lower with the same intensity. Open Interest – A shift Earlier in the dump, Open Interest was falling. This means positions were being closed. Most of this was shorts taking profit or exiting the move. When OI drops during a downtrend, continuation becomes harder because the move loses fuel. Near the end of the screenshots, there is a shift. Both stablecoin margined and coin margined OI start to rise again. This rise in OI happens while: CVD continues to make lower lows Price stops making new lows Price begins to stabilize This tells us that new positions are being opened at the lows. Given the CVD behavior, most of these are new shorts entering the market. When new shorts enter and price does not break, the probability of those shorts becoming trapped increases. If buyers step in, this setup often leads to a short squeeze. This is how reversals form in a controlled market. Funding rate – Binance Funding is positive but very small. This means there is no extreme long pressure. There is no overcrowding on the long side. The market is not stretched. With fresh shorts entering at the lows and funding staying neutral, the market can turn quickly if support holds. What this means The combination of: Spot CVD divergence Hidden bullish divergence on futures CVD Rising Open Interest at the lows Neutral funding Price refusing to break down - So price needs to hold. shows that the market is absorbing aggressive selling at a key level. If buyers defend the current level, this can force newly opened shorts to cover, which would fuel the next move up. Targets 109k This is the first upside objective. There is a CME ETH gap resting at this level and gaps of this type tend to get filled. 109k also aligns with the 1.113 Fibonacci extension of the latest wave. This makes it the first logical level if price continues to hold the AVWAP and absorb selling pressure. 112k The next major level is 112k. This area contains single prints on CME and matches an AVWAP level on the BTC CME chart. 112k also lines up with the 1.272 extension of the wave. From a Fibonacci rotation perspective, 1.272 is the next stop after 1.113 and often acts as a mid-cycle continuation target. 118.800 The final target sits at 118.800. This is the full 1.618 extension of the wave and mathematically completes the auction. If the market rotates from AVWAP support, this level becomes the natural endpoint of the move. As long as price continues to hold the AVWAP at 90.881 and the market keeps absorbing futures selling, all three upside targets remain in play. Invalidation The structure changes only if price breaks below 88k. A clean drop under 88k opens the door for the next major high timeframe support at 85k. 85k carries strong confluence. It aligns with the 0.786 Fibonacci retracement on the HTF move and sits directly on a Point of Control zone within the Fixed Range Volume Profile. Below that level, the auction shifts into a lower structure entirely. TLDR Bitcoin completed the downside scenario perfectly. Price is now sitting directly on the AVWAP at 90.881. AB=CD is complete. LVN inside weekly FVG has been cleaned. Futures CVD is still pressing lower but price is not. That is absorption. But the key update is OI. OI was dropping earlier on the LTF, but now OI is rising again, and this is happening while CVD continues down and price holds steady. That means new shorts are entering the market and getting absorbed. If AVWAP holds, expect a bounce. Targets: 109k 112k 118.8k If 88k breaks, 85k is next. -------- Abbreviation List AVWAP Anchored Volume Weighted Average Price. A dynamic support or resistance level based on volume since a chosen anchor. AB=CD A harmonic measured move where AB equals CD. FRVP Fixed Range Volume Profile. Shows where volume was traded inside a chosen range. LVN Low Volume Node. A low interest level where price often rejects strongly. FVG Fair Value Gap. An imbalance left by aggressive price moves. CVD Cumulative Volume Delta. Tracks buying vs selling pressure. OI Open Interest. The amount of open futures positions. POC Point of Control. Level with the highest traded volume. -------- If you like this kind of analysis, drop a like and leave a comment. Everything here is shared for free so more people can cut through the noise and finally see what is actually happening under the surface. No hopium. No fear. Just real data, real structure, and real order flow. The goal is simple. To help traders stop guessing and start understanding what the market is actually saying. Stay sharp. Stay objective. And remember… the chart whispers long before it speaks. - ThetaNomad