
BitonGroup
@t_BitonGroup

تریدر چه نمادی را توصیه به خرید کرده؟
سابقه خرید
تخمین بازدهی ماه به ماه تریدر
پیام های تریدر
فیلتر
نوع پیام
BitonGroup
XAUUSD Video Analysis Brief – Weekly Forecast Summary (2025)

این ویدئو سناریوهای کلیدی و چشمانداز فنی طلا (XAUUSD) را در بازه زمانی هفتگی خلاصه میکند و هم پیشبینیهای مبتنی بر فیبوناچی و هم اصول کلان را ادغام میکند. Core راه اندازی طلا در حال حاضر در نزدیکی پسوند فیبوناچی 161.8% (3276 دلار) قرار دارد. قبل از اصلاح بالقوه move، شکست به $3500 امکان پذیر است. سناریو 1: ادامه صعودی طلا به بالای 3,435 دلار می شکند ← افزایش تا 4300 دلار ← ادامه به سوی اهداف major فیبوناچی: TP: 4320 دلار، که سطح فیبوناچی 261.8٪ است. سناریو 2: اول اصلاح طلا نمی تواند در بالای 3435 دلار نگه داشته شود ← باعث اصلاح سالم در موارد زیر می شود: TP1: 2920 دلار TP2: 2650 دلار اگر سطح حمایت 161.8 درصد در ناحیه اصلاح باقی بماند، یک فاز صعودی تجدید انتظار می رود. تراز ماکرو خرید طلای بانک مرکزی (به ویژه بریکس) از پیشنهاد بلندمدت حمایت می کند. سیاست فدرال رزرو متمایل به دوویش → بادهای دنباله دار برای طلا. همبستگی معکوس با DXY: DXY زیر 98.95 → صعودی برای طلا DXY بالای 100 → تصحیح سیگنال تاثیر روی آلت کوین ها اگر اصلاحات مبتنی بر ریسک باشد، ممکن است سرمایه به آلت کوین تبدیل شود. اگر توسط استرس کلان یا قدرت USD تحریک شود، alts ممکن است در کنار طلا سقوط کنند. این تجزیه و تحلیل یک چارچوب چند سناریویی برای حرکت در حرکتهای major بعدی در طلا ارائه میدهد، با سطوح کلیدی که باید به طور یکسان برای معاملهگران، سرمایهگذاران و تحلیلگران کلان مراقب باشند.
BitonGroup
Gold (XAUUSD) Weekly TF 2025

Overview This analysis outlines the structural Fibonacci confluences, scenario planning, and macro-aligned projections for Gold (XAUUSD) on the weekly timeframe. It integrates multi-layered Fibonacci extensions and retracements, mapping out key support and resistance levels, and proposes a nuanced primary scenario that includes both intermediate rallies and corrective movements. Primary Scenario – Multi-Stage Movement Hypothesis We anticipate that gold may initially extend higher from the current level (~$3,325) to test the 127.2% Fibonacci extension at $3,435, with the possibility of a further intermediate peak near $3,500. This level marks a psychological and technical resistance zone and could act as a temporary top. Following this local peak, a corrective phase may unfold. This pullback could evolve into one of the two outlined correction scenarios: 1 TP Correction Scenario Support Target: ~$2,950 Basis: 100% Fib extension confluence and prior resistance turned support Expected Outcome: Price stabilizes at this level and resumes upward momentum 2 TP Correction Scenario Support Target: ~$2,650 Basis: Strong historical structure + 100% Fib confluence from a broader cycle Expected Outcome: This zone acts as a long-term demand accumulation area Upon completion of the corrective structure, we expect gold to reinitiate its primary bullish trend. Bullish Continuation Targets TP1: ~$4,050 (161.8% Fibonacci extension) TP2: ~$4,319 (261.8% Fibonacci extension) These targets align with macroeconomic conditions, central bank accumulation trends, and long-term structural cycles. Supporting Technicals RSI: Holding above 50, indicating preserved bullish momentum MACD: Positive crossover with widening histogram on weekly timeframe Price Action: Strong support zone between $3,280–$3,300 aligning with 161.8% Fib retracement of the recent minor wave Macro Fundamentals & Correlations Central Bank Gold Demand: Sustained net buying by BRICS nations, particularly China and Russia, supports the structural bid on gold Fed Policy: Market anticipates a prolonged pause or gradual rate cuts, favoring non-yielding assets like gold DXY & US10Y Yields: Any further decline in DXY or softening yields would add tailwinds to gold Crypto Correlation: During inflationary hedging or systemic risk periods, gold and crypto may correlate positively, especially with weakening USD Intermarket Relationships: Gold, DXY, and TOTAL (Crypto Market Cap) Gold vs. DXY (US Dollar Index) Gold historically maintains an inverse correlation with DXY. A rising DXY tends to apply downward pressure on gold prices, while a falling DXY enhances gold's upside momentum. Scenario Interactions: If DXY breaks below 98, this could validate the bullish scenario for gold toward $3,435–$4,050. If DXY rallies back above 100, it could trigger the correction scenarios ($2,950 or $2,650) in gold. Gold vs. TOTAL (Crypto Market Cap) Gold and TOTAL may show positive correlation during periods of USD weakening and global liquidity expansion. Scenario Interactions: If gold rallies toward $3,500 and TOTAL also breaks key resistance (e.g., $1.8T–$2T), this signals synchronized bullish risk appetite. If gold corrects while TOTAL continues to rise, it could indicate rotation of liquidity from defensive to risk-on assets. A simultaneous correction in both may occur if DXY strengthens aggressively or if macro shocks reduce global liquidity. These intermarket relationships should be monitored continuously to assess the evolving macro context and validate the chosen scenario. In the case of a gold correction toward $2,950 or $2,650, the impact on altcoins will hinge on the prevailing macroeconomic backdrop. If the correction stems from a healthy, technical rebalancing within a risk-on environment—without a concurrent surge in the U.S. dollar—it could signal a shift in capital from defensive assets like gold into more speculative plays, including altcoins. This type of capital rotation often benefits the crypto market, particularly if TOTAL (crypto market cap) holds or advances structurally. However, if the correction is caused by rising dollar strength, tightening financial conditions, or broader risk-off sentiment, altcoins may instead suffer alongside gold, as liquidity is withdrawn across the board. Therefore, the context and drivers behind gold’s correction are crucial in assessing its downstream effects on altcoin performance. From a philosophical lens, gold's cyclical ascent and retreat mirrors the rhythm of nature and human experience—expansion, contraction, and renewal. Just as rivers carve valleys before surging toward the ocean, the market too must surrender gains to gather force. A correction in gold is not merely a financial event, but a moment of recalibration—an inhale before the next exhale of momentum. It invites reflection: whether wealth seeks refuge or ventures into risk, whether fear contracts or ambition expands. In this interplay, altcoins may inherit the restless spirit of capital in search of yield, as gold, the ancient anchor of value, briefly pauses in its timeless journey. Conclusion We present a multi-phased path for gold where: An initial bullish breakout toward $3,435–$3,500 forms a short- to mid-term peak A subsequent correction brings gold to either $2,950 or $2,650, depending on macro triggers A renewed bull rally drives gold toward $4,050 and potentially $4,319 and beyond This scenario reflects both the cyclical nature of market structure and the macro-fundamental backing that continues to support long-term gold strength.the bullish momentum seems to be kicked offFirst Target AchievedAll Targets Achieved
BitonGroup
S&P 500 Index (SPX) Weekly TF – 2025
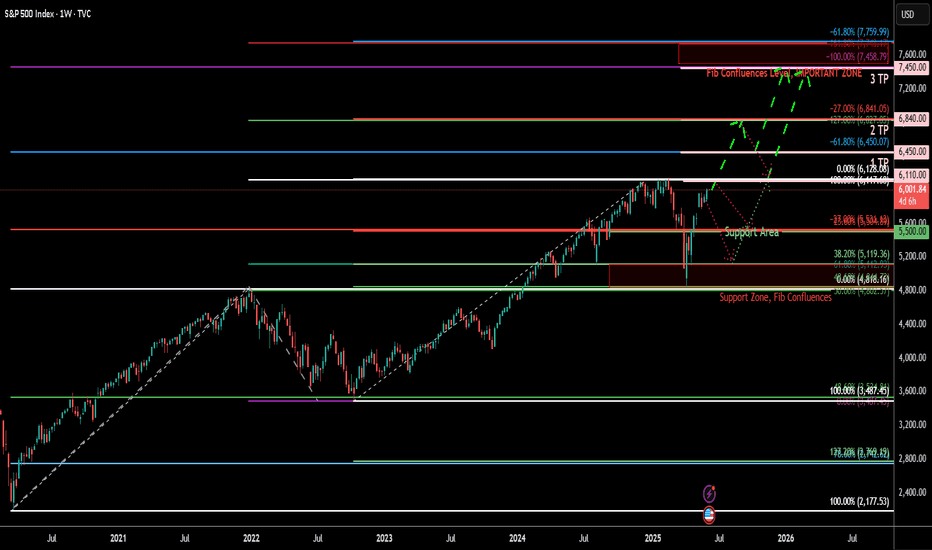
متن نمودار: ابزارهای مورد استفاده: 3 ابزار فیبوناچی: 1. یکی ** فیبوناچی اصلاح ** (از ATH تا پایین) 2. دو ** الحاقات فیبوناچی مبتنی بر روند ** * سطح و مناطق کلیدی: *** منطقه پشتیبانی ** (تلاقی فیبر): \ ~ 4،820-5،100 *** منطقه پشتیبانی (عقب کشیدن کم عمق) **: \ 5،500-5،600 *** مناطق مقاومت و TP: ** *tp1: ** 6،450 ** (تلاقی فیبر و -61.8 ٪) *TP2: ** 6،840 ** (-27 ٪) *tp3: ** 7،450-7،760 ** (Major تلاقی) مشاهدات فنی: *SPX در حال نزدیک شدن به ** مقاومت بحرانی ** در نزدیکی قبلی ATH (\ 6128) با مسیر پیش بینی شده به سمت بالا است. *مسیر شکسته سبز ** ** ادامه تجمع از سطح 6،000 فعلی به TP1 (\ 6،450 \ \ \ ~ 6،840) و در نهایت TP3 (\ 7،450-7،760) ، اگر NO major شوک ماکرو برخورد می کند. *مسیر ** بنفش نقطه ** ** بازگرداندن بالقوه را در ابتدا به 5،600 \ ~ (تصحیح کم عمق) یا عمیق تر در 5،120 ~ یا حتی 4،820 منطقه قبل از ادامه تجمع صعودی نشان می دهد. *منطقه پشتیبانی major در اطراف ** 4،820-5،120 ** شامل سطح کلیدی اصلاح فیبر (38.2 ٪ و 61.8 ٪) از هر دو پسوند و سطح شکستن تاریخی است. زمینه اساسی: *اقتصاد ایالات متحده ** انعطاف پذیری ** در میان روایت نرم افزار نرم ، هرچند که تورم چسبنده است. *** فدرال رزرو ** انتظار می رود نرخ ها را در ** Q3 -Q4 2025 ** کاهش دهد و باعث افزایش ارزش سهام شود. *انبساط نقدینگی و چشم انداز چشم انداز از دارایی های خطر ، از جمله ** سهام و رمزنگاری **. *با این حال ، ** تجمع فناوری AI محور ** ممکن است بیش از حد کشیده شود. تصحیح می تواند از ناامیدی های درآمد یا شگفتی های کلان (به عنوان مثال ، مشاغل یا شوک های CPI) پیروی کند. تعصب و سناریوهای روایت: ** سناریو 1 - تصحیح قبل از تجمع (مسیر بنفش) ** * اگر SPX با بازگرداندن کلان (به عنوان مثال ، CPI بالا ، فدرال هاوکی فدرال) روبرو است ، انتظار می رود که در این زمینه تنظیم شود: * 5،600 = منطقه -23.6 ٪ منطقه * 5،120-4،820 = Major منطقه تلاقی فیبر *اینها act به عنوان مناطق تجمع ** ** ، پای بعدی را به سمت TP1 و بعد از آن تنظیم می کنند. *** تأثیر بر طلا **: ممکن است به دلیل ریسک کردن به طور موقت افزایش یابد move. *** اثر بر روی رمزنگاری **: می تواند متوقف یا تصحیح شود ، به خصوص altcoins. ** سناریو 2 - رالی مستقیم (مسیر سبز) ** * در صورت تأیید ، برش ها و ماکرو نرم باقی می ماند: * SPX شکسته ATH (\ ~ 6،128) * به TP1 (\ ~ 6،450) ، TP2 (\ 6،840 \) برخورد می کند *سرانجام در ** tp3 (7،450-7،760) به تلاقی می رسد ** *** تأثیر بر طلا **: ممکن است مبارزه کنید. اولویت سرمایه گذار برای سهام. *** تأثیر بر Crypto **: اشتها ریسک شدید ، ادامه Altseason. شاخص های مورد استفاده: * 3 سطح فیبوناچی (اصلاح + 2 پسوند) * Trendlines (کلان و محلی) * نقشه برداری تلاقی فلسفی/روایت Layer: این مرحله از بازار شبیه آزمون اعتماد به نفس جمعی است. بازارهای سهام نزدیک به ATHS در حالی که سهولت پولی شروع می شود ، منعکس کننده یک شکننده optimism است. سطح فیبوناچی act به عنوان پاسگاه های روایت - روانشناختی به اندازه ریاضی. آیا ما به ایمان تجمع کرد یا برای تعادل مجدد سقوط کرد؟ تعصب و دلالت استراتژی: تعصب: صعودی با احتیاط * استراتژی: *در انتظار ** شکست تأیید> 6،128 ** برای ورودی های طولانی تازه *در صورتی که اصلاح شود ، در منطقه ** 5،100-5،500 ** منطقه جمع می شود *از ** TP1 ، TP2 ، TP3 ** به عنوان خروجی صحنه استفاده کنید نمودارهای مرجع مرتبط: * BTC. تجزیه و تحلیل - تعصب نزولی: * کل: تعصب صعودی *Total3 - تعصب صعودی: * بازده US10Y - سقوط تعصب: اولین هدف به دست آمد
BitonGroup
Ethereum / US Dollars (ETHUSDT) Short Selling with DCA 19/09/23
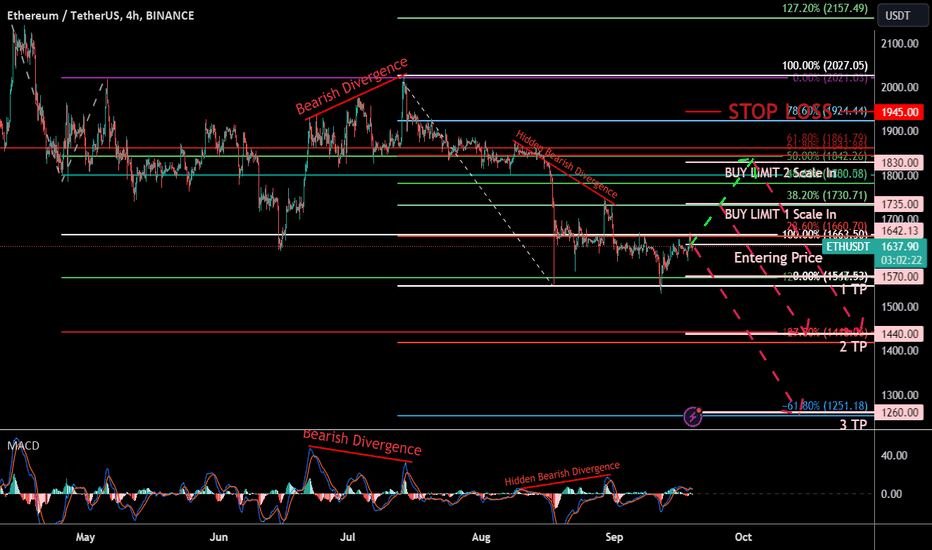
تحلیل تکنیکال: در این تحلیل، من رویکردی جامع را اتخاذ میکنم که سطوح اصلاحی و امتدادی فیبوناچی را با پروجکشن فیبوناچی، تحلیل همگرایی و اندیکاتور MACD ترکیب میکند، با یک گرایش مشخص به فروش استقراضی برای بازه زمانی 4 ساعته، همانطور که در تکلیف درخواستی در بخش پیام لینکدین در تاریخ 15/09/2023، ساعت 12:55 بعد از ظهر ذکر شد. علاوه بر این، یک استراتژی میانگین هزینه دلاری (DCA) استراتژیک با دو سطح افزایش حجم تدریجی معرفی کرد. برای یک تحلیل بصری جامع، لطفاً به نمودار مراجعه کنید: لطفاً برای درک بهتر، نمودار را زوم اوت کنید. مشاهدات کلیدی تکنیکال: سطوح فیبوناچی: تحلیل من به طور دقیق سطوح اصلاحی، امتدادی و پروجکشن فیبوناچی را روی نمودار قرار میدهد، مناطق مقاومت بالقوه را برجسته میکند و گرایش به فروش استقراضی را تقویت میکند. واگرایی MACD: هوشیاری برای الگوهای واگرایی MACD همچنان بسیار مهم است. (واگرایی نزولی) همراه با (واگرایی نزولی پنهان) گرایش به فروش استقراضی را تقویت میکند. نقاط ورود استراتژیک: من نقاط ورود کلیدی را برای آغاز موقعیتهای فروش استقراضی، در قیمت لحظهای 1642 دلار در زمان انتشار، شناسایی میکنم و از حرکات قیمت در هماهنگی با گرایش کلی سرمایه گذاری میکنم. DXY بسیار صعودی است که نشانه دیگری است که نشان میدهد ارزش کل بازار کریپتو ممکن است کاهش یابد و در نهایت BTC به قیمتهای پایینتر سقوط کرد. تحلیل فوق میتواند امکان رالی DXY را نشان دهد. شرایط تکنیکال: سطوح برداشت سود (TPs): برای به حداکثر رساندن سودهای بالقوه از گرایش به فروش استقراضی، سطوح TP زیر را در نظر بگیرید: TP اول: 1570 دلار TP دوم: 1440 دلار TP سوم: 1260 دلار میانگین هزینه دلاری (DCA): من از یک استراتژی DCA برای افزایش حجم تدریجی موقعیتهای فروش استقراضی حمایت میکنم. با یک موقعیت جزئی در نقطه ورود اولیه شروع کنید و به تدریج موقعیت فروش استقراضی را در سطوح افزایش حجم تدریجی DCA زیر اضافه کنید: سطح افزایش حجم 1: سطح قیمت DCA 1: 1735 دلار سطح افزایش حجم 2: سطح قیمت DCA 2: 1830 دلار حد ضرر: مدیریت ریسک عاقلانه شامل قرار دادن حد ضرر در 1945 دلار است که بالاتر از سطح 78.6٪ سطح اصلاحی فیبوناچی معکوس جزئی است، تا از معکوس شدن غیرمنتظره قیمت محافظت شود. سناریوی معاملاتی: گرایش به فروش استقراضی: با توجه به همگرایی مقاومت فیبوناچی، واگرایی نزولی و واگرایی نزولی پنهان MACD و نقاط ورود استراتژیک، تحلیل من به شدت از گرایش به فروش استقراضی حمایت میکند. انطباقپذیری: با شرایط بازار سازگار باشید، برای تنظیم استراتژی خود در پاسخ به هرگونه تحولات غیرمنتظره آماده باشید. این تحلیل مبتنی بر دادههای تاریخی، شاخصهای تکنیکال و یک گرایش نزولی واضح است که با یک استراتژی DCA با دو سطح افزایش حجم تدریجی تکمیل شده است. مانند هر استراتژی معاملاتی دیگر، انجام تحقیقات کامل، رعایت برنامه معاملاتی خود و بهبود مستمر رویکرد خود در حین حرکت در بازارهای پویای ارزهای دیجیتال ضروری است. من مشتاقانه منتظر بینشهای شما و بحثهای جذاب در مورد این تحلیل هستم، زیرا ما فرصتها را در سناریوهای بازار صعودی بررسی میکنیم! نظر: ویرایش: تصحیح خطای تایپی... هر دو سطح افزایش حجم، سفارشهای Sell Limit هستند و یک اشتباه تایپی وجود دارد. *(Buy Limits اشتباه (خطا) تایپی هستند) تصحیح: Sell Limit 1: 1735 دلار Sell Limit 2: 1830 دلار نظر: تحلیل بنیادی - جلسه FOMC، 20 سپتامبر 2023 بررسی اجمالی: جلسه آتی کمیته بازار آزاد فدرال (FOMC) که برای 20 سپتامبر 2023 برنامهریزی شده است، از اهمیت بالایی برای بازارهای مالی در سراسر جهان برخوردار است. یکی از نقاط کانونی این رویداد، تصمیم بالقوه در مورد افزایش نرخ بهره توسط فدرال رزرو S ایالات متحده است. تصمیم نرخ بهره: شرکت کنندگان بازار در حالت آماده باش بالا برای هرگونه نشانه ای از افزایش نرخ بهره در طول جلسه هستند. تصمیم فدرال رزرو در مورد نرخ بهره، پیامدهای عمیقی برای اقتصاد Sایالات متحده و بازارهای مالی جهانی دارد. اگر افزایش نرخ بهره اعلام شود، نشان دهنده پاسخ بانک مرکزی به عوامل مختلف اقتصادی، از جمله تورم، سطوح اشتغال و ثبات کلی اقتصادی است. تاثیر بر دلار Sایالات متحده (DXY): افزایش نرخ بهره معمولاً فشار صعودی بر دلار Sایالات متحده (USD) وارد می کند. در نتیجه، این ممکن است منجر به تقویت شاخص دلار Sایالات متحده (DXY) شود، که عملکرد USD را در برابر سبدی از ارزهای جهان major اندازه گیری می کند. یک USD قوی تر می تواند پیامدهایی برای تجارت جهانی، بازارهای ارز و طبقات دارایی مختلف داشته باشد. تاثیر بر ارزهای دیجیتال: در حوزه ارزهای دیجیتال، یک USD قوی تر از نظر تاریخی با فشار نزولی بر قیمت دارایی های دیجیتال همبستگی دارد. یک USD قوی می تواند ورود سرمایه گذاران خارجی به بازار ارزهای دیجیتال را نسبتاً گران تر کند و منجر به کاهش تقاضا شود. با این حال، توجه به این نکته ضروری است که بازارهای ارزهای دیجیتال تحت تأثیر عوامل چند وجهی، از جمله احساسات بازار، تحولات نظارتی و روندهای اقتصاد کلان قرار دارند. نتیجه گیری: جلسه FOMC در 20 سپتامبر 2023 به عنوان یک رویداد مهم برای سرمایه گذاران و معامله گران در سراسر بازارهای دارایی سنتی و دیجیتال عمل می کند. فراتر از واکنش فوری به تصمیمات نرخ بهره، نظارت بر اظهارات و چشم انداز فدرال رزرو برای کسب اطلاعاتی در مورد سیاست پولی آینده بسیار مهم است. تعامل بین سیاست پولی، مبانی اقتصادی و احساسات بازار، پویایی بازارهای مالی را در روزها و هفته های پس از این رویداد مهم شکل داد. معامله بسته شد: هدف محقق شد: TP اول محقق شد معامله فعال: TP دوم و سوم در حال پیشرفت است
BitonGroup
Zilliqa /US Dollars (ZILUSDT) Short Selling Chance19/02/2023

تحلیل تکنیکال: در این تحلیل، من از یک رویکرد جامع استفاده میکنم که سطوح اصلاحی و گسترشی فیبوناچی را با پروجکشن فیبوناچی، تحلیل همگرایی و اندیکاتور MACD ترکیب میکند، با یک تمایل آشکار به فروش استقراضی (Short Sell) برای بازه زمانی 30 دقیقهای، همانطور که در تکلیف درخواست شده بود. این تحلیل در تاریخ 15/09/2023، ساعت 12:55 بعد از ظهر در بخش پیامهای لینکدین درخواست شده است. علاوه بر این، من یک استراتژی میانگین هزینه دلاری (DCA) استراتژیک با دو سطح افزایش تدریجی (Scale-In) ارائه کرد. لطفاً برای یک تحلیل بصری جامع به نمودار مراجعه کنید: لطفاً برای درک بهتر، نمودار را زوم اوت کنید. مشاهدات کلیدی تکنیکال: سطوح فیبوناچی: تحلیل من به دقت سطوح اصلاحی و گسترشی فیبوناچی را روی نمودار قرار میدهد، مناطق مقاومت بالقوه را برجسته میکند و تمایل به فروش استقراضی را تقویت میکند. واگرایی MACD: هوشیاری برای الگوهای واگرایی MACD بسیار مهم است. (واگرایی نزولی) همراه با (واگرایی نزولی پنهان) تمایل به فروش استقراضی را تقویت میکند. نقاط ورود استراتژیک: من نقاط ورود کلیدی را برای آغاز موقعیتهای فروش استقراضی، با قیمت لحظهای 0.01620 دلار در زمان انتشار، شناسایی میکنم و از حرکات قیمت در هماهنگی با تمایل کلی استفاده میکنم. شاخص دلار (DXY) بسیار صعودی است که نشانهای دیگر است که ارزش کل بازار کریپتو ممکن است سقوط کند و در نهایت BTC به قیمتهای پایینتر سقوط کند. تحلیل فوق میتواند امکان افزایش DXY را نشان دهد. شرایط تکنیکال: سطوح برداشت سود (TP): برای به حداکثر رساندن سودهای بالقوه از تمایل به فروش استقراضی، سطوح TP زیر را در نظر بگیرید: TP اول: 0.01619 دلار TP دوم: 0.01580 دلار TP سوم: 0.01550 دلار میانگین هزینه دلاری (DCA): من یک استراتژی DCA را برای افزایش تدریجی موقعیتهای فروش استقراضی توصیه میکنم. با یک موقعیت جزئی در نقطه ورود اولیه شروع کنید و به تدریج به موقعیت فروش استقراضی در سطوح افزایش تدریجی DCA زیر اضافه کنید: سطح افزایش تدریجی 1: سطح قیمت DCA 1: 0.01635 دلار سطح افزایش تدریجی 2: سطح قیمت DCA 2: 0.01650 دلار حد ضرر: مدیریت ریسک محتاطانه شامل قرار دادن حد ضرر در 0.017 دلار است که بالاتر از سطح 0% اصلاحی فیبوناچی جزئی معکوس قرار دارد، تا در برابر معکوس شدنهای غیرمنتظره قیمت محافظت شود. سناریو معاملاتی: تمایل به فروش استقراضی: با توجه به همگرایی مقاومت فیبوناچی، واگرایی نزولی و پنهان MACD و نقاط ورود استراتژیک، تحلیل من قویاً از تمایل به فروش استقراضی حمایت میکند. انعطافپذیری: نسبت به شرایط بازار انعطافپذیر باشید و آماده باشید تا استراتژی خود را در پاسخ به هرگونه تحول غیرمنتظره تنظیم کنید. این تحلیل بر اساس دادههای تاریخی، اندیکاتورهای تکنیکال و یک تمایل نزولی آشکار، همراه با یک استراتژی DCA با دو سطح افزایش تدریجی استوار است. مانند هر استراتژی معاملاتی، انجام تحقیقات کامل، رعایت برنامه معاملاتی و اصلاح مستمر رویکرد خود در حین حرکت در بازارهای پویای ارزهای دیجیتال ضروری است. من مشتاقانه منتظر نظرات و بحثهای جذاب شما در مورد این تحلیل هستم، زیرا ما فرصتها را در سناریوهای بازار صعودی بررسی میکنیم! نظر: تحلیل بنیادی: جلسه FOMC، 20 سپتامبر 2023 بررسی اجمالی: جلسه آتی کمیته بازار آزاد فدرال (FOMC) که برای 20 سپتامبر 2023 برنامهریزی شده است، از اهمیت بسزایی برای بازارهای مالی در سراسر جهان برخوردار است. یکی از نکات کانونی این رویداد، تصمیم بالقوه در مورد افزایش نرخ بهره توسط بانک فدرال S ایالات متحده است. تصمیم نرخ بهره: شرکتکنندگان بازار برای هرگونه نشانه از افزایش نرخ بهره در طول جلسه در حالت آماده باش هستند. تصمیم فدرال رزرو در مورد نرخ بهره پیامدهای عمیقی برای اقتصاد S ایالات متحده و بازارهای مالی جهانی دارد. اگر افزایش نرخ بهره اعلام شود، نشان دهنده واکنش بانک مرکزی به عوامل مختلف اقتصادی از جمله تورم، سطح اشتغال و ثبات کلی اقتصادی است. تاثیر بر شاخص دلار (DXY): افزایش نرخ بهره به طور معمول فشار صعودی بر شاخص دلار S ایالات متحده (USD) وارد میکند. در نتیجه، این ممکن است منجر به تقویت شاخص دلار S ایالات متحده (DXY) شود که عملکرد USD را در برابر سبدی از ارزهای S جهانی major اندازه گیری میکند. USD قویتر میتواند پیامدهایی برای تجارت جهانی، بازارهای ارز و کلاسهای مختلف دارایی داشته باشد. تاثیر بر ارزهای دیجیتال: در حوزه ارزهای دیجیتال، یک USD قویتر از نظر تاریخی با فشار نزولی بر قیمت داراییهای دیجیتال مرتبط است. USD قوی میتواند ورود سرمایهگذاران خارجی به بازار ارزهای دیجیتال را نسبتاً گرانتر کند و منجر به کاهش تقاضا شود. با این حال، توجه به این نکته ضروری است که بازارهای ارزهای دیجیتال تحت تأثیر عوامل چندوجهی از جمله احساسات بازار، تحولات نظارتی و روندهای اقتصاد کلان قرار دارند. نتیجهگیری: جلسه FOMC در 20 سپتامبر 2023 به عنوان یک رویداد مهم برای سرمایهگذاران و معاملهگران در سراسر بازارهای دارایی سنتی و دیجیتال عمل میکند. فراتر از واکنش فوری به تصمیمات نرخ بهره، نظارت بر اظهارات و چشم انداز فدرال رزرو برای بینش در مورد سیاستهای پولی آینده حیاتی است. تعامل بین سیاست پولی، اصول اقتصادی و احساسات بازار، پویایی بازارهای مالی را در روزها و هفتههای پس از این رویداد محوری شکل داد. معامله بسته شد: حد ضرر فعال شد.
BitonGroup
Shentu / US Dollars (CTKUSDT) Coin Analysis 11/09/2023

Shentu / US Dollars (CTKUSDT) Coin Analysis 11/09/2023 Fundamental Analysis: Shentu Chain is a security-focused delegated proof-of-stake blockchain designed for the secure execution of mission-critical applications, including DeFi, NFTs, and autonomous vehicles. The platform places a strong emphasis on cross-chain compatibility and operates as a Cosmos Hub with comprehensive compatibility for EVM (Ethereum Virtual Machine) and Hyperledger Burrow. It also supports eWASM and Ant Financial's AntChain. Shentu Chain offers a Security Oracle that delivers real-time monitoring of on-chain transactions across various protocols, proactively identifying and flagging potential malicious vulnerabilities before they can be exploited. Depending on their security score, audited blockchain projects from any protocol may qualify for ShentuShield membership, a decentralized reimbursement system designed to compensate users for crypto assets that are lost or stolen due to security issues. ShentuShield memberships are open to all community members of eligible blockchain projects, providing an added layer of security for crypto asset holders in case of unexpected events. Projects on Shentu Chain have the option to code in DeepSEA, an exceptionally secure programming language supported by prominent organizations such as the Ethereum Foundation, Qtum Foundation, and IBM. DeepSEA seamlessly interfaces with the Shentu Virtual Machine (SVM), which is fully compatible with EVM. SVM introduces innovative ways to access, verify, and incorporate risk-related information into smart contract decisions. The native digital utility token of Shentu Chain is CTK, which serves as the core utility for various on-chain functions, including operating the Security Oracle and ShentuShield systems, covering gas costs on the Shentu Chain, and participating in governance decisions within the network. ShentuShield is a decentralized membership system designed to facilitate reimbursements for lost or stolen cryptocurrency assets from any blockchain protocol. The decision-making process for reimbursements lies entirely in the hands of ShentuShield members, who can be blockchain projects or individual community supporters. Members have the option to participate in various capacities, either as Collateral Providers or Shield Purchasers. Collateral Providers contribute their own collateral, typically in the form of CTK tokens, and in return, they earn staking rewards on their staked CTK. They also receive a portion of the fees paid by Shield Purchasers. Shield Purchasers, on the other hand, set aside funds from the Pool to act as a reserve for potential reimbursements of their own cryptocurrency assets. In exchange for this protection, Shield Purchasers pay a fee in CTK, which directly benefits the Collateral Providers. The CTK fees collected from Shield Purchasers are used to compensate Collateral Providers in the event of a reimbursement request. This unique system fosters a collaborative ecosystem where participants collectively share the responsibility of safeguarding crypto assets and providing reimbursement support. It offers transparency through a list of publicly viewable and audited clients, ensuring accountability and trust within the community. The Security Oracle comprises a decentralized network of operators equipped with cutting-edge security technologies, responsible for assessing the trustworthiness of mission-critical smart contracts, particularly those employed in DeFi applications. As compensation for delivering real-time, updatable security scores, these operators are rewarded with CTK tokens. The Security Oracle is designed for interoperability, making it compatible with any protocol. This interoperability empowers users of various protocols to make informed decisions before engaging with smart contracts. Smart contracts that have integrated the Security Oracle can proactively identify and block potentially malicious transactions, thereby mitigating the risk of cryptocurrency asset loss. Although the Shentu Virtual Machine (SVM) is fully compatible with the Ethereum Virtual Machine (EVM), its architecture is inspired by the widely used x86-64 OS process model found in computers worldwide. There is also potential for future extensions to support arm64. The SVM introduces the capability to configure on-chain security parameters, allowing smart contracts to interact with one another in ways that align with their individual risk tolerances. Moreover, the SVM is designed to incorporate a smart contract sandbox, which isolates the operation of smart contracts, particularly those that haven't been adequately secured, from the broader system. This isolation enhances security and minimizes potential risks associated with unverified smart contracts. DeepSEA is a highly secure programming language and compiler toolchain that seamlessly integrates with the Shentu Virtual Machine (SVM), Ethereum Virtual Machine (EVM), eWASM, and Ant Financial's AntChain. DeepSEA has received research grants from Ethereum, IBM-Columbia, and Qtum to advance its exceptionally secure programming language. When developers use DeepSEA for coding, the language automatically generates mathematical proofs to demonstrate the alignment between the intended specification and the actual code. This automatic proof generation enables a more comprehensive level of formal verification and correctness in smart contract development, enhancing security and reliability. Technical Analysis: We have applied Fibonacci retracement tools, extending from $0 to $3.97 the so called last great bullish cycle. Within this analysis, we have identified potential support and resistance areas on the chart based on the retracement levels. In addition to the retracement levels, we have utilized Fibonacci projection tools to delineate additional potential support areas below the previous all-time low price. This projection is based on the most recent market cycle. Consequently, we have established two potential support levels at $0.45 and $0.2. Furthermore, we have outlined three potential price targets using the Fibonacci retracement levels from the ATH cycle. These targets are anticipated within the next few weeks to months and are as follows: First Target Price (1 TP): $0.85 Second Target Price (2 TP): $1.5 Third Target Price (3 TP): $2 These levels serve as key reference points for our analysis, guiding our expectations for future price movements. Sentiment Analysis: Considering the possibility of depreciation in the total market capitalization of cryptocurrencies and the price of Bitcoin (BTC) in the upcoming months, it is reasonable to consider employing a Dollar Cost Averaging (DCA) strategy for long positions at the specified support levels.
BitonGroup
dYdX / US Dollar (DYDXUSDT) Token Analysis 11/09/2023

dYdX / US Dollar (DYDXUSDT) Token Analysis 11/09/2023 Fundamental Analysis: DYDX (dYdX) is the governance token associated with the layer 2 protocol of the decentralized cryptocurrency exchange that shares its name. This token plays a crucial role in facilitating the operation of the layer 2 protocol and empowers traders, liquidity providers, and partners to actively participate in shaping the protocol's future as part of the community. Token holders enjoy various privileges, including the ability to propose changes to the dYdX layer 2 protocol. They also have opportunities for profit through activities such as token staking and trading fee discounts. Leveraging the StarkEx scalability engine from Starkware, the layer 2 solution on dYdX is specifically tailored for cross-margined perpetual trading. This scaling solution enhances transaction speed, eliminates gas costs, reduces trading fees, and lowers minimum trade sizes on the platform. As an open-source platform with smart contract capabilities, dYdX serves as a versatile ecosystem for users to engage in lending, borrowing, and trading various crypto assets. While the platform does support spot trading, its primary focus lies in derivatives and margin trading. Founded in 2017, dYdX secured over $10 million in seed venture capitalist funding and officially launched in 2019. The DXDY token's initial coin offering (ICO) took place on September 9th, 2021. dYdX stands as a cryptocurrency exchange that melds advanced financial tools with the principles of decentralization. The platform offers support for margin trading, a financial product that empowers investors to amplify their exposure to digital assets through leverage. dYdX offers two distinct margin trading options: isolated margin, allowing users to allocate specific funds for a trade, and cross-margin, which utilizes all assets held by a trader on the platform. Additionally, dYdX facilitates the trading of perpetuals, a type of futures contract without a predetermined expiry date. The exchange provides a maximum leverage of 25x on synthetic assets that have no expiration date. When users deposit funds into their dYdX accounts, they immediately begin earning interest, as their assets become part of a global lending pool dedicated to each cryptocurrency. dYdX ensures the security of lenders by requiring borrowers to maintain sufficient collateral in their accounts at all times. Borrowing on dYdX enables users to swiftly acquire any available asset on the platform by using their existing funds as collateral for the loan. Unlike automated market makers such as Uniswap, dYdX employs an order book architecture. dYdX's Layer 2 solution enhances network scalability by implementing zero-knowledge rollup technology, specifically zkSTARKS. This technology generates proofs while validating a batch of transactions off-chain. These proofs are then transmitted back to the blockchain, where they are verified by a smart contract. zkSTARKS allows for the offloading of resource-intensive computations from the mainnet without compromising decentralization. In addition to trading and liquidity provider rewards, dYdX introduces retroactive mining benefits, demonstrating gratitude to historical users and encouraging their continued participation on the Layer 2 protocol. Token holders can stake their assets in dYdX's safety and liquidity pools. The safety pool serves as a safeguard in case of a shortfall event, while the liquidity pool aims to attract high-quality market makers to the platform. DYDX is an ERC-20 token that has been deployed on the Ethereum mainnet. The layer 2 scaling solution utilized by dYdX is constructed on Starkware's ZK-STARKS technology, leveraging the Ethereum blockchain to validate transaction proofs. The DYDX token was initially made available for purchase in September 2021. Antonio Juliano, a seasoned programmer with a strong background in blockchain technology, serves as the Founder and CEO of dYdX. His foray into the cryptocurrency realm began in 2015 when he secured a position as a software engineer at Coinbase, a prominent cryptocurrency exchange platform. Holding a computer science degree from Princeton University, Antonio Juliano embarked on his entrepreneurial journey and established dYdX in early 2017. Zhuoxun Yin assumes the role of Head of Operations at dYdX. His prior experience includes positions at Nimble, a social sales and marketing CRM, and Bain & Company, a renowned consulting service. Zhuoxun Yin pursued his education at the University of Queensland, where he earned a bachelor's degree in commerce. Technical Analysis: We have applied Fibonacci retracement tools, extending from $0 to its all-time high (ATH) of $27.9. Within this analysis, we have identified potential support and resistance areas on the chart based on the retracement levels. In addition to the retracement levels, we have utilized Fibonacci projection tools to delineate additional potential support areas below the previous all-time low price. This projection is based on the most recent market cycle. Consequently, we have established three potential support levels at $1.4 or 95% and $1 Defined by Price Action and $0.5 defined by Projection of the past cycle. Furthermore, we have outlined three potential price targets using the Fibonacci retracement levels from the ATH cycle. These targets are anticipated within the next few weeks to months and are as follows: First Target Price (1 TP): $4.15 Second Target Price (2 TP): $6 Third Target Price (3 TP): $10.5 These levels serve as key reference points for our analysis, guiding our expectations for future price movements. Sentiment Analysis: Considering the possibility of depreciation in the total market capitalization of cryptocurrencies and the price of Bitcoin (BTC) in the upcoming months, it is reasonable to consider employing a Dollar Cost Averaging (DCA) strategy for long positions at the specified support levels.
BitonGroup
JOE / US Dollar (JOEUSDT) Token Analysis 11/09/2023

JOE / US Dollar (JOEUSDT) Token Analysis 11/09/2023 Fundamental Analysis: JOE (JOE) serves as the native token for Trader Joe, a decentralized exchange (DEX) operating on the Avalanche (AVAX) blockchain. Trader Joe offers a range of DeFi services, including swapping, staking, and yield farming. Since its launch in June 2021, the exchange has experienced rapid growth, attracting over $4 billion in total value locked (TVL). Trader Joe places a strong emphasis on a community-first approach and values innovation, speed, and security. The platform aims to provide a comprehensive DeFi experience, offering various services while prioritizing the safety of its users' assets. To achieve these goals, Trader Joe has laid out an ambitious roadmap for 2021, focusing on token-holder growth. This roadmap includes plans for enhanced staking, the addition of non-fungible-token (NFT) exchange listings, collateralization of the JOE token, and the introduction of leveraged trading features. Trader Joe offers a full suite of features akin to a modern decentralized exchange (DEX) and combines this with a user-friendly interface, ensuring swift and cost-effective transactions. Users have the option to participate in yield farms, providing liquidity and earning JOE (JOE) tokens as rewards, which can subsequently be staked and used for voting in governance proposals. In addition to its DEX functionality, Trader Joe operates a lending protocol known as Banker Joe, built upon the Compound (COMP) protocol. This non-custodial lending platform enables users to both borrow and lend funds. Furthermore, users can open leveraged positions, utilizing either their provided liquidity or borrowed funds. Trader Joe is committed to enhancing the utility and adoption of the JOE token. To achieve this, the project is working on several key additions, aiming to establish itself as the primary DeFi platform within the Avalanche ecosystem. These forthcoming features include the ability to use JOE as collateral for borrowing, the introduction of limit orders, and the inclusion of options and futures trading on the platform. Thanks to its rapid pace of innovation and distinctive comic book-inspired branding, Trader Joe has attracted substantial support from prominent figures within the DeFi community. Notable backers include Stani Kulechov, the founder of AAVE (AAVE), and Darren Lau, among others. Trader Joe operates on the Avalanche (AVAX) blockchain, which features a distinctive proprietary consensus mechanism. In this mechanism, all nodes engage in processing and validating transactions by utilizing a directed acyclic graph (DAG) protocol. At present, the management of the project's treasury is entrusted to its developers, Cryptofish and 0xMurloc. However, the Trader Joe community has plans to establish a multi-signature governance mechanism in the future. In the interim, token holders have the ability to vote on the development of the protocol through the Snapshot platform. Trader Joe was founded by two pseudonymous developers known as Cryptofish and 0xMurloc. Cryptofish is a self-described full-stack and smart contract engineer who played an early role in various Avalanche projects, including Snowball and Sherpa Cash. Prior to this, Cryptofish worked at Google and holds a Master's degree in Computer Science from a U.S. university. On the other hand, 0xMurloc is a full-stack developer with a background in launching several startups and serving as a Senior Product Lead at Grab. In addition to Cryptofish and 0xMurloc, the Trader Joe team comprises over a dozen other pseudonymous contributors who work across various areas, including software development, marketing, and community management. The total supply of JOE (JOE) amounts to 500 million tokens. Notably, JOE was introduced to the market without any pre-sale, private sale, or pre-listing allocations. The distribution of JOE tokens is structured as follows: 50% allocated to liquidity providers. 20% allocated to the project's treasury. 20% designated for the team, subject to a three-month cliff period. 10% reserved for future investors, also subject to a three-month cliff period. JOE tokens are being emitted over a 30-month period, and individuals staking JOE can earn 0.05% of all trades conducted on the platform. Furthermore, JOE tokens are designed to share a portion of the fees generated from lending interest and liquidations with the staking pool. It's important to note that the emission rates of JOE are programmed to progressively decrease over time and are set to conclude at the start of January 2024. Technical Analysis: We have applied Fibonacci retracement tools, extending from $0 to its all-time high (ATH) of $2.79. Within this analysis, we have identified potential support and resistance areas on the chart based on the retracement levels. In addition to the retracement levels, we have utilized Fibonacci projection tools to delineate additional potential support areas below the previous all-time low price. This projection is based on the most recent market cycle. Consequently, we have established two potential support levels at $0.13 and $0.07. Furthermore, we have outlined three potential price targets using the Fibonacci retracement levels from the ATH cycle. These targets are anticipated within the next few weeks to months and are as follows: First Target Price (1 TP): $0.6 Second Target Price (2 TP): $1.065 Third Target Price (3 TP): $1.4 These levels serve as key reference points for our analysis, guiding our expectations for future price movements. Sentiment Analysis: Considering the possibility of depreciation in the total market capitalization of cryptocurrencies and the price of Bitcoin (BTC) in the upcoming months, it is reasonable to consider employing a Dollar Cost Averaging (DCA) strategy for long positions at the specified support levels.
BitonGroup
Curve / US Dollars (CRVUSDT) Token Analysis 11/09/2023

تحلیل بنیادی: Curve به عنوان یک صرافی غیرمتمرکز متخصص در استیبل کوین ها عمل می کند و از یک بازار خودکار maker (AMM) برای نظارت بر مدیریت نقدینگی استفاده می کند. سفر آن در ژانویه 2020 آغاز شد و Curve از آن زمان با جنبش مالی غیرمتمرکز (DeFi) مرتبط شد و رشد قابل توجهی را در اواخر سال 2020 تجربه کرد. در ماه آگوست، Curve یک سازمان غیرمتمرکز مستقل (DAO) را معرفی کرد که CRV را به عنوان نشانه اصلی خود دارد. این DAO از ابزار ایجاد مبتنی بر اتریوم، آراگون، برای ایجاد ارتباط بین قراردادهای هوشمند مختلف که مسئول رسیدگی به نقدینگی سپرده شده کاربران هستند، استفاده می کند. شایان ذکر است که حاکمیت در این DAO از نظر وزن و سایر جنبه های key در مقایسه با Aragon متفاوت است. Curve با ایفای نقش خود به عنوان یک بازار خودکار Maker (AMM) که به طور خاص برای تجارت استیبل کوین طراحی شده است، توجه قابل توجهی را به خود جلب کرده است. معرفی توکن DAO و CRV به سودآوری آن افزوده است، زیرا CRV یک عملکرد حاکمیتی را انجام می دهد و بر اساس سطح تعهد نقدینگی و مدت زمان مالکیت آنها بین کاربران توزیع می شود. افزایش معاملات DeFi موقعیت Curve را در این صنعت مستحکم کرده است، زیرا AMM ها همچنان مقادیر قابل توجهی از نقدینگی را مدیریت می کنند که منجر به افزایش سود کاربران می شود. در نتیجه، Curve به طیف گستردهای از شرکتکنندگان DeFi، از جمله افرادی که در کشاورزی بازده و استخراج نقدینگی مشغولند، و همچنین افرادی که به دنبال بهینهسازی بازده هستند و در عین حال دارای استیبل کوینهای نسبتاً پایدار و غیر فرار هستند، پاسخ میدهد. این پلتفرم با تحمیل کارمزد متوسطی درآمد ایجاد میکند که سپس به ارائهدهندگان نقدینگی پاداش داده میشود. منحنی مستلزم خطرات معمولی مربوط به سپرده گذاری وجوه به قراردادهای هوشمند و تعامل با بازارسازان خودکار (AMM) است که در درجه اول خطر از دست دادن دائمی است. با توجه به اینکه Curve به طور انحصاری با استیبل کوین ها سر و کار دارد، احتمال نوسانات سریع بازار کاهش می یابد. با این حال، زمانی که بازارها برای همسو شدن با تعدیلهای قیمتی بین بازارها، مجدداً متعادل میشوند، ممکن است کاربران همچنان ضرر داشته باشند. در حالی که Curve تحت ممیزی قرار گرفته است، تشخیص این موضوع ضروری است که این ممیزی ها خطرات ذاتی مرتبط با قرار گرفتن در معرض یک ارز دیجیتال خاص را از بین نمی برند. Curve (CRV) اولین کار خود را در آگوست 2020، همزمان با راه اندازی Curve DAO انجام داد. نقش اصلی آن خدمت به عنوان یک مکانیسم حاکمیتی، ارائه مشوق ها، تسهیل پرداخت کارمزد، و ارائه ابزاری برای درآمدهای بلندمدت به تامین کنندگان نقدینگی است. مجموع عرضه CRV توکن بالغ بر 3.03 میلیارد است که اکثریت (62٪) به ارائه دهندگان نقدینگی اختصاص یافته است. توکنهای باقیمانده به شرح زیر توزیع میشوند: 30٪ برای سهامداران، 3٪ برای کارکنان و 5٪ به یک ذخیره اجتماعی. توجه به این نکته مهم است که هم تخصیص سهامداران و هم کارکنان مشمول یک برنامه زمانبندی دو ساله است. CRV در معرض خطر قرار نگرفت، و باز شدن تدریجی توکن ها نشان می دهد که تقریباً 750 میلیون توکن باید one سال پس از راه اندازی اولیه در گردش باشد. بنیانگذار و مدیر عامل Curve، مایکل اگوروف، دانشمند روسی با تجربیات متنوع در سرمایه گذاری های مرتبط با ارزهای دیجیتال است. در سال 2015، او NuCypher را تأسیس کرد و در آنجا نقش مدیر ارشد فناوری را بر عهده گرفت. NuCypher یک شرکت ارز دیجیتال است که بر توسعه زیرساخت ها و پروتکل های حفظ حریم خصوصی متمرکز است. Egorov همچنین مغز پشت LoanCoin، یک بانک غیرمتمرکز و شبکه وام است. تیم اصلی Curve در ساختار تخصیص CRV ادغام شده است و به آنها این حق را می دهد که طبق برنامه راه اندازی اولیه، توکن ها را طی یک دوره دوساله دریافت کنند. در آگوست 2020، اگوروف اذعان کرد که با قفل کردن تعداد قابل توجهی از نشانه های CRV در پاسخ به قدرت رای سالارن.فایننس، "واکنش بیش از حد" نشان داده است، که در نتیجه او 71 درصد از کنترل حاکمیتی را در این فرآیند به دست آورد. تحلیل تکنیکال: همانطور که مشاهده می کنیم، قیمت در حال حاضر در محدوده ای است که توسط سطوح اصلاحی فیبوناچی 78.6% و 95% محدود شده است. قابل ذکر است که سطح پشتیبانی بالقوه 0.15 دلار وجود دارد. برای چرخه های صعودی پیش بینی شده، ما سه هدف بالقوه قیمت را تعیین کرده ایم: قیمت هدف اول (1TP): 6.75 دلار قیمت هدف دوم (2TP): 8.5 دلار قیمت هدف سوم (3TP): 11 دلار شایان ذکر است که سطوح مقاومت متعددی در نمودار مشخص شده است که مربوط به سطوح اصلاحی فیبوناچی است. تحلیل احساسات: با توجه به احتمال کاهش ارزش کل ارزش بازار ارزهای دیجیتال و قیمت Bitcoin (BTC) در ماه های آینده، منطقی است که استراتژی میانگین هزینه دلار (DCA) را برای موقعیت های خرید در پشتیبانی مشخص شده در نظر بگیرید. سطوح و قیمت فعلی
BitonGroup
Synthetix / US Dollar (SNX/USDT) Token Analysis 11/09/2023

Synthetix / US Dollar (SNX/USDT) Token Analysis 11/09/2023 Fundamental Analysis: Synthetix is in the process of constructing a decentralized liquidity provisioning protocol accessible for various purposes by any protocol. Its substantial liquidity and minimal fees act as the infrastructure for numerous exciting protocols on both the Optimism and Ethereum networks. A multitude of user-facing protocols within the Synthetix ecosystem, such as Kwenta (Spot and Futures), Lyra (Options), Polynomial (Automated Options), as well as 1inch & Curve (Atomic Swaps), harness Synthetix liquidity to empower their functionalities. Synthetix is developed on the Optimism and Ethereum mainnet platforms. The Synthetix Network is secured by collateral in the form of SNX, ETH, and LUSD, enabling the creation of synthetic assets known as Synths. These Synths mimic and generate returns based on underlying assets without necessitating direct possession of the assets themselves. This pooled collateralization paves the way for a variety of on-chain, composable financial instruments supported by liquidity sourced from Synthetix. Some of the most highly anticipated forthcoming releases from SNX include Perps V2, which seeks to enable cost-effective on-chain futures trading by leveraging off-chain oracles, and Synthetix V3, designed to rebuild the protocol in line with its original objective of becoming a fully permissionless derivatives protocol. You can find more information about Synthetix on their blog or by joining the SNX Discord community. The platform's mission is to expand the cryptocurrency realm by introducing non-blockchain assets, thereby granting access to a more expansive and robust financial market. Synthetix operates as a decentralized exchange (DEX) and serves as a platform for synthetic assets. Its architecture is designed to provide users with exposure to underlying assets through synths, eliminating the need to hold the actual assets themselves. This platform empowers users to autonomously trade and exchange synths, while also offering a staking pool where SNX token holders can stake their tokens and receive rewards in the form of a share of transaction fees from the Synthetix Exchange. To track the underlying assets, Synthetix employs smart contract price delivery protocols known as oracles. This approach ensures that users can seamlessly trade synths without encountering liquidity or slippage issues, and it eliminates the requirement for third-party intermediaries. SNX tokens play a crucial role as collateral for the minting of synthetic assets. Whenever synths are generated, SNX tokens are locked up within a smart contract. Since its inception, the protocol has transitioned to the Optimistic Ethereum mainnet to mitigate gas fees on the network and reduce oracle latency. The SNX token is compatible with Ethereum’s ERC20 standard. The Synthetix network is secured through proof-of-stake (PoS) consensus. Synthetix holders stake their SNX and earn returns from the network fees. Another way for SNX stakers to earn rewards is via the protocol’s inflationary monetary policy, known as staking rewards. The maximum supply of SNX is 323,506,696 coins, of which 269,871,212 SNX is in circulation as of September 2023. At the seed round and token sale stages, Synthetix sold more than 60 million tokens and was able to raise $30 million. Of the total 100,000,000 coins issued during the ICO, 20% was allocated to the team and advisors, 3% to bounties and marketing incentives, 5% to partnership incentives and 12% to the foundation. The network was initially launched in September 2017 by Kain Warwick under the name Havven (HAV). Approximately a year later, the company underwent a rebranding, adopting the name Synthetix. Kain Warwick, the founder of Synthetix, also holds a position as a non-executive director at the blueshyft retail network. Before establishing Synthetix, Warwick had been involved in various other cryptocurrency projects. Additionally, he is the founder of Pouncer, a live auction site exclusive to Australia. Peter McKean, serving as the project's CEO, boasts over two decades of experience in software development. Prior to his role at Synthetix, he worked as a programmer at ICL Fujitsu. Jordan Momtazi, the COO of Synthetix, brings to the team his expertise as a business strategist, market analyst, and sales leader, with a wealth of experience in blockchain, cryptocurrency, digital payments, and e-commerce systems. Justin J. Moses, the CTO, formerly held the position of director of engineering at MongoDB and served as the deputy practice head of engineering at Lab49. He also co-founded Pouncer. Technical Analysis: As we observe, the price has experienced a decline from its all-time high (ATH) of $29 and is currently fluctuating within the Fibonacci retracement levels of 88.6% and 95%. Within this range, there are two noteworthy price support zones at $0.8 and $0.3. We have identified three potential price targets: First Target Price (1TP): $28.8 Second Target Price (2TP): $36.5 Third Target Price (3TP): $46.5 Furthermore, we can regard the major Fibonacci retracement levels as potential resistance levels, which we have indicated on the chart. Sentiment Analysis: Considering the possibility of depreciation in the total market capitalization of cryptocurrencies and the price of Bitcoin (BTC) in the upcoming months, it is reasonable to consider employing a Dollar Cost Averaging (DCA) strategy for long positions at the specified support levels.
سلب مسئولیت
هر محتوا و مطالب مندرج در سایت و کانالهای رسمی ارتباطی سهمتو، جمعبندی نظرات و تحلیلهای شخصی و غیر تعهد آور بوده و هیچگونه توصیهای مبنی بر خرید، فروش، ورود و یا خروج از بازارهای مالی نمی باشد. همچنین کلیه اخبار و تحلیلهای مندرج در سایت و کانالها، صرفا بازنشر اطلاعات از منابع رسمی و غیر رسمی داخلی و خارجی است و بدیهی است استفاده کنندگان محتوای مذکور، مسئول پیگیری و حصول اطمینان از اصالت و درستی مطالب هستند. از این رو ضمن سلب مسئولیت اعلام میدارد مسئولیت هرنوع تصمیم گیری و اقدام و سود و زیان احتمالی در بازار سرمایه و ارز دیجیتال، با شخص معامله گر است.