
keyvankho
@t_keyvankho

What symbols does the trader recommend buying?
Purchase History
پیام های تریدر
Filter
keyvankho
اچبار (HBAR) در آستانه تصمیم بزرگ: آیا الگوی سر و شانه معکوس، صعود ۳۰ درصدی میسازد یا سقوط میکند؟
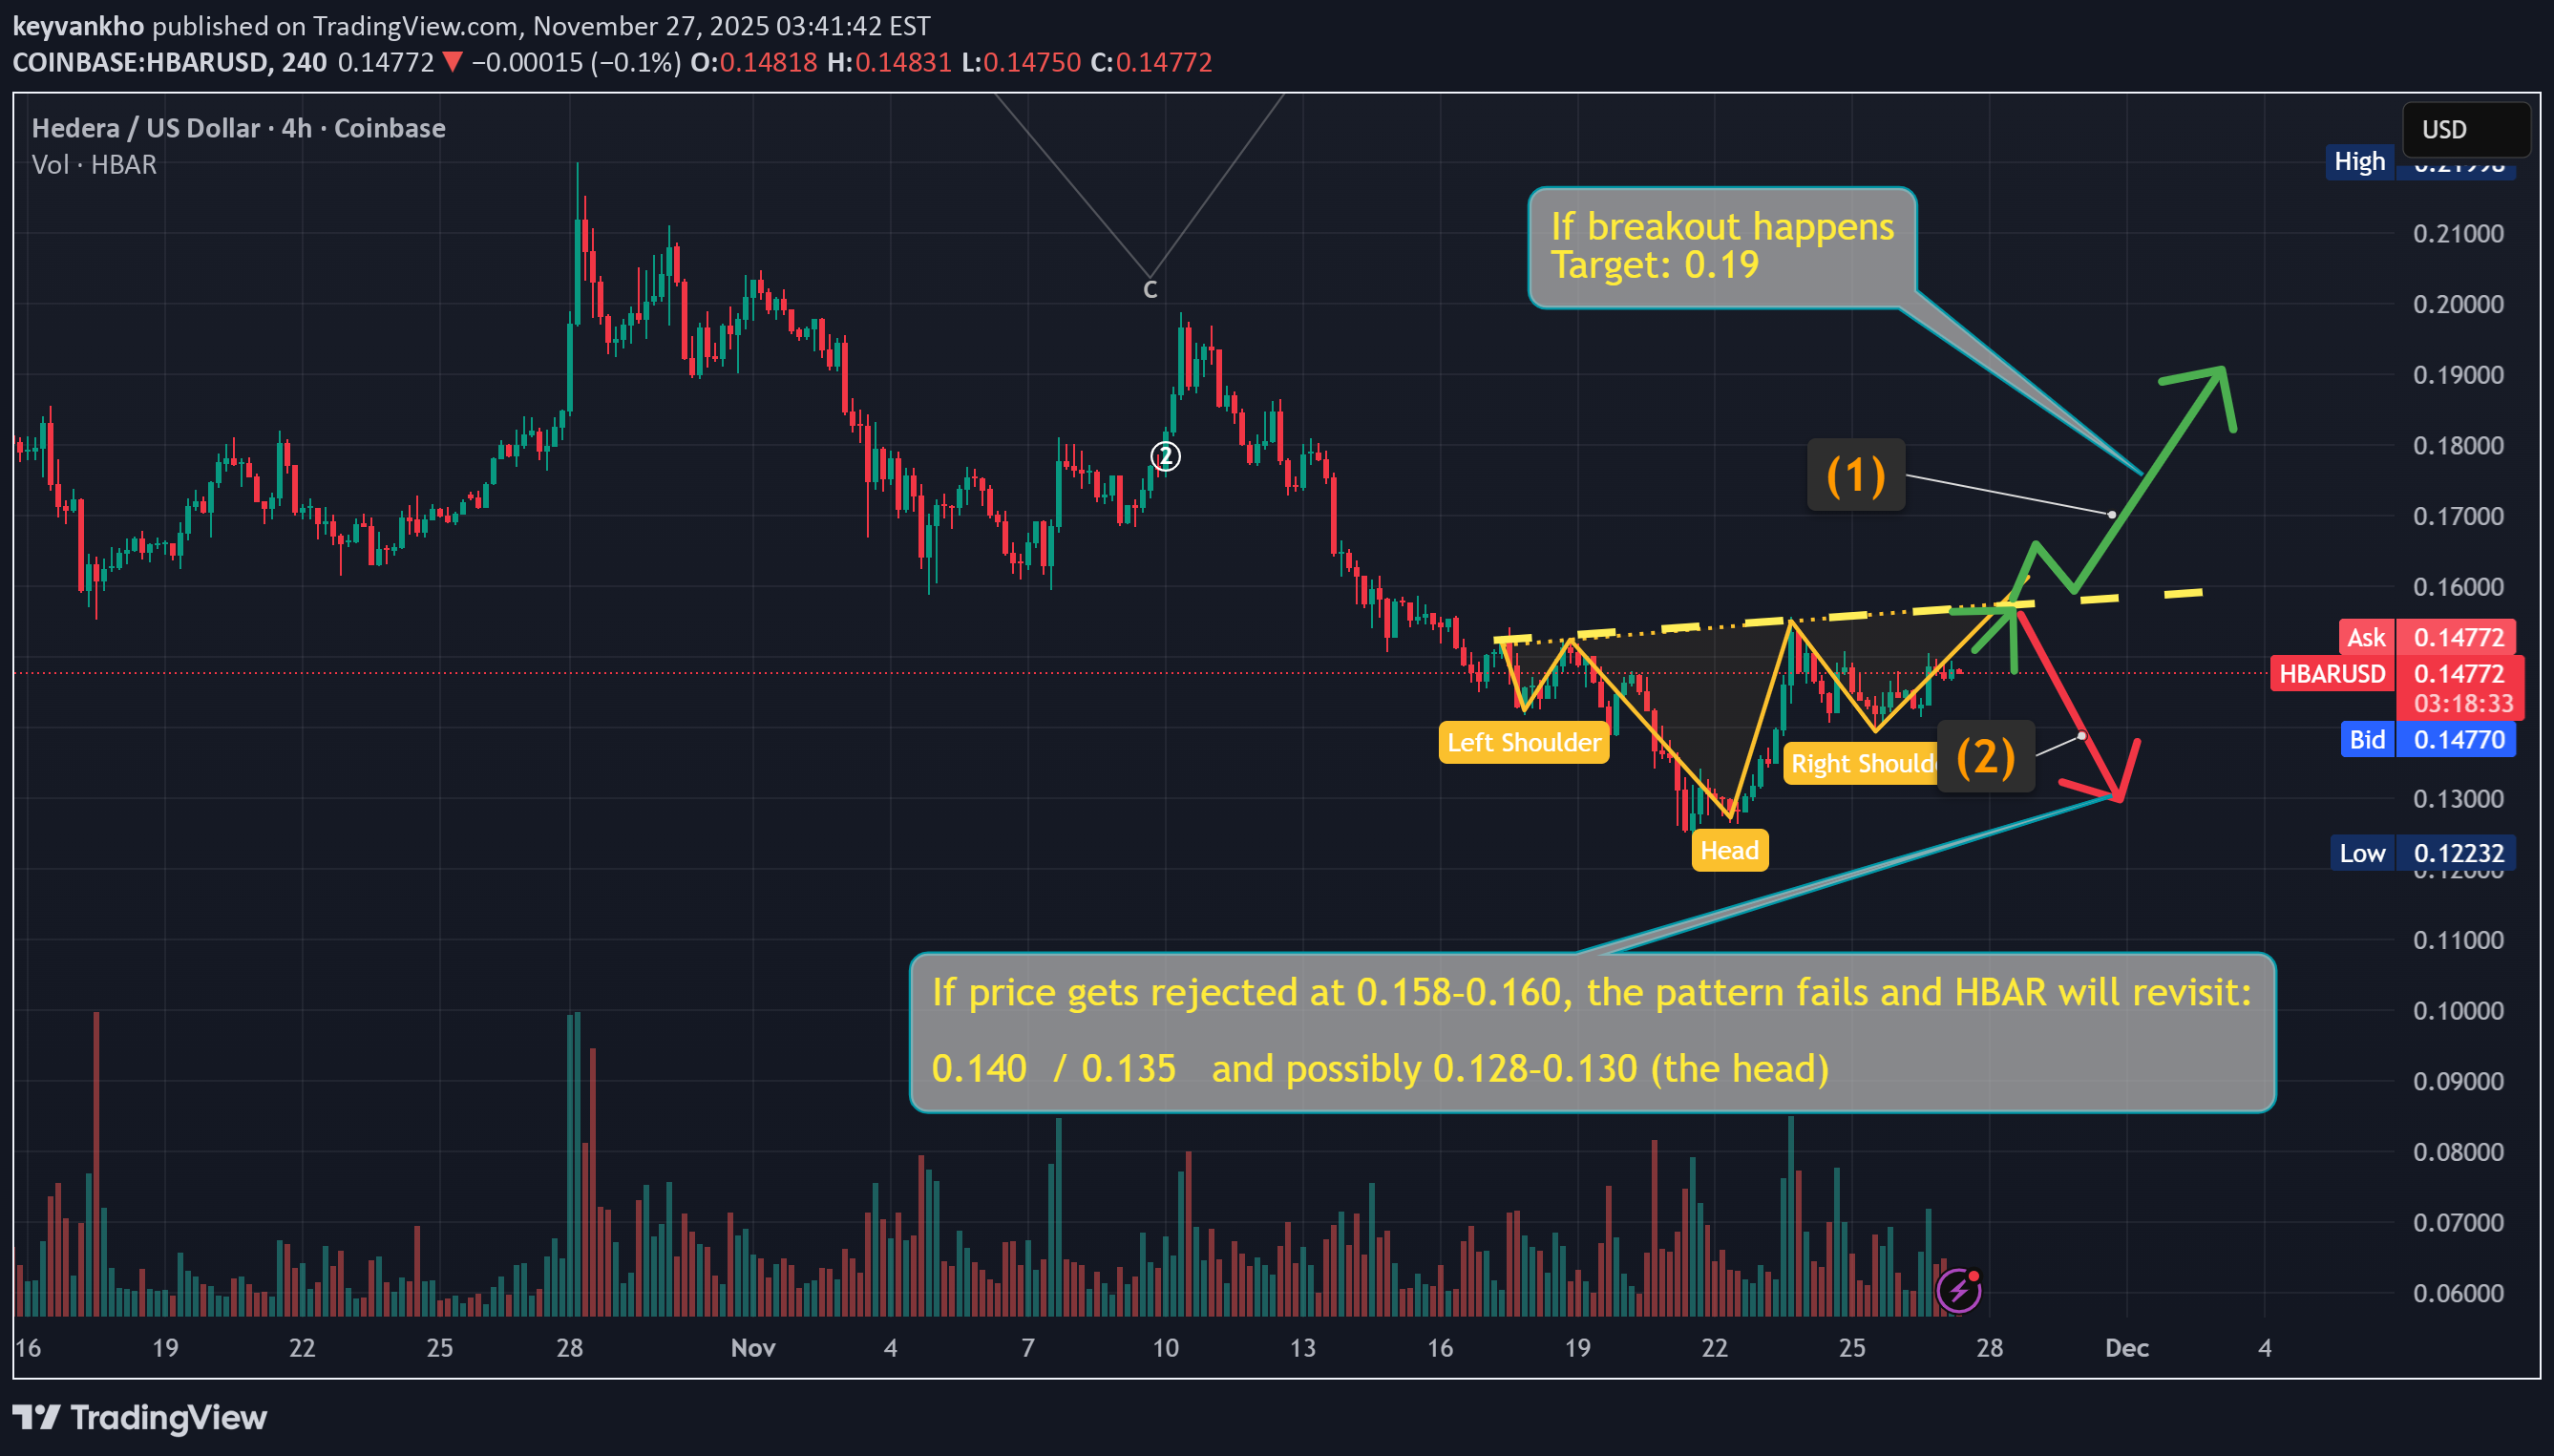
HBAR – Inverse Head & Shoulders Forming? Key Breakout Level Ahead (0.158–0.160) HBAR is potentially forming a bullish Inverse Head & Shoulders on the 4H timeframe, but the pattern is not confirmed yet. The neckline sits right at the 0.158–0.160 zone, which is the critical inflection point for the next major move. ✅ Bullish Scenario (1) If HBAR breaks above 0.158–0.160 with a strong 4H close and increased volume, the Inverse H&S becomes valid. Measured-move target → 0.19 Short-term resistance levels: 0.165 → 0.172 → 0.185 → 0.190 This would signal the first strong bullish structure shift in several weeks. ❗ Bearish Scenario (2) If price gets rejected at 0.158–0.160, the pattern fails and HBAR is likely to revisit lower support levels: 0.140 0.135 0.128–0.130 (the Head, and final support) A rejection here would signal continuation of the broader downtrend. 📌 Key Levels to Watch Neckline resistance: 0.158–0.160 (decision zone) Bullish invalidation: Breakout with strong candle & volume Bearish invalidation: Failure/rejection at neckline 📈 Summary HBAR is approaching a major decision point. A breakout could trigger a 25–30% rally, while rejection could continue the downtrend back into the 0.13 region. Watch the neckline carefully—this is where the next big move will be decided. 💬 Your Feedback Matters If you found this analysis useful, please let me know by leaving a comment and a like. Your support helps me create more high-quality analysis like this. 🙏 HBARUSD HBARUSDC HBARUSDT HBAR
keyvankho
بیت کوین: جهش پس از ریزش یا دام نهایی؟ سطوح حیاتی برای تماشا!
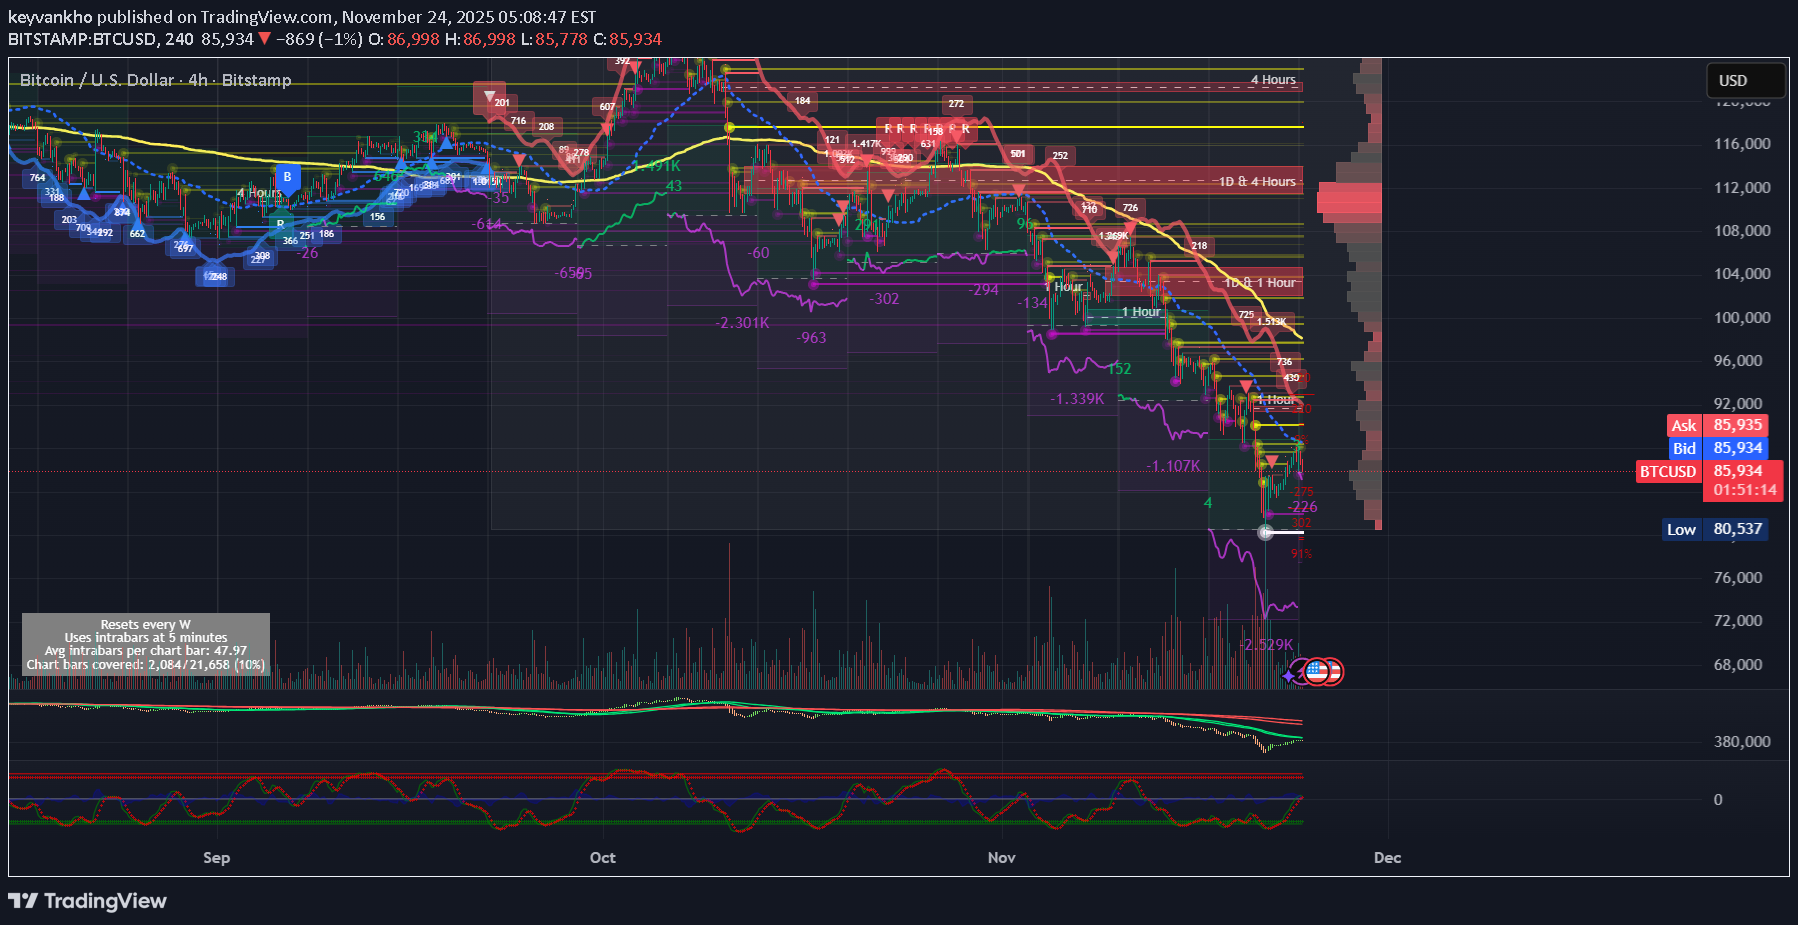
Bitcoin BTCUSD has completed a violent capitulation move into 80,537, clearing multiple liquidity shelves and wiping out late leverage. We are now seeing a corrective bounce inside a larger bearish structure, and the next move depends entirely on how BTC behaves between 88k resistance and 82k support. BTCUSDT BTCUSDC Bearish Scenario (Still the Base Case) As long as BTC trades below 88–90k, the bounce remains corrective and price is expected to rotate lower into 82–80k for a retest of the demand zone. A high-volume breakdown below 80k opens the door to the next liquidity pocket at 74k, where large bids and unfilled resting liquidity sit. Bullish Scenario (Needs Real Confirmation) If BTC forms a 4H higher low above 82k and then breaks 90k with: rising OBV, a bullish MACD cross, WaveTrend continuation, and a 4H close above the cloud, then the downside structure is invalidated and BTC can squeeze into the heavy resistance cluster at 92–95k. A clean reclaim of 95k flips the entire trend back to bullish and opens the path toward 100–103k. 📌 Key Levels Major Support: 82,000 – 80,000 Breakdown Target: 74,000 Local Resistance: 88,000 – 90,000 Macro Reclaim Level: 92,000 – 95,000 Bull Continuation Zone: 100,000 – 103,000 Summary BTC is in a post-capitulation recovery but not yet a confirmed reversal. The chart favors a range between 80k and 90k, with the next major move triggered by a break of either boundary. Momentum indicators (WaveTrend, MACD, OBV) show early stabilization, but trend structure and liquidity heatmaps still point to heavy supply overhead. Until 90k breaks, expect sideways-to-down, with 80k acting as the key battlefield. #Bitcoin #BTC #Crypto #Trading #TechnicalAnalysis #Liquidity #Stratify #WaveTrend #OBV #Capitulation If you find this analysis useful, please drop a like and share your thoughts in the comments — I always appreciate your feedback and perspectivesBTC Update – Price Has Hit the EXACT Decision Zone (91.5k–92.5k) Continuation or Dead-Cat? The next hours will decide. Bitcoin has now climbed into the exact resistance zone highlighted in my previous idea — the 91,500–92,500 band. This is the level I marked as the Decision Zone, and price is reacting exactly as expected. Right now, BTC is showing early signs of exhaustion, but also holding short-term bullish structure… which means we are sitting right at the turning point. Let me break it down clearly: 🔵 Scenario 1 – Bullish Breakout (Needs Confirmation) Bulls must break and close above 92,500 to flip this bounce into a real trend reversal. For a clean breakout, I’m watching for: A 1H or 4H candle close above 92.5k A breakout through the 4H Ichimoku Cloud CVD turning positive (currently flat/weak) OBV breaking the local down-trend RSI Games flipping from H-Bear → H-Bull Strong volume inflow No Shooting Star / upper-wick rejections If all of this aligns, then the next targets open up quickly: 94,500 → 97,000 → 100,000+ This is still possible — but it requires real strength. 🔴 Scenario 2 – Rejection (Currently More Likely) This bounce resembles a Wave-5 exhaustion inside a larger downtrend, and the indicators are showing weakness: Clear bearish CVD divergence RSI Games firing H-Bear signals QQE momentum flattening Volume not supporting the move VPVR showing heavy supply above 4H trend still bearish Multiple “R” algorithmic rejections at this exact level Price hitting the liquidity ceiling from the heatmap If rejection confirms here, the retrace levels remain exactly the same as in the original idea: 89,000 → 86,000 → 82,500 → 80,000 This is the classic post-capitulation bounce → distribution zone behaviour. 🟩 Big Picture BTC is now precisely at the zone I outlined in the original idea. This zone decides: Breakout → Trend Reversal Rejection → Dead-Cat Bounce and Lower Levels Nothing has invalidated the bearish scenario, but the bullish path is still open if buyers show strength above 92.5k. The next 24 hours are crucial. 💬 Your Feedback Helps More Than You Think If this update helped you, please let me know what you think with your likes and comments. Your support motivates me to keep posting detailed BTC insights every day.
keyvankho
تحلیل جامع قیمت سولانا (SOL): اهداف کوتاهمدت تا بلندمدت و نقاط ورود طلایی
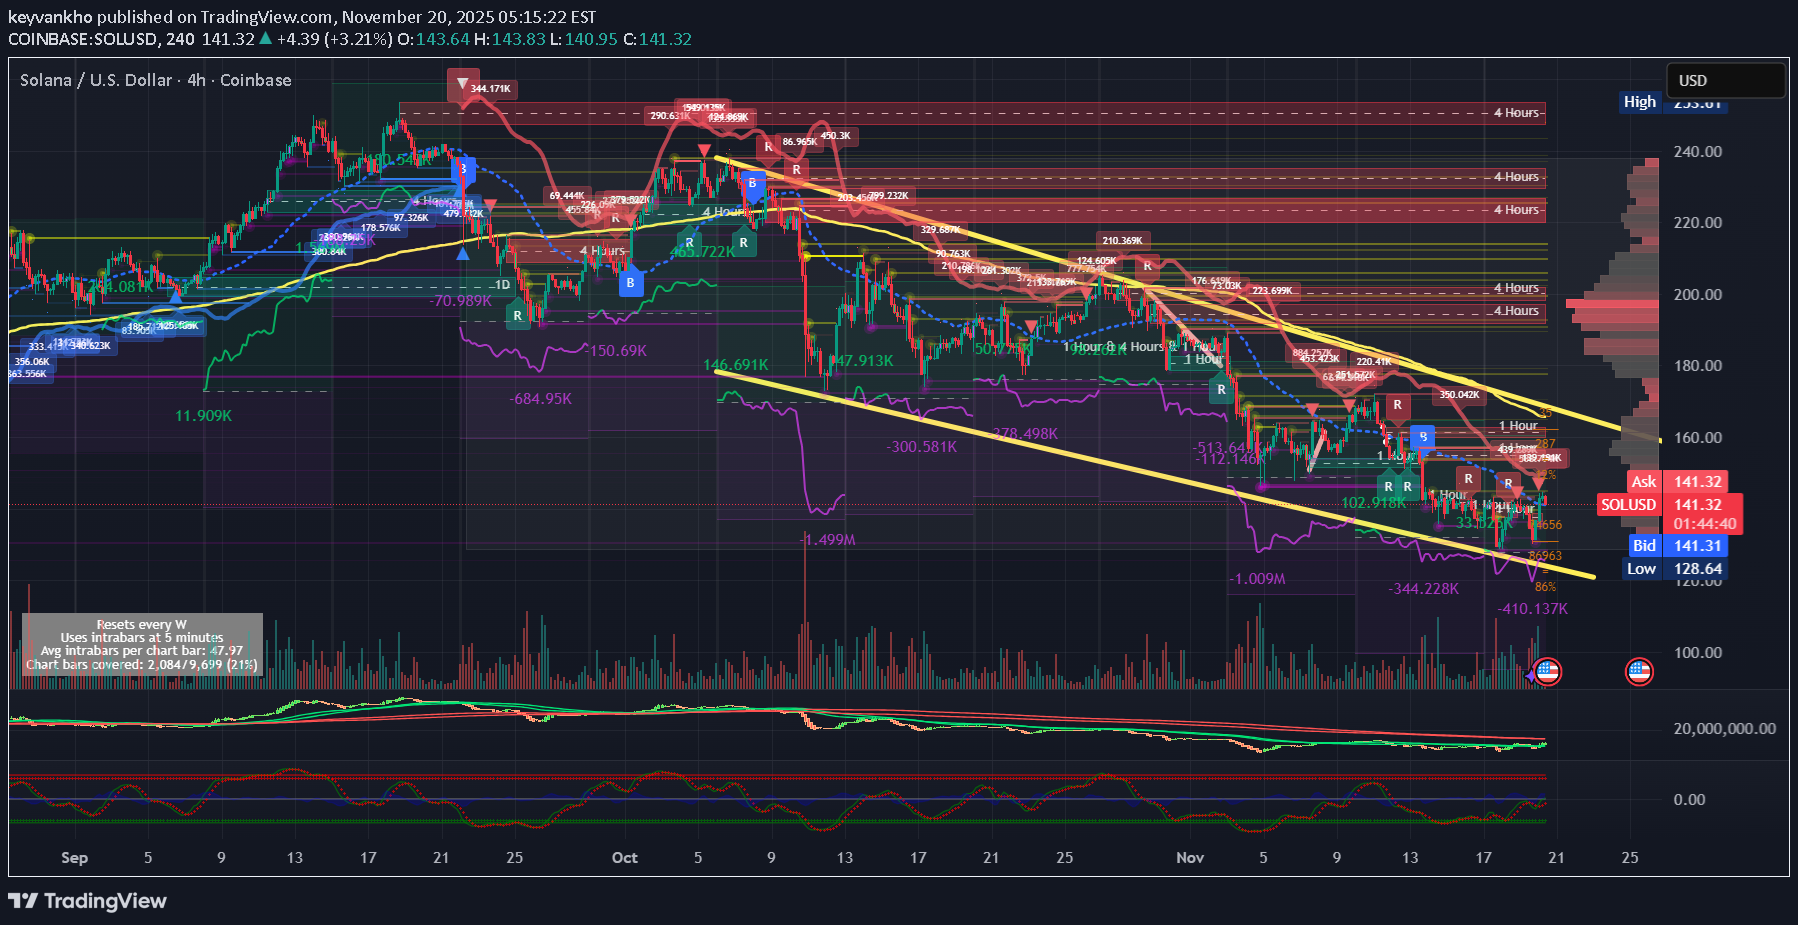
SOLUSD SOLUSDT SOLUSDC 1) SHORT-TERM PRICE MOVEMENT (Next 6–18 hours) SOL is currently consolidating after the breakout from the $136–$138 zone. The short-term structure across 15m/1h shows a healthy cooldown phase, not a reversal. Momentum is still positive, OBV is rising, and delta shows seller absorption around $142–$143. Price is expected to dip into the micro demand zone at $140.2–$141.5, fill remaining liquidity pockets, and then attempt a re-push into the $144.5–$145 range. As long as $139.8–$140.5 holds, the short-term bias is bullish continuation. Short-term expectation: Range → small dip → continuation upward Immediate upside tag: $144.5 → $145.7 2) MID-TERM PRICE MOVEMENT (1–3 days) The current market structure on 1H/4H shows a transition from CHoCH to early SMS. When SOL forms this pattern after a deep liquidity sweep, the next wave usually targets the nearest FVG and inefficiency levels. The next magnets are: $147.5 (first liquidity pool) $150.2–$151.3 (major inefficiency fill) $153.0 (HTF fib cluster + supply touch) Mid-term bias remains bullish unless the $135 OB is broken. Mid-term expectation: $147.5 → $150 → $153 zone in sequence 3) HIGH-TIMEFRAME PRICE MOVEMENT (4–10 days) The daily falling wedge bottom has been tapped. This wedge historically produces a multi-day bullish expansion once mid-structure flips. The next HTF level — and the one that decides the trend — sits at $156–$160, which matches the top wedge boundary, VPVR high-volume node, and macro resistance. If SOL clears this region with strong candle bodies, a full HTF trend reversal will occur, opening the way to: $165–$168 (HTF extension) $178 (1.618 HTF fib) If it rejects the $156–$160 range, it will retrace back to $147–$150 before the next attempt. HTF expectation: Primary target: $156–$160 Break → $165–$168 Full breakout → $178 LIQUIDATION & LEVERAGE MAP (Kingfisher-style projection) Below Price Light clusters at $141.2 Medium shelves at $139.6 Large cluster at $136.8–$137.4 Deep liquidity at $134.5–$135.3 If any bearish wick forms, price will likely stop at the first or second cluster ($140–$139.6). The heavy $135 zone is the “max pain” level and unlikely to be revisited unless Bitcoin breaks structure. Above Price Significant liquidation pool at $145.8–$147.5 Heavy cluster at $150.5 Massive build-up at $153.2–$154.4 Final HTF liquidation pocket at $156.5–$158 These will act as magnets during any bullish breakout. WHALE MAP (CVD & VPVR Projection) Whale behavior (from your delta charts + VPVR): Whales accumulated at $136–$138 (clear delta spikes) Absorption at $141–$143 (sellers trapped) Minimal whale sell walls until $150–$153 Heavy whale resting liquidity at $156 (profit-taking zone) Whale map direction: Upward toward $147 → $153 → $156 TRADE PLAN Direction: LONG Entry Zones Primary pullback entry: $140.2–$141.5 🔥🔥🔥Deep entry (if swept): $138.8–$139.6 🔥🔥🔥Breakout entry: Above $144.6 with retest 🔥🔥🔥Stop Loss 🔥🔥🔥Below $134.90 (Below OB, below liquidity shelves, below structure) Take Profit 🔥🔥TP1: $147.5 🔥🔥TP2: $150.6 🔥🔥TP3: $153.2 🔥🔥TP4 / Cycle: $156–$160 Risk–Reward 3.1R – 6.2R depending on entry Management 🔥🔥🔥🔥If price stalls at $147.5 → partial exit 🔥🔥🔥🔥If $150 rejects → expect pullback to $147 🔥🔥🔥🔥🔥If $156 is broken with volume → SOL begins macro reversal INVALIDATION 🚨🚨🚨🚨🚨🚨🚨The price-movement expectation becomes invalid if: SOL closes 1H below $134.90 OBV breaks demand-side trend RSI prints H-Bear divergence on 1H & 4H simultaneously BTC loses its mid-range and drops below $59k SOL loses the daily wedge lower boundary (< $128) SOLUSD SOLUSD SOLUSD Let me know what you think in the comments — your feedback helps me improve these analyses, and if you found this useful, a like or share would mean a lot.
keyvankho
پیشبینی دقیق حرکت قیمت سولانا (SOL): اهداف صعودی کوتاهمدت تا بلندمدت
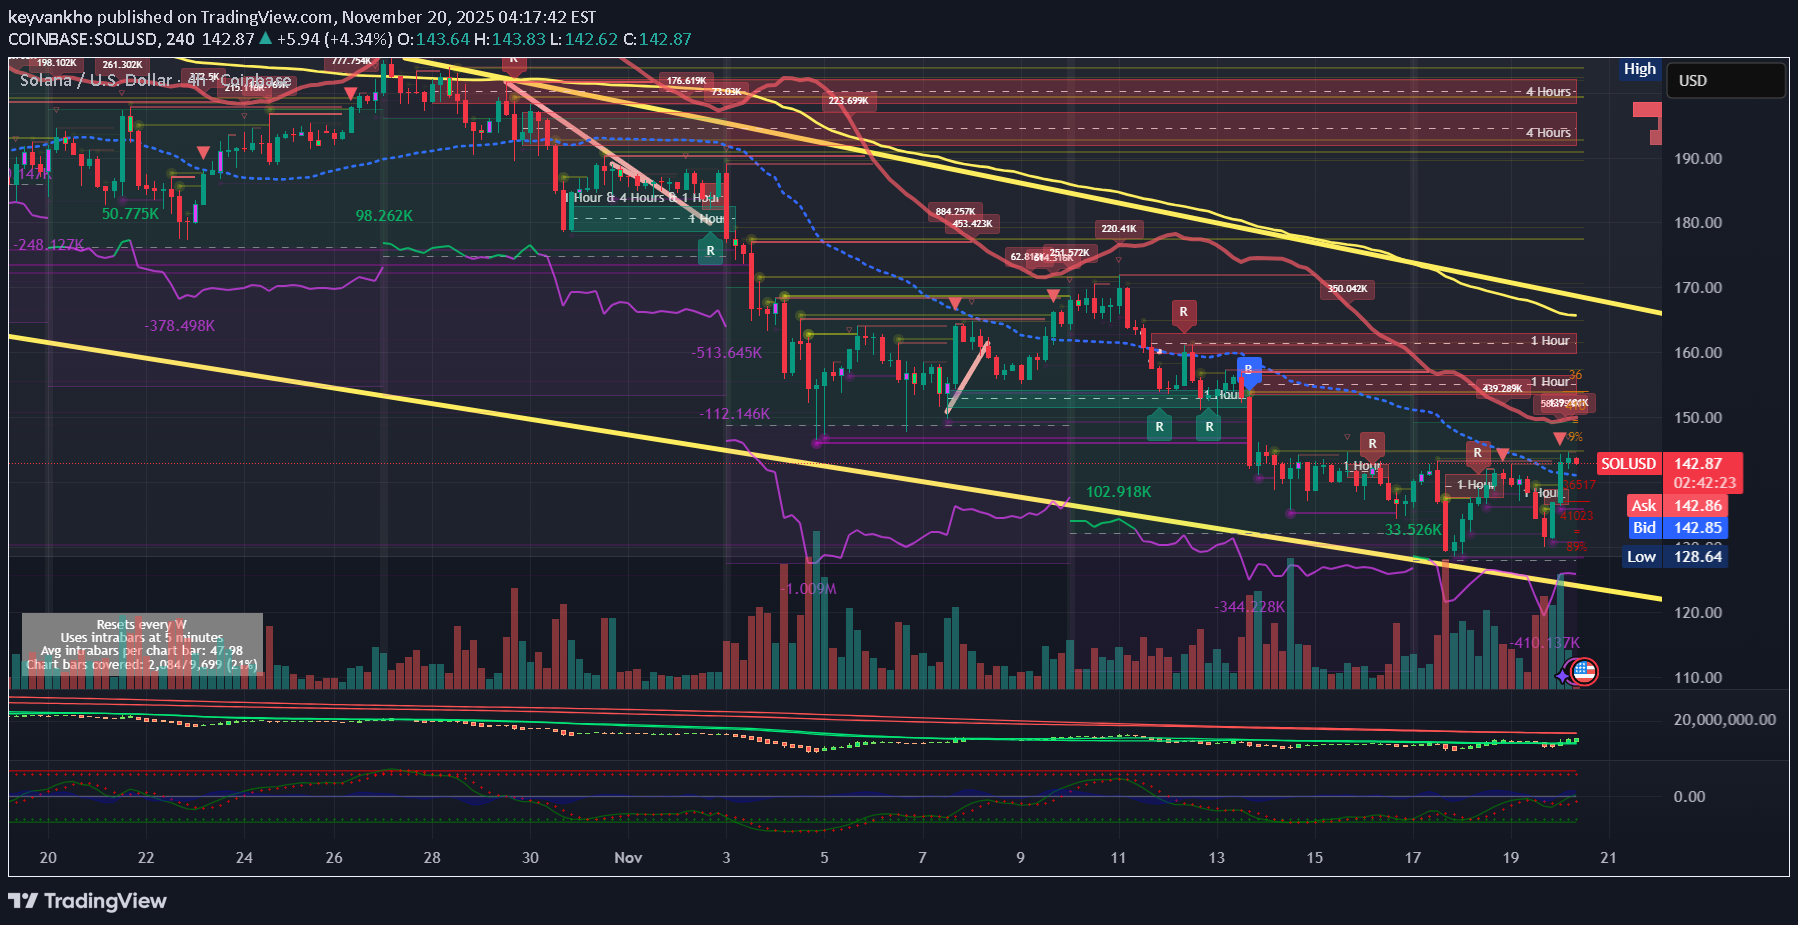
1) SHORT-TERM PRICE MOVEMENT (Next 6–18 hours) SOL is currently consolidating after the breakout from the $136–$138 zone. The short-term structure across 15m/1h shows a healthy cooldown phase, not a reversal. Momentum is still positive, OBV is rising, and delta shows seller absorption around $142–$143. Price is expected to dip into the micro demand zone at $140.2–$141.5, fill remaining liquidity pockets, and then attempt a re-push into the $144.5–$145 range. As long as $139.8–$140.5 holds, the short-term bias is bullish continuation. Short-term expectation: Range → small dip → continuation upward Immediate upside tag: $144.5 → $145.7 2) MID-TERM PRICE MOVEMENT (1–3 days) The current market structure on 1H/4H shows a transition from CHoCH to early SMS. When SOL forms this pattern after a deep liquidity sweep, the next wave usually targets the nearest FVG and inefficiency levels. The next magnets are: $147.5 (first liquidity pool) $150.2–$151.3 (major inefficiency fill) $153.0 (HTF fib cluster + supply touch) Mid-term bias remains bullish unless the $135 OB is broken. Mid-term expectation: $147.5 → $150 → $153 zone in sequence 3) HIGH-TIMEFRAME PRICE MOVEMENT (4–10 days) The daily falling wedge bottom has been tapped. This wedge historically produces a multi-day bullish expansion once mid-structure flips. The next HTF level — and the one that decides the trend — sits at $156–$160, which matches the top wedge boundary, VPVR high-volume node, and macro resistance. If SOL clears this region with strong candle bodies, a full HTF trend reversal will occur, opening the way to: $165–$168 (HTF extension) $178 (1.618 HTF fib) If it rejects the $156–$160 range, it will retrace back to $147–$150 before the next attempt. HTF expectation: Primary target: $156–$160 Break → $165–$168 Full breakout → $178 LIQUIDATION & LEVERAGE MAP (Kingfisher-style projection) Below Price Light clusters at $141.2 Medium shelves at $139.6 Large cluster at $136.8–$137.4 Deep liquidity at $134.5–$135.3 If any bearish wick forms, price will likely stop at the first or second cluster ($140–$139.6). The heavy $135 zone is the “max pain” level and unlikely to be revisited unless Bitcoin breaks structure. Above Price Significant liquidation pool at $145.8–$147.5 Heavy cluster at $150.5 Massive build-up at $153.2–$154.4 Final HTF liquidation pocket at $156.5–$158 These will act as magnets during any bullish breakout. WHALE MAP (CVD & VPVR Projection) Whale behavior (from your delta charts + VPVR): Whales accumulated at $136–$138 (clear delta spikes) Absorption at $141–$143 (sellers trapped) Minimal whale sell walls until $150–$153 Heavy whale resting liquidity at $156 (profit-taking zone) Whale map direction: Upward toward $147 → $153 → $156 TRADE PLAN (Price-Movement Version) Direction: LONG Entry Zones Primary pullback entry: $140.2–$141.5 🔥🔥🔥Deep entry (if swept): $138.8–$139.6 🔥🔥🔥Breakout entry: Above $144.6 with retest 🔥🔥🔥Stop Loss 🔥🔥🔥Below $134.90 (Below OB, below liquidity shelves, below structure) Take Profit 🔥🔥TP1: $147.5 🔥🔥TP2: $150.6 🔥🔥TP3: $153.2 🔥🔥TP4 / Cycle: $156–$160 Risk–Reward 3.1R – 6.2R depending on entry Management 🔥🔥🔥🔥If price stalls at $147.5 → partial exit 🔥🔥🔥🔥If $150 rejects → expect pullback to $147 🔥🔥🔥🔥🔥If $156 is broken with volume → SOL begins macro reversal INVALIDATION 🚨🚨🚨🚨🚨🚨🚨The price-movement expectation becomes invalid if: SOL closes 1H below $134.90 OBV breaks demand-side trend RSI prints H-Bear divergence on 1H & 4H simultaneously BTC loses its mid-range and drops below $59k SOL loses the daily wedge lower boundary (< $128) Let me know what you think in the comments — your feedback helps me improve these analyses, and if you found this useful, a like or share would mean a lot.
keyvankho
تحلیل کامل سولانا (SOL): نقشه نهنگها، لیکویید شدنها و استراتژی خرید در قیمتهای کلیدی!
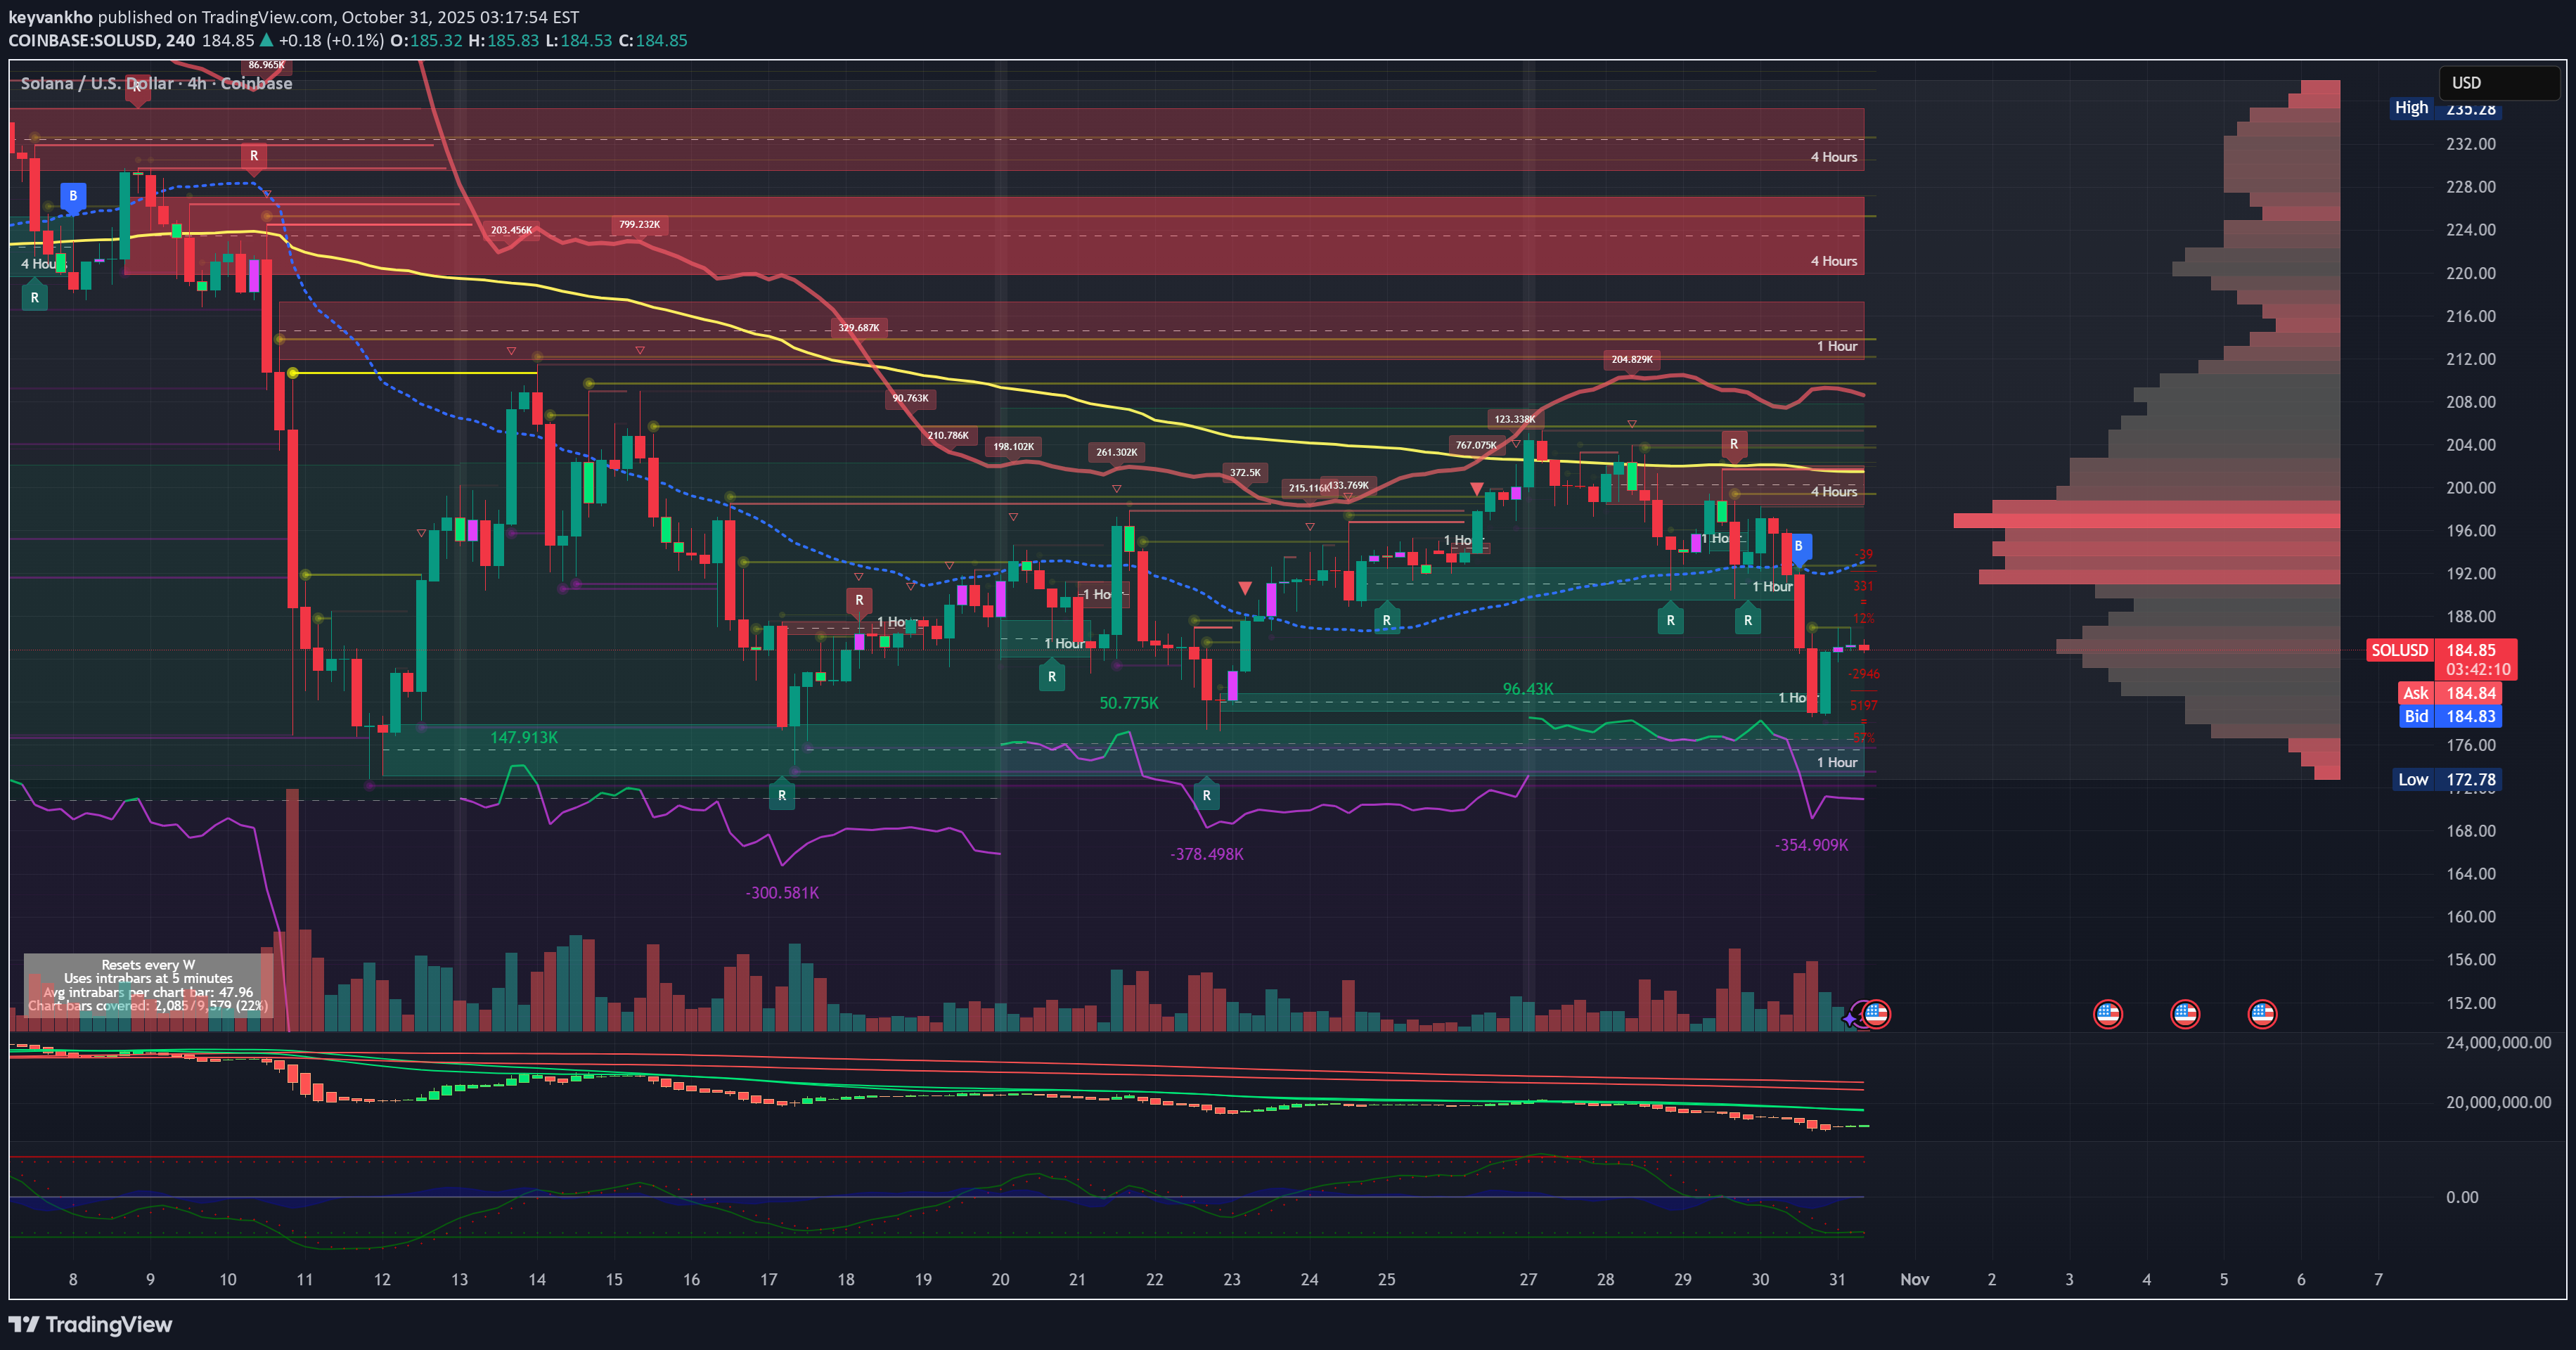
Trade Plan: Buy dips into $185 → $181 → $178 with a protective tail at $168, target $194 → $203 → $212+, and invalidate if $168 HTF breaks. Price Movement + Liquidation + Whale Map Solana has successfully rebounded from the key demand pocket at $178–$181, where aggressive buyers defended the prior 4H swing low and swept liquidity below the rising trendline. This bounce confirms continued smart-money defense of structure, following a multi-day corrective pullback after distributing into the $203–$208 supply band. Price is now stabilizing above the micro accumulation shelf at $183–$186, with intraday candles showing higher-lows and early bullish momentum returning, supported by volume absorption on each dip into the mid-$180s. As long as SOL holds the $181 reclaim, this remains a continuation accumulation phase, not a trend breakdown. The next short-term move favors a grind-up retracement toward trapped shorts around $191–$194, followed by a sweep of the liquidity band at $197–$200 — the first key liquidation magnet above. A clean break and hold above $200 opens the door to speed-move expansion into $207–$212, where heavy resting sell walls and prior profit-taking nodes reside. Above this, breakout momentum could accelerate into $223–$231 on momentum ignition, but that remains a secondary stage target and depends on reclaim strength above the $210 shelf. On the downside, major liquidation pools remain stacked beneath $182, then $178, and a deeper wash at $172–$168 (high-value tail liquidity + psychological flush zone). If price wicks into those levels, it would likely be a liquidity hunt rather than structural failure, provided bulls recapture the zone quickly. Whales have been accumulating consistently in the $168–$181 band for weeks, with on-chain order-flow showing absorption during each correction phase, confirming institutional accumulation rather than distribution. Sell walls reappear in layers above $203, $208, and $215, suggesting short-term volatility expected upon breakout but not necessarily cycle-top behavior — more likely controlled profit-taking. Execution Plan: Bias remains buying retracements, not chasing. Primary dip accumulation zone remains $183–$185, ideal add layer at $181–$178 on wick flush, and tail-hedge allocation stands at $172–$168. Risk defined below $168. First take-profit ladder rests at $194 → $200 → $212, with secondary hold targets into $223+ if strength persists. Maintain core long ride if momentum and on-chain flows stay supportive. Invalidation: The setup remains fully valid as long as SOL does not close a 4H candle below $178 and does not lose $168 on HTF closing basis. A persistent breakdown below $168 would shift structure into a larger ABC corrective phase, delaying continuation rather than ending the macro bull drive. Until then, liquidity behavior, trend structure, whale positioning, and momentum context remain biased to the upside with accumulation-driven volatility.
keyvankho
تحلیل جامع بیت کوین: نقشه راه نهنگها، لیکوئید شدنها و برنامه معاملاتی صعودی
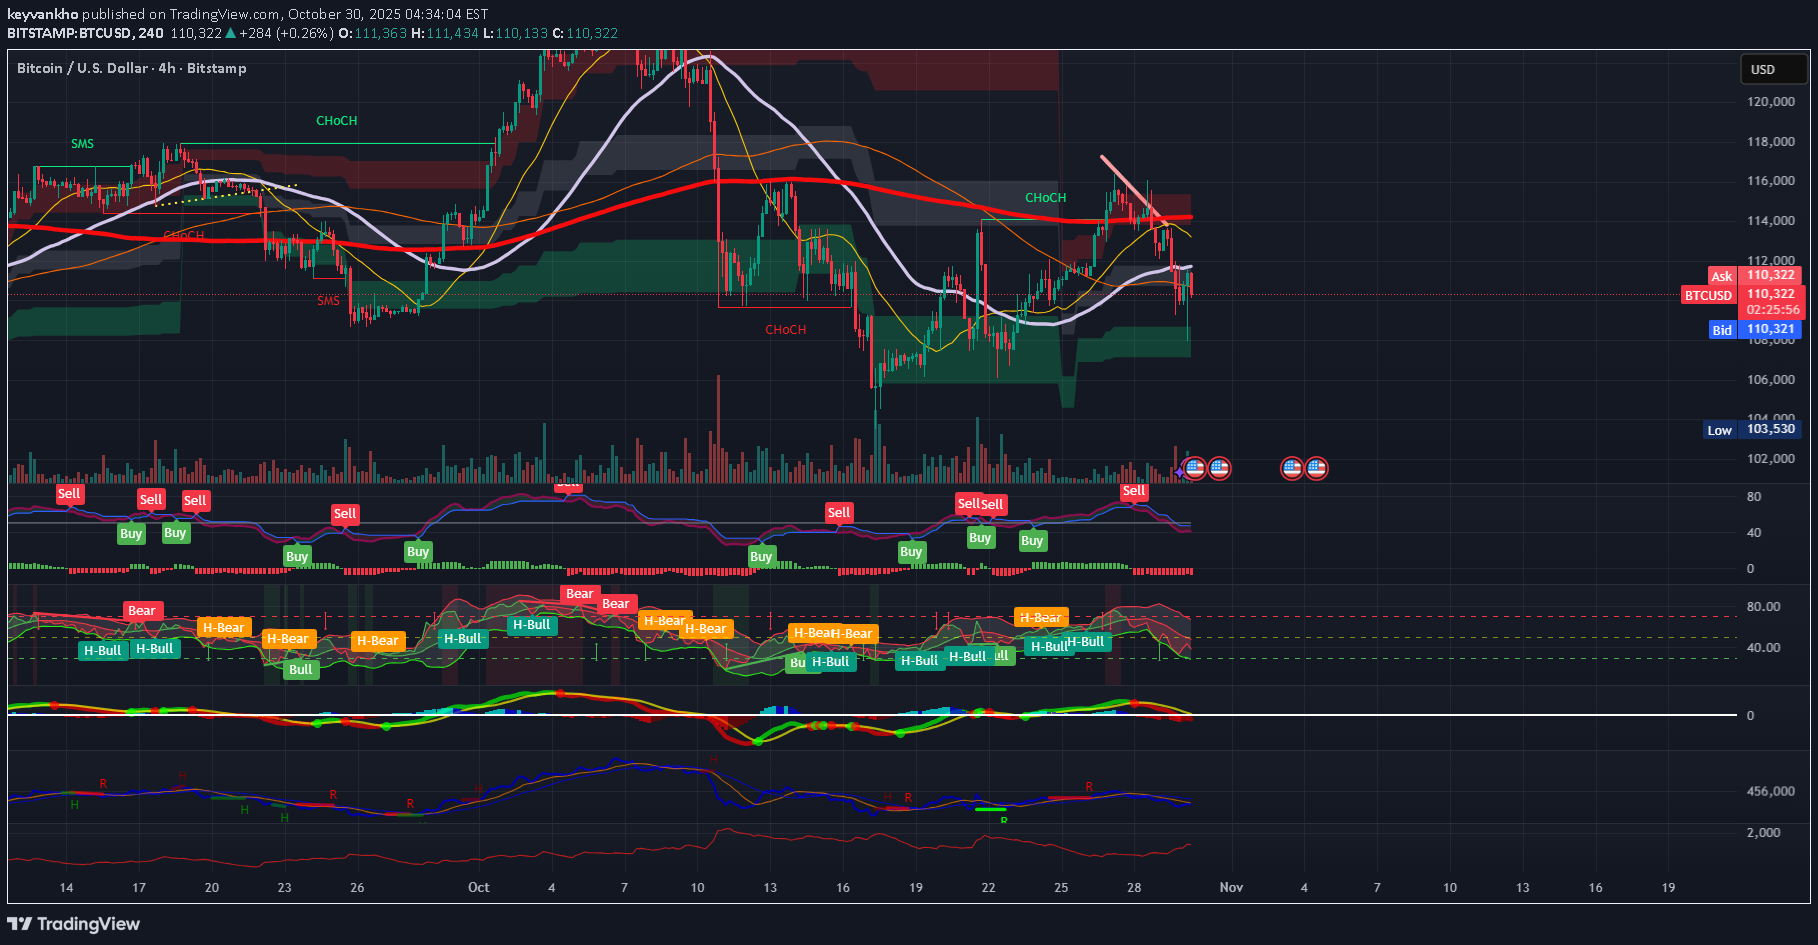
BTC Price Movement Expectation Short-Term (24–48h) BTC is in a controlled post-liquidity-sweep phase after the flush into the 108K region. The reclaim attempt stalled under 112K resistance, showing that smart money is engineering sideways chop to trap both longs and shorts. Expect shallow retraces and engineered whipsaws as price builds fuel. If price reclaims 111.8K–112.2K with volume, a fast rotation toward 113.5K–115K is likely. Without that reclaim, expect a sweep down toward 109K and possibly 108K support again to shake out late longs before expansion. Short-term bias: Neutral-to-bullish accumulation Targets: 111.8K → 113.5K → 115K Risk: another fast liquidity flush toward 108K before push Medium-Term (1–3 weeks) BTC remains in a controlled re-accumulation zone after the corrective leg. Structure suggests we are building the base for the next expansion leg, but smart money wants maximum liquidation efficiency before allowing trend continuation. As long as price holds above the 105–108K base, expect compression → breakout behavior. The most efficient path remains sideways-up with volatility and unpredictable spikes to exhaust both sides. Medium-term bias: Bullish continuation after base Targets: 117K → 121K → 126K Long-Term (4–12 weeks) Macro remains intact for the next major impulse leg once corrective absorption completes. A push into new ATH zone above 130K remains on track after shakeout, unless a systemic macro event breaks structure. Institutional demand bottom sits lower at 103–105K; if tapped, it accelerates the next parabolic move. Long-term bias: Strong bullish continuation after final liquidity events Targets: 135K → 145K+ Smart money still in accumulation control Liquidation Map & Flow Large short liquidations stack above 112K–113.5K → draw target Liquidity gap above 115K that will trigger a fast wick when reclaimed Long liquidation pool sits below 108K, deeper at 105K MM footprint suggests hunt both sides then expansion Liquidation expectation: Sweep weak lows → build higher base → take shorts above 112–113.5K Whale Map Behavior Whales added below 109K and layered bids toward 105K Aggressive absorption at the wick lows confirms value perception Sell walls at 113–116K designed to slow price, not reject trend Signature resembles accumulation disguised as weakness Whales pushing weak-hand shakeouts before expansion. Trade Plan Primary Setup ( safer reclaim entry ) Entry: Break + hold 112.2K SL: 109.7K TP1: 113.5K TP2: 115.2K TP3: 117.8K+ Aggressive Accumulation Zone Entry zone: 108.5K–107.2K SL: 105.8K TP: 112K → 115K Best play: Fade fear flushes into support, not chase candles. Invalidation The plan invalidates if BTC: Loses 105K on high-volume breakdown OBV + Delta flip into distribution without reclaim attempts 4H volatility expands down inside cloud with no rebound Break below 105K = deeper corrective leg → 98–100K zone before continuation.
keyvankho
تحلیل HBAR: حرکت انفجاری، لیکوئید شدنها و نقشه نهنگها برای صعود تا ۰.۴۳ دلار!
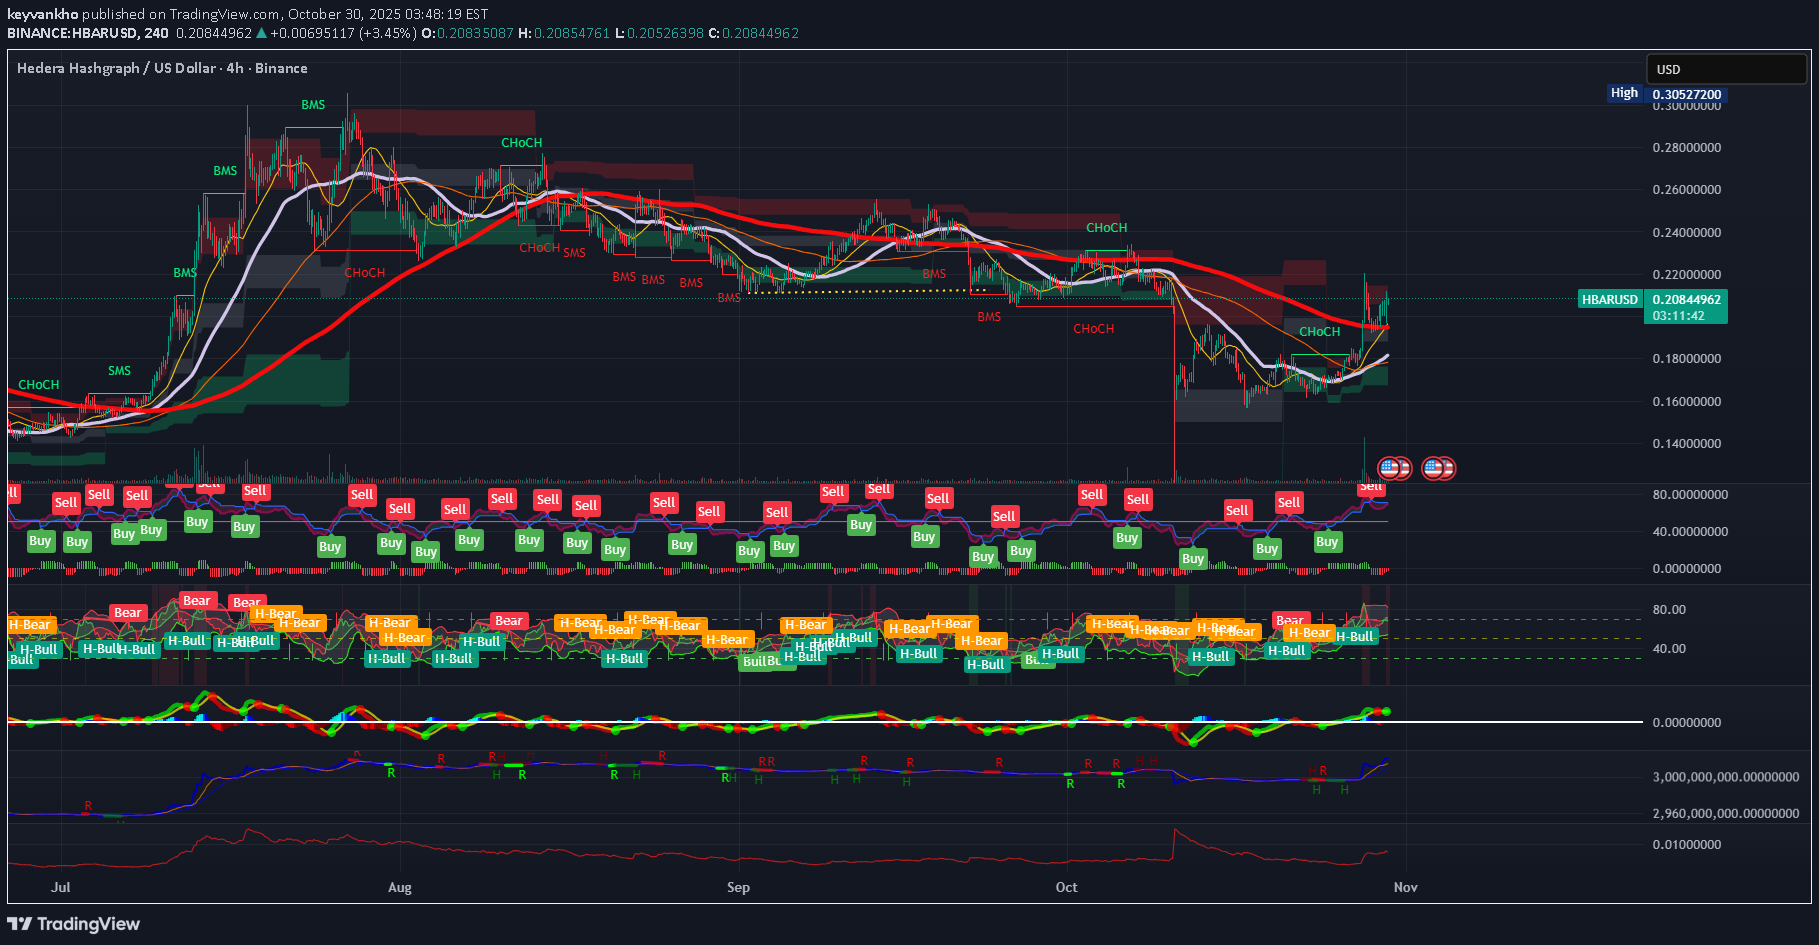
HBAR has completed a clean impulsive breakout structure from the $0.18 base and is now consolidating above the key support band at $0.203–$0.207, which is acting as the first institutional accumulation layer following the smart-money CHoCH and BOS sequence on the 4H. Price continues to print higher-lows on intraday frames, and volume data shows clear spot bid absorption on every dip into VWAP and the 0.382–0.5 retracement pockets. The next immediate move is expected to be a grind-up continuation toward the short-term liquidity cluster at $0.214, where a sweep of short positions and stop-loss liquidations could trigger a fast expansion to $0.223–$0.228, followed by a bullish extension zone targeting $0.235–$0.255 in the medium term. On the downside, liquidation pressure remains stacked below $0.203 and especially at $0.198 and $0.187, meaning if the market wicks aggressively lower, it is likely a liquidity hunt rather than a structural reversal — as long as price reclaims the zone quickly. Whale footprint is firmly bullish: accumulation has been consistent inside $0.182–$0.20 and demand has followed price upward, while distribution levels show passive profit-taking expected near $0.217–$0.223 and heavier sell walls layered into the $0.245–$0.26 range, meaning any breakout into these levels can trigger short-term volatility but should not be interpreted as a cycle top. Accordingly, the optimal execution plan remains buying dips into $0.203–$0.207 with risk defined below $0.198, targeting $0.214 → $0.223 → $0.245+ and scaling profits progressively while keeping a core long position for a potential cycle expansion toward $0.43 and beyond. This setup remains valid as long as HBAR does not close a daily candle below $0.198, and a panic invalidation trigger only activates on a structural failure beneath $0.182, which would temporarily shift structure into a corrective ABC pullback rather than a trend continuation. Until then, market structure, liquidity behavior, momentum indicators, and institutional flow remain aligned to the upside.HBAR Updated Institutional Price Narrative HBAR completed a textbook liquidity-driven correction after the impulsive breakout from the $0.18 zone, dipping below the previously defended $0.203–$0.207 support to sweep liquidity into the deeper demand pocket at $0.192–$0.187, exactly where large delta absorption and spot accumulation re-engaged. This move confirms that the earlier base was not a failure but a controlled liquidity harvest engineered to flush late longs and force inefficient liquidations before the next leg higher. The reaction from the $0.19 handle has been technically clean: order-flow charts show clear bullish CVD divergence, footprint data reveals aggressive passive absorption on red prints, and OBV stabilized instead of breaking trend — classic signs that smart money bought into forced selling. Momentum reset on lower timeframes without breaking HTF structure, which is exactly what healthy mid-trend pullbacks look like during expansion phases. More importantly, structural integrity was never violated: the higher-low sequence remains valid, the 4H cloud held, and price continues to trade inside the corrective box of Wave (4), preparing for a fresh Wave (5) extension leg. This pullback also aligns perfectly with Fibonacci symmetry, tagging the 0.5–0.618 retracement zone of the prior leg, which institutions frequently program bids into during trend continuation phases. Liquidity behavior confirms the next targets: short liquidations remain stacked at $0.204 → $0.214 → $0.223, meaning every micro reclaim is likely to accelerate price via stop-cascade mechanics. Above $0.223, a low-liquidity pocket runs into $0.235–$0.255, where the real breakout battle will happen. Whale maps still show no meaningful distribution at current levels — accumulation clusters remain concentrated between $0.182–$0.20, with supply signals only beginning above $0.245 and more aggressively near $0.26–$0.28**, indicating this pullback was engineered liquidity intake, not a top. From an execution standpoint, the correct play remains buying controlled dips into demand, not chasing green candles. Traders who bought the sweep into $0.19 executed optimally, but opportunity still exists as long as price remains above $0.188–$0.19 and especially above $0.183, the structural line defending the macro bullish bias. Any fast wick below $0.19 again would likely be another liquidity hunt rather than a reversal, provided the reclaim is immediate and accompanied by renewed CVD strength. As long as price holds above $0.183, this remains a continuation cycle.
keyvankho
سولانا (SOL) قبل از اوجگیری بزرگ بعدی: فرصت خرید در محدوده ۱۸۵ تا ۱۹۶ دلار!
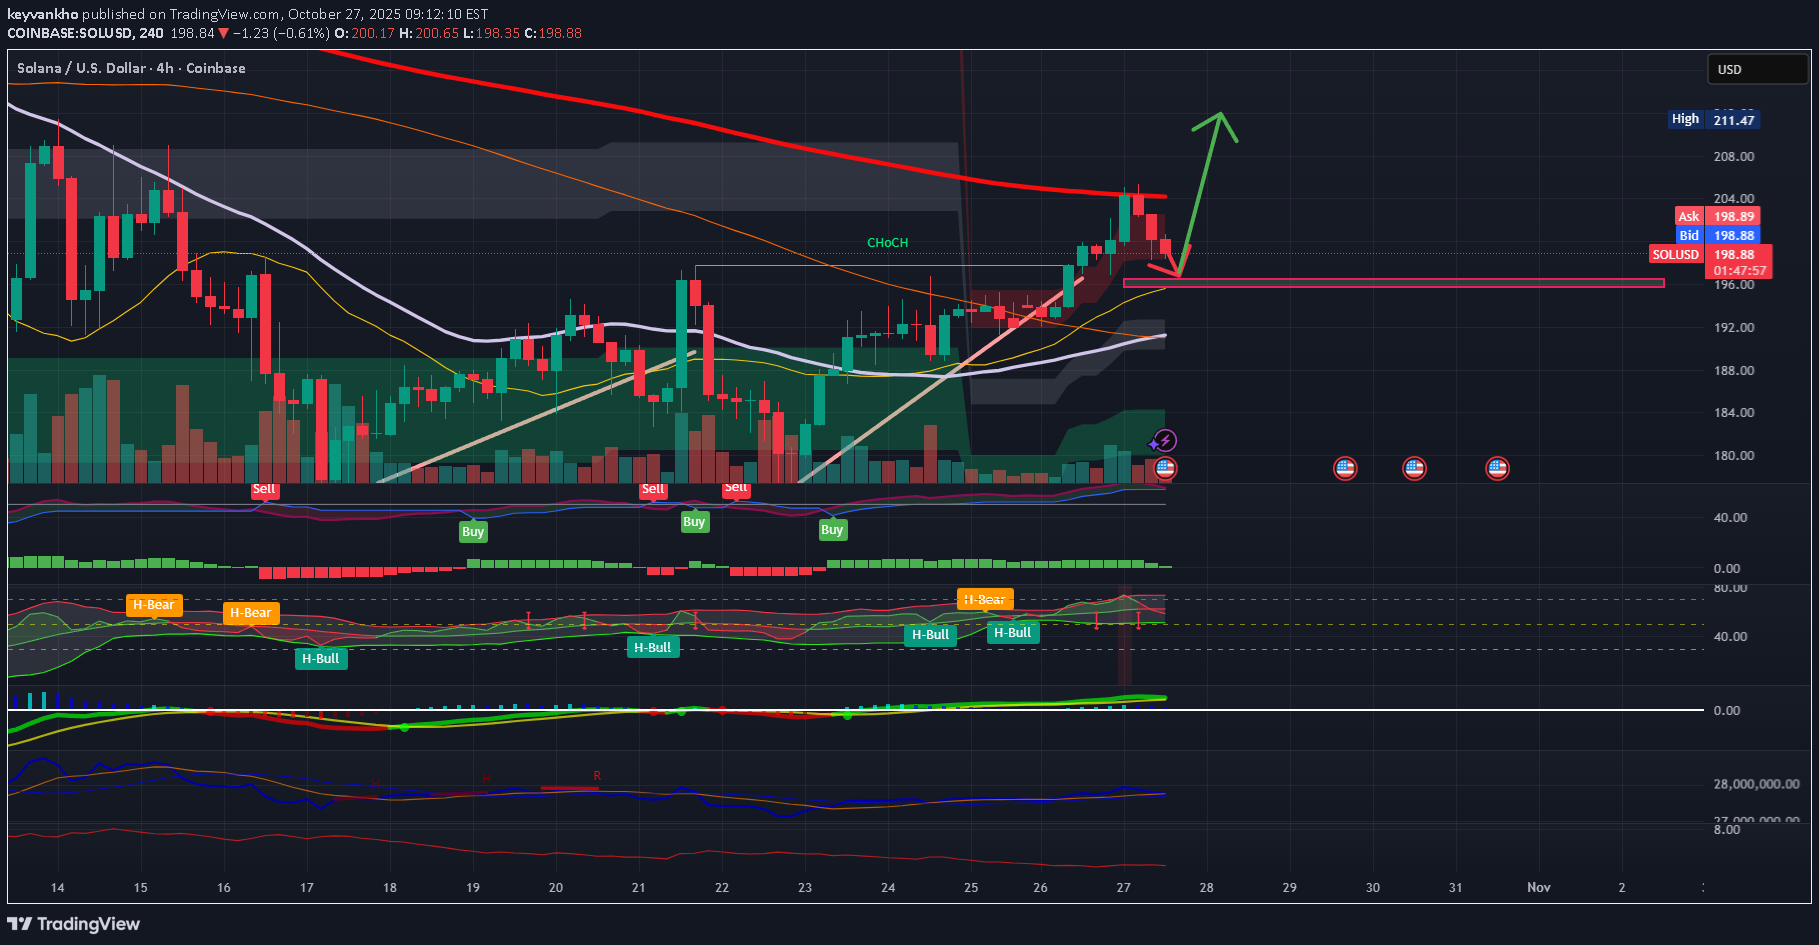
Solana is currently consolidating near $200–$205 after a strong impulsive move from the $177 base. On the 1H–4H timeframes, price action suggests that Wave (3) has completed, and the market is preparing for a short-term Wave (4) correction toward $195–$196. This zone aligns with key confluences — 0.382 Fibonacci retracement, VWMA support, and a 1H demand/OB cluster. As long as SOL stays above $192, the bullish structure remains intact. Once momentum indicators (RSI > 55 + QQE green) confirm support in that zone, a new Wave (5) expansion is expected, targeting $211–$219 within the next few days. Scenarios: Base Case: Controlled dip to $195–$196 → continuation to $211–$219 (Wave 5). Invalidation: Daily close below $191.8 would neutralize the bullish count. Bias: Bullish continuation after pullback Timeframe: 1H–4H (Short- to mid-term outlook) Next key levels: Support $195–$196 → Targets $211–$219SOL / USD – Wave (4) Corrective Pullback Holding Key Zone (1H–4H Outlook Update) Price action continues to respect the projected Wave (4) correction zone between $192 – $195, aligning with the 0.382 Fib retracement of the prior Wave (3) leg and the lower Ichimoku cloud edge. Despite short-term weakness, the larger impulsive count toward Wave (5) remains intact as long as this support band holds on 4-hour closes. The 1-hour structure shows a clear three-legged (a-b-c) correction finishing near $192.8 with bullish absorption tails and reduced sell-side delta. OBV remains stable and no breakdown has confirmed below the VWMA (200). Momentum outlook: – RSI Games printing mixed H-Bear/H-Bull signals but curling from mid-40s zone. – QQE and CM_Ult MACD beginning to flatten, suggesting bearish momentum is fading. – Volume declining through the correction, which favors accumulation over distribution. Ichimoku & EMA structure: Price still trades within the 4H cloud and above the 100 EMA cluster. A daily close back above $198.5–$200 would confirm bullish continuation and trigger Wave (5) initiation toward the $205 – $210 supply zone. Invalidation: A decisive 4H close below $191.5 – $188.8 would violate Wave (4) proportions and confirm a structure shift → neutral-bearish. Near-term plan: – Maintain long bias while $191–$192 support holds. – Add on reclaim of $198.6 + volume confirmation > 15 k. – First Wave (5) target: $205.3, secondary extension: $211 – $214.
keyvankho
اصلاح بیت کوین ادامه دارد: آیا کف قیمتی بعدی زیر ۹۵ هزار دلار است؟

Bitcoin is currently around $107 K and is likely to see a small bounce early in the week, moving up toward $110 K–$112 K as it retests broken support and the moving averages — this is not a new uptrend, just the market catching its breath before deciding the next move. Once price reaches that $110 K–$112 K zone, sellers are expected to return, leading to another drop toward $102 K–$100 K by mid to late week, and if selling pressure remains strong, a quick dip to $98 K–$95 K is also possible before the weekend. This final leg down would likely complete the correction and create a better long-entry zone for the next bullish phase. However, this bearish outlook would be invalidated if Bitcoin closes a full daily candle above $114 K with strong volume and bullish momentum — in that case, the market would flip back to bullish early, and BTC could climb toward $120 K–$126 K instead of continuing the drop. What’s your outlook for the next BTC move? Do you also expect a rejection near $112 K, or do you think the correction is already over? Drop your thoughts or charts in the comments — let’s compare our views #Bitcoin #ShortSetup #BTCUSDT
keyvankho
SOL/USDT Wave C Still Unfolding | Short Bias Until $194–186 Zone

OL/USDT has completed a 5-wave push into the $253 top and is now unfolding a corrective A-B-C move. Price is breaking below the $200 psychological level, with liquidity resting at $197–194. If this zone fails, Fibonacci projections point toward $186–184 and even $174–160 for full C-wave completion. Any bounce into $205–210 or $215–220 should be viewed as a bearish retest and potential short entry unless structure is reclaimed. For bulls, the first real opportunity comes only if a hammer/engulfing candle with RSI/MACD divergence forms at $194–186, or on a deeper flush into $174–160. A clean break and hold above $220 would be the first sign of bullish reversal. Until then, bias remains short into lower supports. Tags: #SOL #Solana #Crypto #ElliottWave #TechnicalAnalysis #Altcoins #SwingTrade #Bearish #ABCMove #TradingViewUpdate – Sep 30, 2025 Price has now broken down from the rising wedge and retested the broken trendline near $209–210. Short-term momentum remains bearish with QQE, RSI, and MACD all aligned to the downside. Immediate support sits at $206–207, but if this level fails, the original $194–186 Wave-C target zone comes back into focus. For now, upside is capped by resistance at $212–214 (supply zone + broken structure). Any bounce into this region is still viewed as corrective unless bulls reclaim and hold above $214 with volume. As long as that doesn’t happen, the short bias from the original post remains valid, with next major demand expected around $194–186.Update: The short bias toward $194–186 is now invalidated. Price has broken out strongly above the $223–225 resistance with volume confirmation and bullish momentum across indicators. As such, the short position is considered closed here around $225–227. I will reassess the structure for potential long continuation setups if SOL maintains support above $223, with upside targets toward $230–235 and beyond.
Disclaimer
Any content and materials included in Sahmeto's website and official communication channels are a compilation of personal opinions and analyses and are not binding. They do not constitute any recommendation for buying, selling, entering or exiting the stock market and cryptocurrency market. Also, all news and analyses included in the website and channels are merely republished information from official and unofficial domestic and foreign sources, and it is obvious that users of the said content are responsible for following up and ensuring the authenticity and accuracy of the materials. Therefore, while disclaiming responsibility, it is declared that the responsibility for any decision-making, action, and potential profit and loss in the capital market and cryptocurrency market lies with the trader.