Technical analysis by keyvankho about Symbol SOL: Buy recommendation (10/27/2025)

keyvankho
سولانا (SOL) قبل از اوجگیری بزرگ بعدی: فرصت خرید در محدوده ۱۸۵ تا ۱۹۶ دلار!
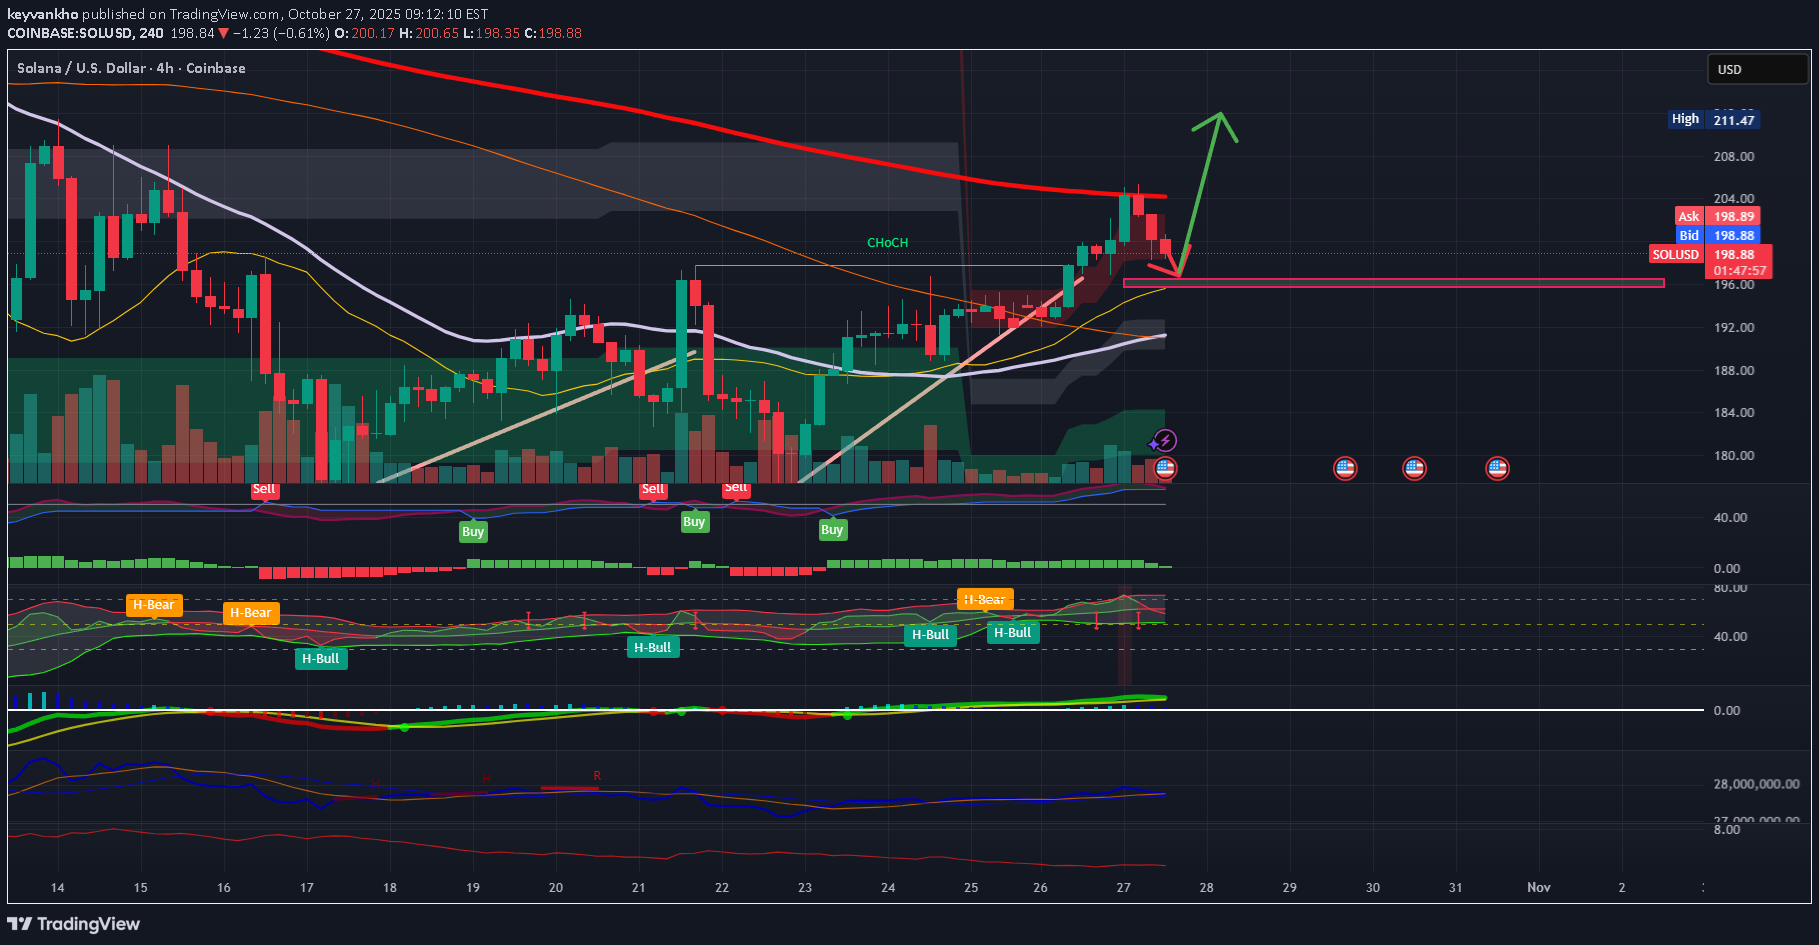
Solana is currently consolidating near $200–$205 after a strong impulsive move from the $177 base. On the 1H–4H timeframes, price action suggests that Wave (3) has completed, and the market is preparing for a short-term Wave (4) correction toward $195–$196. This zone aligns with key confluences — 0.382 Fibonacci retracement, VWMA support, and a 1H demand/OB cluster. As long as SOL stays above $192, the bullish structure remains intact. Once momentum indicators (RSI > 55 + QQE green) confirm support in that zone, a new Wave (5) expansion is expected, targeting $211–$219 within the next few days. Scenarios: Base Case: Controlled dip to $195–$196 → continuation to $211–$219 (Wave 5). Invalidation: Daily close below $191.8 would neutralize the bullish count. Bias: Bullish continuation after pullback Timeframe: 1H–4H (Short- to mid-term outlook) Next key levels: Support $195–$196 → Targets $211–$219SOL / USD – Wave (4) Corrective Pullback Holding Key Zone (1H–4H Outlook Update) Price action continues to respect the projected Wave (4) correction zone between $192 – $195, aligning with the 0.382 Fib retracement of the prior Wave (3) leg and the lower Ichimoku cloud edge. Despite short-term weakness, the larger impulsive count toward Wave (5) remains intact as long as this support band holds on 4-hour closes. The 1-hour structure shows a clear three-legged (a-b-c) correction finishing near $192.8 with bullish absorption tails and reduced sell-side delta. OBV remains stable and no breakdown has confirmed below the VWMA (200). Momentum outlook: – RSI Games printing mixed H-Bear/H-Bull signals but curling from mid-40s zone. – QQE and CM_Ult MACD beginning to flatten, suggesting bearish momentum is fading. – Volume declining through the correction, which favors accumulation over distribution. Ichimoku & EMA structure: Price still trades within the 4H cloud and above the 100 EMA cluster. A daily close back above $198.5–$200 would confirm bullish continuation and trigger Wave (5) initiation toward the $205 – $210 supply zone. Invalidation: A decisive 4H close below $191.5 – $188.8 would violate Wave (4) proportions and confirm a structure shift → neutral-bearish. Near-term plan: – Maintain long bias while $191–$192 support holds. – Add on reclaim of $198.6 + volume confirmation > 15 k. – First Wave (5) target: $205.3, secondary extension: $211 – $214.